
 ?Mathematical formulae have been encoded as MathML and are displayed in this HTML version using MathJax in order to improve their display. Uncheck the box to turn MathJax off. This feature requires Javascript. Click on a formula to zoom.
ABSTRACT
The construction method for chains of disasters or events is still one of the core scientific questions in studying the common rules of disaster’s evolution. Especially when dealing with the complexity and diversity of disasters, it is critical to make a further investigation on reducing the dependency of prior knowledge and supporting the comprehensive chains of disasters. This paper tries to propose a novel approach, through collecting the big scholar and social news data with disaster-related keywords, analysing the strength of their relationships with the co-word analysis method, and constructing a complex network of all defined disaster types, in order to finally intelligently extract the unique disaster chain of a specific disaster type. Google Scholar, Baidu Scholar and Sina News search engines are employed to acquire the needed data, and the respectively obtained disaster chains are compared with each other to show the robustness of our proposed approach. The achieved disaster chains are also compared with the ones concluded from existing research methods, and the very reasonable result is demonstrated. There is a great potential to apply this novel method in disaster management domain to find more secrets about disasters.
1. Introduction
The dynamic process of emergency response determines that the emergency management system is an open giant system, which has complex characteristics such as multi-agency, multi-factor, multi-scale, variability and so on (Fan Citation2007). There are many profound scientific problems in this research field. It is of great significance to master the regular patterns of the occurrence and development of disasters in order to control and reduce their negative impacts (Xue, Peng, and Zhang Citation2002). Many historical cases show that a disaster is not an isolated and static event. Under certain conditions, the secondary and derivative disasters will occur along with the development of the original one. The initial disaster and a series of derived disasters may constitute a chain, and each one is likely to lead to another one (Wang and Yuan Citation2010). The mutual coupling of various disaster-causing factors, such as natural factors, biological factors, physical factors, chemical factors, human factors and so on, further lead to the complex correlation along the chain of disasters (Yu et al. Citation2014). The in-depth study of disaster chain is one of the key scientific issues in finding the regularities during disasters’ evolution processes. Especially in the face of complex and frequently occurred emergencies, how to discover the relationships among latent disasters and build up the comprehensive disaster chain is an urgent challenge in the field of public safety science (Li Citation2017).
The devastating hurricane Katrina in 2005 caused a series of storm surges and floods in Gulfport, Mississippi, New Orleans, Louisiana, and areas in between, and resulted in thousands of fatalities and billions of US dollars of economic losses (CNN Citation2017). In 2008, the freezing rain and snow disaster in the south of China triggered a serious of hazards, including roads blocking, power grids collapse and so on, which brought the economic losses of about 150 billion yuan (Chen et al. Citation2011). In 2011, the earthquake and tsunami in the east of Japan not only took the lives of more than twenty thousands of people, but also destroyed the Fukushima nuclear plant and led to a serious radioactive material leakage accident, which brought a worldwide and long-term impact (Forward Citation2017). The heavy casualties and losses of these catastrophes are caused by the complex temporal and spatial interactions of both the original and secondary disasters. In many cases, the secondary and derivative disasters could have even more destructive power than the original one (Ha et al. Citation2016).
Therefore, we should not regard each disaster as an independent individual, but consider multi-hazard as a chain-cycle system that has the mutual coupling relationships. Due to the chain relationships among disasters, it is meaningful to investigate the disaster chain and find out the major secondary disasters from an original one, which can help the emergency manager to better prepare in advance and minimum the losses by eliminating the key triggered factors and cutting off the chain (Wang and Yuan Citation2010).
The typical methods for studying disaster chain mainly include probability analysis method based on simulation data and experimental data (Helbing and Kühnert Citation2003; Li et al. Citation2010; Wang, Gao, and Xin Citation2010), geospatial analysis method based on remote sensing images (Gitis, Petrova, and Pirogov Citation1994; Zhou et al. Citation2014; Hallegatte Citation2008), and disaster evolution analysis based on complex network theory (Liu and Wu Citation2015; Lin et al. Citation2012; Chen, Li, and Sun Citation2008; Li and Chen Citation2014). The above research approaches mainly apply qualitative researches, and rely heavily on the historical cases and the prior knowledge of experts. Most of the research results are the disaster chain of one or several typical disasters in certain local areas, which could not provide comprehensive expressions for ubiquitous disaster types (Ha et al. Citation2016).
With the rapid development of big data theory, the techniques and methods for mining the explicit and implicit information from massive data have been increasingly becoming mature (Sánchez, Craglia, and Bregt Citation2016). Currently, in many scholar data repositories and news portal websites, such as Baidu Scholar, Google Scholar, Sina News and CNN News, there are tremendous amounts of information related to disasters. It can be speculated that there must be some useful scholar papers in the search results to help us finding the secrets of the relationships among various disasters. Therefore, it is worthy of trying the brand-new attempt to apply the big data methodology in the disaster chain research domain.
From the new perspective, this paper intends to explore the big data mining method to analyse the latent relationships of the disasters classified in four major categories and more than 300 sub-categories proposed by China (China Citation2007), based on the massive scholar data and social media news data from different sources. By means of scholar and news big data analysis, this methodology no longer depends on the domain expert’s priori knowledge or limited historical cases, and is able to provide a universal and intelligent method to find out the patterns of disaster chains for all defined types of disasters. Furthermore, the degree of relationships among disaster types can be evaluated quantitatively by the co-occurrence analysis and a certain chain of disasters can be extracted through our method.
The remainder of the paper is organized as follows. Section 2 introduces several major research methods for studying disaster chain so far. Section 3 elaborates on the big datasets, the major theories and the technology roadmap adopted in our research. Section 4 explains the proposed methodology and gives a detailed description about the computational procedures. Section 5 compares the research results of three search engines (Google, Baidu and Sina), and as well compares the results with the ones achieved by existing methods. Then the last section gives our conclusions and discusses the further work.
2. State of art in the field of disaster chain
There are many scholars concerning about the disaster chain researches, one hotspot of the disaster management or emergency management domain. But due to the numerous types and the complex coupling relationships of all possible disasters, it is hard to launch experiments to simulate them all in the lab. Also, the historical cases data is relatively inadequate. The researches in this direction mainly focus on several specific disasters, such as earthquake, typhoon and flood. Based on our extensive literature work, three typical approaches for studying disaster chain are summarized as follows.
2.1. Probability analysis method based on simulation data and experimental data
The disaster chain involves the triggering relationship between disasters, and this triggering relationship is not inevitable in reality. Almost any disaster has the probability, but not certainly, to trigger some other secondary disasters. The probability analysis method tries to build an event tree to analyse and filter the secondary disasters that may be triggered by an original one, and then calculate the conditional probabilities of the occurrence for those secondary disasters (Yu Citation2010; Dong Citation2009).
There are several ways to calculate the conditional probabilities for the disaster chain. Some scholars use the Bayesian network model, which can infer the conditional probabilities of events in the same network based on the limited known information (Wang, Gu, and Huang Citation2013). In addition, other methods, such as neural networks (Wei et al. Citation2000), and expert scoring systems (Liu et al. Citation2006), can be used to determine the conditional probabilities of disasters in the chain as well. Wang, Gao, and Xin (Citation2010) combined field data with artificial neural networks to analyse the probability of building collapse caused by the earthquake. Li et al. (Citation2010) proposed a mathematical function model that described the interactions among disaster-causing factors and disaster-bearing bodies, and then constructed a disaster chain of the earthquake and performed some experimental verification. Helbing, Dirk, and Christian Kühnert (Citation2003) applied the main equations of statistical physics to construct the influence matrix which reflected the correlation between disasters, and then considered a semi-quantitative analysis of the time-dependence of catastrophes for the purpose of anticipation.
The current research based on probabilistic analysis method is mostly focused on the interactions among disaster-causing factors. Other factors such as the hazard-inducing environment have not received enough considerations (Han et al. Citation2014). Meanwhile, the commonly used method for calculating conditional probabilities is the expert scoring method at present, which mainly depends on the prior knowledge of experts and may affect the objectivity and universality of the result.
2.2. Geospatial analysis method based on remote sensing images
Geospatial technology of Digital Earth has entered into many scientific applications and been proven crucial for effective disaster management, including traditional GIS-based technologies (Mccarthy, Graniero, and Rozic Citation2008), human–GIS interaction issues (Cai Citation2008), 3D GIS solutions (Kwan and Lee Citation2005) and many others. For the disaster chain researches, the large-scale and widespread disasters such as the earthquake and geological disasters are often analysed by the means of geospatial technology such as remote sensing image processing and GIS spatial analysis methods.
After analysing thousands of satellite images about the Sumatran earthquake in Indonesia and the great flood in the West River, Yao and Qiang (Citation2006) proposed the mechanism of the earthquake disaster chain and the typical phenomenon of seismic-flood. Liu (Citation2013) used multi-source and multi-temporal satellite images to extract debris flow information and studied the characteristics of typical channels in depth, and then analysed the disaster chain of debris flows in Parlung Zangbo basin in Tibet.
Meanwhile, with the application of multiple remote sensing sensor platforms and the improvement of interpretation methods, it can provide a reliable access to discover the secondary disasters from high-resolution remote sensing images. Especially after the 2008 Wenchuan earthquake, many scholars started to study the disaster chain of the earthquake. Fan et al. (Citation2008) used multi-source remote sensing data to obtain the information of barrier lakes induced by the earthquake. Xu et al. (Citation2012) used the remote sensing images to study the consequences of the chain of the earthquake, including the debris flow, the drastic river bed movements and the ecological changes. Liang, Tang, and Wang (Citation2012) fused and compared the surveying data and remote sensing images of Redstone river basin of Qingchuan city before and after the earthquake to analyse the characteristics of earthquake-geological disaster chain.
Obviously, the geospatial analysis method has outstanding features to support scientists to study the relationships between disasters, especially for geological, and meteorological disasters. Many good research results have been achieved and are beneficial for the disaster management. However, datasets with enough temporal scale, spatial scale and good quality are relied on, and only limited types of disaster chains can be investigated. Thus, it is difficult to extend this method to many other types of disasters.
2.3. Disaster evolution analysis method based on complex network theory
Complex network is a network with the complicated topological features, which has been used in many fields such as life sciences, engineering sciences, information sciences, social sciences and so on (Miller, Vandome, and Mcbrewster Citation2010). It has begun to attract the attention of some scholars to study the dynamic process of disaster chain using the complex network theory (Zheng et al. Citation2017).
For disasters such as snow storm, rain storm and typhoon, the preliminary applications of disaster evolution analysis method have been carried out. Liu and Wu (Citation2015) proposed a risk evaluation model for disaster chain based on the complex network structure, and gave the mathematical description about the chaining mechanism. Lin et al. (Citation2012) used it to analyse the evolution mechanism of college campus fire hazards. Li and Chen (Citation2014) expressed the process of the disaster chain of city blackouts by constructing a complex network. Chen, Li, and Sun (Citation2008) adopted it to construct the network of the freezing rain and snow disasters, and analysed its evolution process and characteristics.
However, at present, the applications of complex network theory in the disaster chain research field are still underway, and generally are only adopted for demonstrating the visual process. The scholars have not yet proceeded with the further research on the ‘degree’ of network nodes and the semantic assignment of network edges. The overall features of the complex networks have not been explored in depth. The mining and analysis of the networks are still absent, and the structural advantages of complex networks have not yet been fully utilized.
The above three approaches demonstrating the researches on disaster chain are nowadays popular. However, a unified and mature theory and methodology system has not been established (Yu et al. Citation2014). Three main problems still remain.
The existing researches are still limited to several typical disasters in certain study areas, such as the typhoon disaster chain in the coastal areas and the seismic geological disaster chain in the mountainous areas.
Disaster evolution analysis methods and geospatial analysis methods are mostly adopting qualitative researches about the evolution process and the propagation mechanisms. Only a few studies have quantified the disaster chain by establishing mathematical and physical models.
Most probability analysis methods and disaster evolution analysis methods are confined to one or several historical cases, and the results usually depend on a large amount of prior knowledge and expert experience. Consequently, it is lack of universality and feasibility to explore many other type of disasters.
Aiming at solving the exposed problems, this paper intends to discover the relationships of all types of disasters through mining the big scholar and social news datasets and construct one complex network of disasters, whose nodes are the disaster types and edges are the relationships among disasters. What’s more, the subnet division theory would be investigated to extract a specific disaster chain from the disaster complex network.
3. Data and methodology
This research tries to employ the pure big data method to reveal the relationships among disasters, and therewith the primary task is to determine the data sources. People discuss the reasons, developments, caused damages and all other aspects about disasters in many places. The massive data directly or indirectly illuminate the complex relationships among the disasters. For instance, some explicit descriptions about the relationships occur in the academic articles, like the disaster chain of typhoon (Chen, Chen, and Wang Citation2007), the secondary disasters of the earthquake (Tang Citation2008; Men Citation2007). Some descriptions are not focusing on the disaster chains, but mention some of their relationships, and these cases appear in both academic articles and news web pages, like the derivative damages caused by the earthquake (CHINA Daily Citation2011) and typhoon (CNN Citation2013). Therefore, the scholar data and Internet news data are chosen in our research work.
Google Scholar and Baidu Scholar data repository, as well as Sina News website, are selected as the data sources. Google Scholar (https://scholar.google.com/) is a freely accessible web search engine that indexes the full text or metadata of scholarly literature all over the world, including most online academic journals and books, conference papers, theses and dissertations, preprints, technical reports, and others. Most of the articles published in English can be searched there. Baidu Scholar (http://xueshu.baidu.com/) originating from Baidu search engine which is the biggest Chinese search engine in the world, covers most of the articles published in Chinese and is superior to Google Scholar in Chinese search (Xie, Guan, and Yang Citation2015). Google and Baidu both provide a convenient one-stop search service allowing us to easily access the detailed information of articles with developed software tool. Other scholar search engines like Oalib, Library Genesis and many others, only specialize in certain subjects and are inferior to Google Scholar and Baidu Scholar in search amount and range. In this way, Google Scholar is taken as the English literature data search engine and Baidu Scholar is regarded as the Chinese literature search engine.
News articles capture a variety of topics about our society, which reflect not only the socioeconomic activities that happened in our physical world, but also some of the cultures, human interests, and public concerns that exist only in the perceptions of people (Hu, Ye, and Shaw Citation2017). Disasters are frequently discussed in news articles, and the content of news articles always aggregate all related information about each disaster, such as spatial, temporal and hazard-related information (Wang and Stewart Citation2015). Two or more disasters may co-occur in the same article. Such co-occurrence often suggests certain relatedness among the disasters. From the Internet news, we could find the whole course of the events, including the reasons, the situational developments, the statistical data and other information. Comparing with scholar data, news data may provide wider coverage and more details.
Sina News (http://news.sina.com.cn/) is one of the most famous Chinese news websites, and it provides a lot of latest feature news. A simple test has been done to show the popularity of different Internet news websites, including Sina News, Baidu News, Tencent News and Ifeng News, who are the most leading news portals in China. shows the search results returned from those websites when using different disaster-related keywords: typhoon, fire hazard, earthquake, and tsunami (in Chinese Pinyin separately called ‘taifeng’, ‘huozai’, ‘dizhen’, ‘haixiao’). Obviously, Sina News have much more amounts of data information than others. It also offers advanced search options for performing search and filter assignments. Therewith, Sina News is selected as the news repository in our research.
Table 1. Comparison of the number of search results between news websites (accessed March 9, 2018. Similarly hereinafter for all searched datasets).
Because news data is considered as the supplement of scholar data to enhance the volumes of the disaster-related datasets in our research, the search keywords of news are only restricted to Chinese. Although more amounts of experimental data can be acquired through other language’s news websites, only search results of Sina News with Chinese keywords are considered due to the balance between effectiveness and quantity.
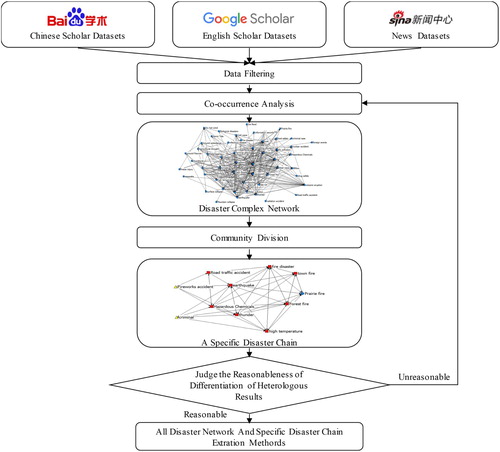
Aiming at finding the latent relationships among various disasters from the massive data, our research technical route is illustrated in . Google Scholar and Baidu Scholar as the scholar experimental datasets, and Sina News as the social news database are taken into account in this research. In order to reduce the invalid data or noisy data from the original data sources, data filtering method is applied to improve the quality of the analysing datasets. All relevant datasets about disasters from scholar papers and news are achieved through this step.
Figure 1. Research technical route.
Co-word analysis is a form of co-occurrence analysis method, which is one kind of content analysis methods that have been widely employed to conduct a variety of researches for exploring the hot topics and development trends of some specific domain (He Citation1999; Liu et al. Citation2014). It does not rely on any priori definition of research terms, and thus can objectively detect the dynamics of science. Indexes based on the co-word frequency of items can be used to measure the strength of relationships between items.
Enlightened by the productive applications of co-word analysis method in other domains, we adopt it to compute the co-occurrence of disaster type related terms within the experimental datasets, and thus construct the complex network of those terms in order to represent the degree of relationships. Complex network method as a graph with more advanced topological features is recently studied and becomes an active area of scientific research inspired by the empirical study of real-world networks such as brain networks, social networks and computer networks. The related researches are developing at a brisk pace and become a multidisciplinary field including mathematics, physics, sociology, computer science, biology, engineering science and many others. The chain of hundreds of disaster types actually involves relationships between any of two disaster types. The weight of relationship can be graphed and represented as the connection between the two disaster types according to their closeness. Disaster chain can be naturally constructed and more importantly be analysed by the means of complex network method, and thus to establish the primary relationship network. Based on that, different results achieved from different data sources, including Google Scholar, Baidu Scholar and Sina News are compared and discussed. The overall analysing results will also be compared with the traditional studies.
The refined network of all hazards consists of all possible relationships among them. But in practical applications, the decision maker of emergency management always cares for a specific chain of a disaster. For example, the disaster chain of typhoon and the disaster chain of earthquake cause different attention in coastal regions or in mountainous regions. Therefore, an intelligent extraction method to get any chain of interest from the refined complex network is investigated. Community division method is a well-known approach to divide the complex network into different subnets, and it includes different algorithms such as GN algorithm (Girvan and Newman Citation2001), Label propagation algorithm (Kothari and Jain Citation2002), and Maximum flow algorithm (Ford and Fulkerson Citation1956). One of the algorithms is adopted in our research to fulfil the purpose of extracting the wished chain of a specific disaster.
4. Implementation of the proposed methodology
4.1. Determination of search mode
Co-word analysis method is employed in this research to measure the importance of the relationships among different disaster types. Basically, co-occurrence of two disaster types in the same article is counted when this matched article is found in scholar datasets or news datasets. By means of search engine, the amount of search results matching the co-occurrence rule is recorded.
Searching the keywords at different locations of an article may bring about different search results. Baidu Scholar, Google Scholar and Sina News all provide similar search modes including ‘search words occur in the title of the article’ or ‘anywhere in the article’ within their advanced search function. Obviously, disaster type keywords may appear many times in one article if it really concerns many aspects of the disaster types. Therewith, ‘search words occur anywhere in the article’ mode is taken into account as the fundamental search rule. Moreover, ‘Find articles with all of the words’ and ‘with the exact phrase’ search modes are optional in all of the selected search engines and the research results may differ. Particularly in Chinese words, a long term may be divided into more than one semantic word even no space character between the words if the first option is selected, and thus research results are not same as expectation. Therefore, ‘Find articles with the exact phrase’ mode is employed in our research as the fundamental search rule as well. For instance, if applying the co-occurrence of ‘typhoon’ and ‘flood’ keywords through Google Scholar search engine according to the above-determined search rules, the amount of searched results is 34,700.
For the same disaster type, different semantic expressions of search keywords certainly bring about different search results, no matter in Chinese or English. For example, ‘fog’ keyword achieves 1,100,000 search records and ‘fog disaster’ keyword achieves only 90,800 search records through the Google Scholar search engine. The search results with ‘fog’ keyword contain huge amounts of papers studying on the weather, climate or meteorology fields, and they contain disaster-related researches as well since it has the inclusion relationship with ‘fog disaster’ keyword. But the search results with ‘fog disaster’ keyword may omit scholar papers only with ‘fog accident’, ‘fog incident’ or other semantic expressions relating to disaster researches. Therefore, the data filtering assignment is firstly performed every time to single out the papers in the disaster research domain with either of the keywords of ‘accident’, ‘incident’, ‘emergency’ and ‘disaster’. In this way, the consequent secondary search will not take those disasters semantically related keywords again.
For the search mode in Chinese, traditional Chinese and simplified Chinese characters with completely same semantic meaning in the search engine will receive totally different search results, due to the complexity and diversity of Chinese. For example, ‘typhoon’ keyword in simplified Chinese achieves 155,000 records and in traditional Chinese achieves 27,100 records, and the search results do not have any duplication. Therefore, we will consider both simplified and traditional Chinese keywords when facing with one semantic search term. However, this case doesn't apply in English search work.
For the search mode in English, singular and plural issue matters the search results. For example, ‘sandstorm’ keyword in Google Scholar achieves 20,600 search results, ‘sandstorms’ achieves 21,300 search results, and their overlapping ‘sandstorm sandstorms’ achieves 3360 search results. That is, the papers discussing the semantic meaning relating to sandstorm have the amount of 38,540 (20,600 + 21,300 − 3,360) search records, which are far more than the ones using only singular or plural keyword. Therefore, we need to search both singular and plural keywords and integrate the results to avoid the omission. Interestingly, this case doesn’t apply in Chinese search work.
4.2. Determination of disaster-related keywords filtering
To better understand the nature of disasters and set up the suitable strategies, China explicitly classified disasters into four major categories and more than 300 sub-categories, including natural disasters, calamitous accidents, public health incidents and social safety incidents (China Citation2007). Each kind of major disaster is again classified into detailed subclasses in several levels in order to prevent the ambiguity of the general classification. For example, a landslide event is one of the subclasses of geological disasters, and a geological disaster is one of the subclasses of natural disasters.
Many of the subclass disaster types seldom occur in the reality or are not often discussed in the scholar papers and news articles. Considering over 300 subclasses of all possible disaster types into the search work will bring complicated processing data, and more importantly not all of them are interesting for the consequent disaster chain research. Therefore, first and foremost, all of the disaster type subclasses are separately searched through Baidu Scholar and the number of search results for each keyword is tallied up. Web crawler is used to help to get the data. Web crawler can be regarded as an Internet bot that systematically browses the World Wide Web normally for the purpose of web indexing based on certain defined rules. It can be a program or script developed in different computer languages (Guo Citation2017), and Python programming language is adopted in our research. Some of the results are picked and listed in .
Table 2. Some of the search results through Baidu Scholar.
The left column of lists the top 10 disaster types of the largest number of search results, and the right column lists the other 10 disaster types of around 1000 search results. More search results occur, more scholars or public concern about the disaster types. The statistics show that there are 73 disaster types with the search results over 1000 items, 50 disaster types with the search results between 100 and 1000 items, and the remaining over 200 disaster types with only search results less than 100 items. When searching the same 73 disaster types via Google Scholar, the amount of search results for each of 73 gets the items over 1000 as well. When the complexity of computation and the importance of disaster type are considered together, only 73 disaster types with over 1000 search results are determined to be selected as the keywords in the consequent co-word analysis. The expression in both Chinese Pinyin and English of all 73 disaster types are listed in Appendix.
4.3. Computation of co-occurrence matrix
Based on the determination of search mode and selected keywords, three search engines are used to find the matched records. The co-occurrence frequencies between each of the 73 candidates (see Appendix) are able to be calculated, and a matrix can be created. Since the total amount of co-occurrence relationships between each pair of 73 candidates is 2701, it is hardly possible to search them one by one manually.
Web crawler is adopted in our research to implement the task of finding the matched keywords, automatic updating keywords, recording and summarizing search results, and finally constructing the 73*73 matrix of co-occurrence frequencies. Partial results from Google Scholar search engine are presented in .
Table 3. Partial disaster co-occurrence frequency matrix obtained using Google Scholar.
In , the numbers on the diagonal can be read as the amount of articles containing the keyword, for example, there are 1,854,000 articles mention the term ‘flood’. The rest of the numbers mean the amount of articles that talk about two terms, for example, there are 9560 articles mention both the ‘flood’ and ‘waterlogging’.
When measuring the degree of relationship between two disaster types, the occurrence of each disaster type have also to be considered. The more the matched articles of one disaster type are found, the more the matched articles of its co-word with other disaster types are found, and vice versa. It is needed to set up a parameter for considering the impact, and well qualify the strength of the correlation between different disaster types. Therefore, the method of calculating the co-occurrence degree is introduced to handle with this problem. To get the co-occurrence degree, recent studies of Dice index, Jaccard index, Salton index and others are proposed and applied by many scholars (Yin and Yasuda Citation2005). Egghe (Citation2009) compared those index algorithms and concluded that Salton index has correlation relation with most of other index algorithms, except Jaccard index. Both Jaccard index and Salton index can make two closely related keywords become closer, and two distantly related keywords more distant. Loet (Citation2008) made a detailed comparison between Jaccard index and Salton index, and found that if the only option is to generate a co-occurrence matrix especially applying in webometric research, the Jaccard index is the best basis for the normalization. Therewith, we adopt the Jaccard index in the next computation step.
The Jaccard Index formula is(1)
(1) In Equation (1), Jij represents the co-occurrence index of disaster type i and disaster type j. cij represents the co-occurrence frequency of disaster type i and disaster type j, and ci and cj separately represent the frequency of disaster type i and disaster type j, as searched through various scholar or news search engine. illustrates the co-occurrence index matrix calculated through Jaccard index.
Table 4. Jaccard index-based disaster co-occurrence frequency matrix (partly).
4.4. Construction of disaster complex network
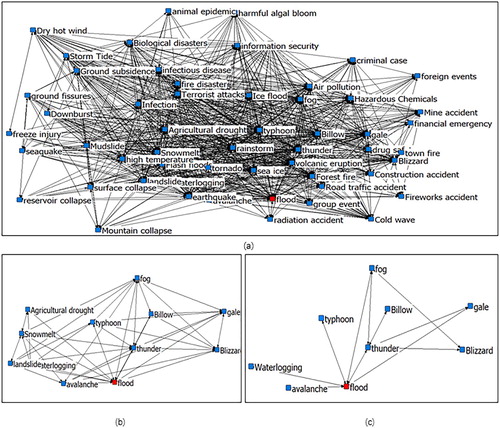
With the calculated co-occurrence matrix, the disaster complex network can be constructed based on the principal complex network theory. represents a complex network, where the search results accessing from Google Scholar, the co-occurrence matrix calculated by Jaccard index, and the disaster types defined in Appendix. In this complex network graph, every disaster type of 73 kinds represents a node, and the co-occurrence rate of any of two disaster types denotes an edge if the co-occurrence value is above 0.
Figure 2. The constructed complex network graph of 73 disaster types.
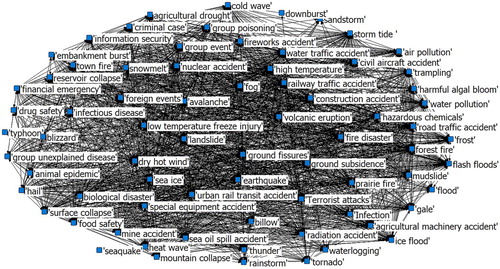
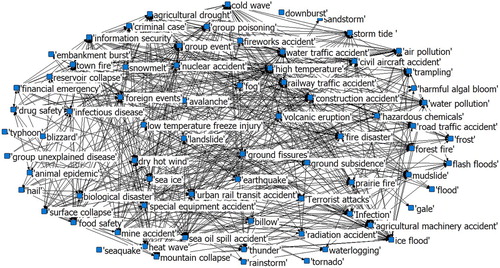
consists of 73 nodes and 1567 edges. The number of nodes connecting to each node is called the node degree, and the average of all nodes’ degree is named the network average degree, which are used to represent the complexity of a complex network. Thus, the network average degree in equals 1567 * 2/73 ≈ 43, which means that averagely each node has the connection with 43 other nodes. In order to reduce the complexity of the network and extract the prominent information, it is necessary to optimize the graph. The co-occurrence shows the strength of correlation relation between two disaster types, that is, the smaller the value is, the weak the correlation is. Appropriate threshold can be set to eliminate the interference of the unimportant connections, and to simplify the network. For example, if the value of 0.03 is set to the threshold, the number of network edges become 536, the network average degree is around 15, and 2 isolated nodes occur (the nodes not connecting with others). If the value of 0.04 is applied, the number of network edges become 363, the network average degree is around 10, and 5 isolated nodes occur. The selection of different threshold values is meaningful and may be altered in respective researches. The threshold decision rule will be discussed in next subsection. shows the optimized complex network graph with the threshold value of 0.03.
Figure 3. The optimized complex network graph with threshold value 0.03.
4.5. Extracting a special disaster chain from the complex network
Although the complex network has been simplified with proper threshold settings, however, it is still too inconvenience to be used directly in the practical applications. The decision maker of disaster management always cares for a specific chain of a disaster. Therefore, an intelligent subnet division method is investigated to extract a disaster chain of interest from the refined complex network.
Community division method is a well-known approach to divide a whole complex network into several individual communities. Each community can be regarded as a subnet. There are two kinds of community structures. One is disjoint communities, and the other is overlapping communities, as presented in (a,b). As for disjoint communities, the intersection of vertex sets of any two communities is empty, and overlapping communities have common vertex sets.
Figure 4. The structures of communities: (a) disjoint communities and (b) overlapping communities.
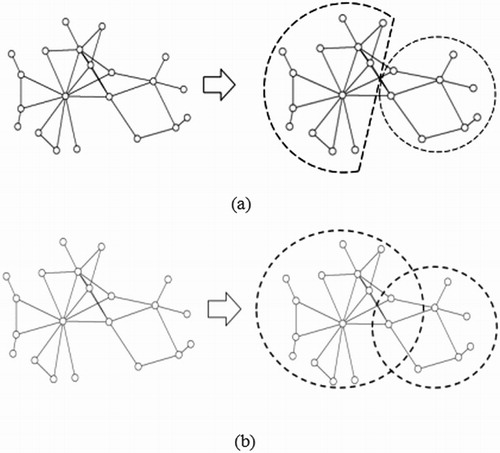
Different original disasters may lead to the same secondary one. For example, both typhoon and earthquake are possible to trigger the landslide hazards, which means that when dividing the disaster complex network into different communities, some communities may have common nodes. Therefore, the algorithms for overlapping communities division would better fit the disaster chain extraction task.
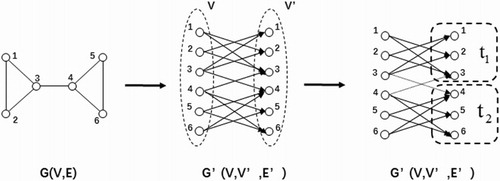
There are various algorithms that are adapted to either disjoint communities or overlapping communities. Several algorithms fitting with overlapping communities such as k-Clique-Community Finding Algorithm (Palla et al. Citation2005), Algorithm Based on Edge Vector Clustering (Evans and Lambiotte Citation2009; Ahn, Bagrow, and Lehmann Citation2010), Improved Maximum Flow Algorithm (Ford and Fulkerson Citation1956), etc., have been tested in our research and the Improved Maximum Flow Algorithm shows the best extraction results. This algorithm has the feature of finding out the cluster around a selected core, which is similar to the process of constructing a disaster chain. Thus, a bipartite network is firstly created based on the disaster complex network, and the improved maximum flow problem of the bipartite network is solved to get the community division results.
shows the process of calculating the flow value for a community. A network G(V,E), that has the node-set V and the edge-set E, is extended to a bipartite network G′’(V,V′,E′). The node-set V′ is equal to V, so if G(V,E) has 6 nodes and 7 edges, G′(V,V′,E′) has 12 nodes and 14 edges. Moreover, we divide G(V,E) into two initial communities: t1 and t2. The inter-flow and total-flow of community are respectively defined as Equation (2) and Equation (3). The efficiency of community is calculated by Equation (4). The value of fij is 1 when there is an edge between node i and node j, else fij is zero. For community t1, it has 3 nodes. There are six edges among its internal nodes and one edge between its internal nodes and outer nodes, as the solid lines and dotted line shown in flowing into t1. Therefore, t1’s inter-flow f is 6 and total-flow k is 7. Its efficiency is 6/7. A node outside could be added into the community only in the case that its entry can promote the efficiency of the community.(2)
(2)
(3)
(3)
(4)
(4)
Figure 5. The flow of communities.
When using the Maximum Flow Algorithm to extract a special disaster chain, like the disaster chain of ‘typhoon’, the following steps are carried out.
Select ‘typhoon’ node and add any one of its connected nodes to establish an initial community.
Calculate the efficiency of the rest nodes in the whole complex network one by one, supposing it is considered in the initial community.
Find out the node with the maximum efficiency to improve the flow value of the initial community, and add it into this community.
Repeat Step (2) and (3) until the flow efficiency of the community stops increasing anymore.
Based on the above four primary steps, we could acquire the first ‘typhoon’ community. But it may not be the optimal one. Change the connected node in the Step (1) and repeat Step (1) to (4) to find out all possible typhoon communities. Select the community with the maximum efficiency as the final subnet for typhoon disaster chain.
The result of community division relies on the structure of the disaster complex network and would be altered with the threshold setting of the complex network. provides three different results of the disaster chains of ‘flood’. It shows that the smaller threshold leads to a more complex network and more nodes in the community.
Figure 6. The extracted disaster chains of ‘flood’ from the complex network with three different threshold settings: (a) threshold is 0.001; (b) threshold is 0.01and (c) threshold is 0.03.
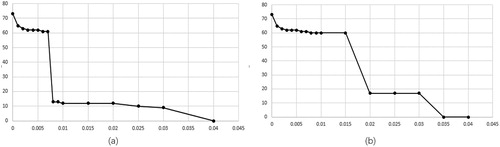
When the threshold is zero, the network cannot be divided and all nodes would be included into the community. When the threshold is too big, the community is too simple and some important connections may be eliminated. We explore the threshold decision rule using ‘flood’ disaster chain and ‘typhoon’ disaster chain based on Baidu Scholar data. shows the relationship between the number of disaster chain nodes and the setting of threshold. Obviously with the increase of the threshold, there are sharp changes in the number of disaster chain nodes. For example, in ‘flood’ disaster chain, when the threshold is between 0 and 0.008, the node number is 61 to 65; when the threshold is set 0.008 to 0.03, the node number is 9 to 13; when the threshold is larger than 0.03, the node number remains 1. In the traditional researches (Wang et al. Citation2016; Liu Citation2013) about disaster chain, the number of disaster chain nodes are always below 20. Therefore, it is reasonable to believe that the threshold which results in a disaster chain with about 10 to 20 nodes is the optimal one.
Figure 7. The relationship between the number of disaster chain nodes and the setting of threshold (a) ‘flood’ disaster chain based on Baidu scholar data and (b) ‘typhoon’ disaster chain based on Baidu scholar data.
5. The result comparison
5.1. Comparison between Google Scholar data and Baidu Scholar data
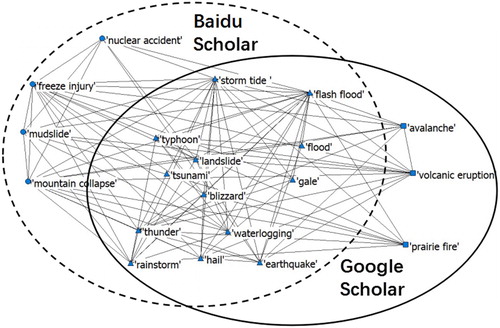
Firstly, the search results of Chinese keywords by Baidu Scholar search engine and the search results of English keywords by Google Scholar search engine are adopted to acquire the final disaster chains, and two chains are compared.
The extracted disaster chain of ‘typhoon’ based on Baidu Scholar massive data consists of 17 disaster types (including ‘typhoon’ itself, the same below. The threshold of constructing the complex network is set as 0.02):
Typhoon, flood, waterlogging, storm tide, gale, landslide, rainstorm, blizzard, flash flood, thunder, hail, earthquake, tsunami, freeze injury, mudslide, mountain collapse, nuclear accident.
The extracted disaster chain of ‘typhoon’ based on Google Scholar massive data consists of 16 disaster types (the threshold is 0.02):
Typhoon, flood, waterlogging, storm tide, gale, landslide, rainstorm, blizzard, flash flood, thunder, hail, earthquake, tsunami, avalanche, volcanic eruption, prairie fire.
The comparison result is illustrated in . We can recognize there are 13 common disaster types closely relating with ‘typhoon’ achieved through both data sources, and the main body of disaster chain is identical with each other. But in these common nodes, the topological relation obtained from two data sources may be different. For example, there is connection between ‘tsunami’ and ‘flash flood’ based on Baidu scholar data, but Google denied this link. Therefore, the topological relation among all common nodes should be judged and the edges should be merged. We define that for two common nodes, if the average of their co-occurrence rates in different data sources is larger than the average of thresholds, a connection edge is created between them. For example, in ‘typhoon’ disaster chain, the threshold for Baidu Scholar and Google Scholar are both 0.02, so the average of thresholds is 0.02 too. In Baidu Scholar, the co-occurrence rate of ‘tsunami’ and ‘flash flood’ is 0.022, and in Google Scholar, the co-occurrence rate is 0.006. The average of co-occurrence rates is 0.014, which is less than the average of thresholds. Therefore, the connection edge between ‘tsunami’ and ‘flash flood’ would be wiped off. On the contrary, in Baidu Scholar, the co-occurrence rate of ‘tsunami’ and ‘storm tide’ is 0.026, and in Google Scholar it is 0.016. The average value is 0.021, which is larger than the average of thresholds. Therefore, the edge between them is reserved.
Figure 8. Comparison between Google Scholar data and Baidu Scholar data.
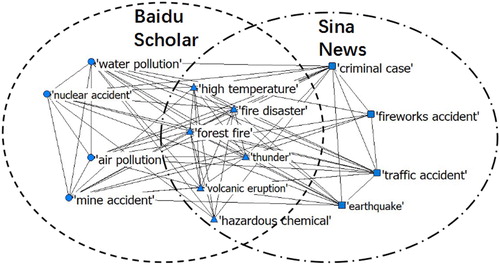
Using the same approach for extracting the disaster chain of ‘fire’, 10 disaster types from Baidu Scholar and 8 disaster types from Google Scholar are come out, including 6 identical disaster types. Thus, it shows the results of two data sources have very high similarity.
Fire, volcanic eruption, forest fire, mine accident, hazardous chemical, air pollution, water pollution, high temperature, nuclear accident and thunder (Baidu Scholar data source, the threshold is 0.02).
Fire, volcanic eruption, forest fire, mine accident, hazardous chemical, air pollution, prairie fire and elevator accident (Google Scholar data source, the threshold is 0.03).
5.2. Comparison between Baidu Scholar data and Sina News data
The same procedures are applied to Sina News (the threshold of constructing the complex network is set as 0.03), and the disaster chain of ‘fire’ and its comparison with Baidu Scholar (the threshold is 0.02) is shown in . Ten disaster types in the chain are found out including: fire, fireworks accident, hazardous chemical, thunder, high temperature, forest fire, earthquake, traffic accident and criminal case. Six identical disaster types are included both in Sina News and Baidu Scholar. Moreover, social hot news such as ‘fireworks accident’ and ‘criminal case’ shows great attention in Sina News massive data, which fits with the features of social Internet news website. Different from scholar data, social news data tends to have a wider coverage, and pays more attention to the influence of human factors and social factors in the development of disasters. Therefore, disasters related to human involved activities appear frequently in disaster chains constructed based on social news data.
Figure 9. Comparison between Baidu Scholar data and Sina News data.
5.3. Comprehensive comparison of three data sources and existing methods
In order to verify the rationality of our method, some discussed disaster chains in existing literature works are used to compare with our results. Typhoon and earthquake take place frequently all over the world. The existing researches about them are relatively mature, and researchers have basically reached a consensus on the composition of their disaster chains. Therefore, the union set of typhoon disaster chain nodes in three references (Wang et al. Citation2016; Shuai, Wei, and Peijun Citation2012; Pan and Tang Citation2002) – called typical chain in this paper – is used to compare our results. The nodes outside of the 73 types of disasters involved in this study have been eliminated. Similar comparison is conducted with the earthquake disaster chain obtained from two references (Yin et al. Citation2012; Cui, Jiming, and Wenping Citation2012).
shows the comparison results of typhoon disaster chains. The thresholds for Baidu, Google and Sina are separately set as 0.02, 0.02, and 0.025. There are 10 common disaster types for all of them, and 6 common disaster types for two of them. The individual disaster types acquired from Sina News have more numbers than Baidu Scholar and Google Scholar, because the focus of news internet website may differ from the focus of scholar web site. also shows an interesting phenomenon. There are 11 common disaster types for three data mining approaches, but comparing with the results from existing literature works, the data mining approaches include two exceptional results of ‘earthquake’ and ‘tsunami’. The exception will be discussed afterwards. Comparison results for the earthquake disaster chain are illustrated in . All nodes in a typical chain are included in the results from three data sources.
Figure 10. Comprehensive comparison of typhoon disaster chains.
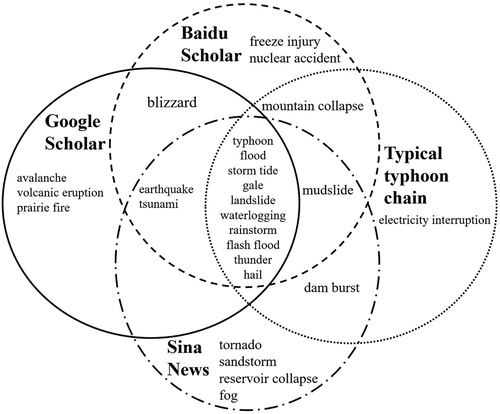
Figure 11. Comprehensive comparison of earthquake disaster chains.
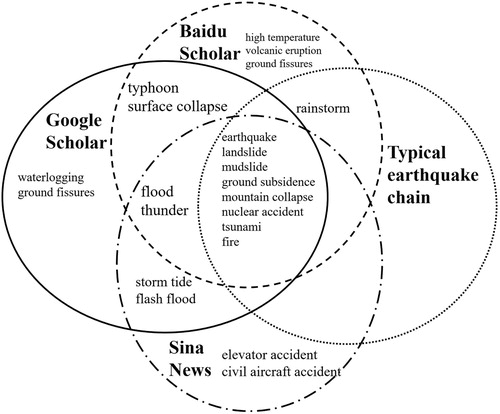
These two experiments give us a satisfactory conclusion that the disaster chains discovered through data mining approach are consistent with the ones through existing methods. Meanwhile, some disaster types which are less concerned in existing researches have also been excavated, such as ‘surface collapse’ and ‘volcanic eruption’ in the earthquake disaster chain. Therefore, the proposed method can be regarded as a useful complement to the existing methods, and may give useful hints to the domain users.
The output of our method is not only these disaster nodes, but also the co-occurrence rate between each disaster-pair, which quantitatively represents the strength of their correlation. For example, in typhoon disaster chain, the co-occurrence rates are respectively 0.044, 0.101 and 0.012 (average value of three data sources) between ‘typhoon’ and ‘flood’, ‘gale’, and ‘sandstorm’. It means that the correlation between typhoon and gale is stronger than the other two. This correlation represents the degree of concern in research areas and social domains. There are two factors which could affect the value of co-occurrence rate. First, there is a practical induced relationship between two disasters, so they get a lot of attention in research and social fields. Second, there are some similarities between two disasters, so they are always mentioned at the same time. For example, people always mention some popular disasters like earthquake and typhoon when they talk about disaster-related topics, even these two disasters are rarely correlated with each other. The research of disaster chain only cares about the first factor. However, filtering the affection of the second factor is out of the scope of this paper, and it is considered as the future work and the last section discusses this issue.
5.4. Comprehensive comparison of three data sources for all 73 disaster types
In this part, we extend our experiments for all 73 disaster types. The comprehensive comparison results of three data sources are visualized in .
Figure 12. Comprehensive comparison of three data sources for all 73 disaster types; for each disaster type, the first column shows the result from Baidu Scholar, the second one from Google Scholar and the third one from Sina News; the vertical axis indicates the number of nodes in disaster chains.
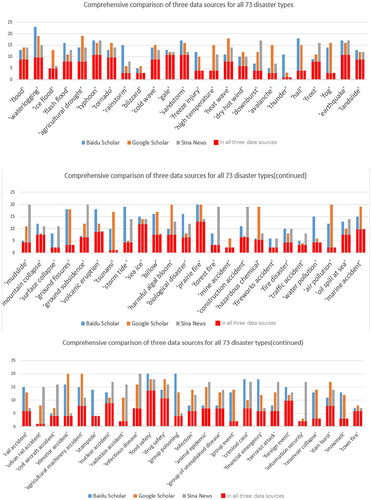
Comparing the results from Baidu and Google, we calculate the ratio between the number of common nodes and the average number of both nodes. There are 59 types of disasters whose ratios are more than 50%, accounting for 80.8% of all 73 disasters. This shows that in most cases, the results obtained from two scholar databases have high similarity. The same process is applied to compare the results of three data sources, and there are 37 types of disasters whose ratios are more than 50%, accounting for 50.7% of all 73 disasters. Due to the difference concern points of news data and scholar data, the number of common nodes among three data sources is less than that between two scholar data sources, but it is pleasing that more than half of 73 disaster types achieve high similarities.
The superiority of our method is well demonstrated by this extensional experiment. Firstly, it discovers the pattern of disaster chain for all disaster types, including the ones that are rarely involved in existing researches. Meanwhile, the extracted disaster chain contains more latent information. For example, in ‘typhoon’ disaster chain, most existing research results only contain less than 11 nodes, but our method could dig out 25 relative disasters, including ‘storm tide’ and ‘tornado’ which are always ignored in existing researches. Secondly, the whole process relies on pure data analysis, which is not limited by priori knowledge. Therefore, it is flexible to reconstruct the required disaster chain quickly according to the practical needs or the update of databases.
6. Discussions and conclusions
This paper presents a novel method of constructing the disaster chain complex network based on the massive data. The strength of correlation between each two disaster types is obtained by means of co-occurrence analysis method, based on huge amounts of scholar and social news datasets, through the Google Scholar, Baidu Scholar and Sina News search engines. This method takes full advantage of the information from scholars and social news media, which can complement existing research results by avoiding experts’ experiences and prior knowledge. It explores a new path in the field of disaster management, and can apply in similar applications and may enlighten other researchers.
Moreover, based on the features of complex network, the community division method is employed to extract specific disaster chain from the constructed complex network. This method can discover the pattern of disaster chain for all disaster types. The extracted disaster chain connects different disaster types and well explicitly show their latent relationships.
By comparing our achieved results with the ones from existing literature works, the known secondary and derived disaster types are mostly contained in our results. By comparing of applying our approach to different data sources, even the search keywords in different languages (English and Chinese), highly similar results are achieved to show its robustness. Certainly, the characteristics of different data sources are reflected in the individual results, like the difference between scholar data and new media data.
However, some steps further can be implemented in future work to improve this research. Although we defined the detailed search mode and gave a clear keywords filtering way, such as considering the singular and plural issue in English, and traditional Chinese and simplified Chinese spelling issue in Chinese, still more semantic issues need to be very careful. Same semantic word may be expressed slightly different, for example, ‘waterlogging’ and ‘water-logging’ are the identical word and may occur in different scholar papers or news. Synonyms may exist for many words, such as ‘mudslide’ and ‘debris flow’, ‘tsunami’ and ‘seaquake’. Different scholar papers or news may adopt either of them to express the same phenomenon. If the above situations are not considered, the search results will be inevitably ignored. Therefore, it is necessary to further study the semantic issues in different linguistic and cultural context (Landauer and Dumais Citation1997).
In this paper, we compared the final disaster chain results from Baidu Scholar, Google Scholar and Sina News, and each result is individually computed through one single search engine. In future, the data integration and fusion work can be carried out to optimize the final results. There may be several approaches to try in this direction. The first way is to integrate the original massive searched data together, and take the three databases as one database to proceed next steps. Certainly, besides the three mentioned data sources, more disaster-related datasets may be obtained through more engines in various search ways. The second way is to investigate the method of fusing the final three disaster chains together as one chain, based on the particular features of each data source.
Last but not least, the experimental result has shown that there are still abnormal samples occurring in the original filtered search results. As mentioned in Section 5, all of the three disaster chains acquired through three data sources demonstrate the high correlation between ‘typhoon’ and ‘earthquake’, ‘tsunami’, even they are hardly causing each other. Because being as the common catastrophes, these three disasters are always mentioned in the scholar articles or news when talking about the disaster issues. This fact also shows that the data filtering work needs to be updated, and it requires more intelligent way to distinguish appropriate articles. Natural language processing methods may be taken into account to develop suitable algorithms for maximally removing the noisy datasets and assure the quality of data, and thus to achieve a better consequence.
Supplementary_Material
Download MS Word (18.6 KB)Disclosure statement
No potential conflict of interest was reported by the authors.
Additional information
Funding
References
- Ahn, Y. Y., J. P. Bagrow, and S. Lehmann. 2010. “Link Communities Reveal Multiscale Complexity in Networks.” Nature 466 (7307): 761–764.
- Cai, Guoray. 2008. “Human–GIS Interaction Issues in Crisis Response.” International Journal of Risk Assessment & Management 6 (4/5/6): 1–17.
- Chen, Xiang, Jing Chen, and Jing Ai Wang. 2007. “Analysis on Typhoon Disaster Chain in Fujian: A Case Study of Typhoon Longwang in 2005.” Journal of Beijing Normal University 43 (2): 203–208.
- Chen, Changkun, Zhi Li, and Yunfeng Sun. 2008. “Study on Characteristics of Disaster Information Transmission Based on Complex Networks.” Journal of Catastrophology 23 (4): 128–131.
- Chen, Quan Liang, L. I. Zhan, Guang Zhou Fan, and Ke Yun Zhu. 2011. “Indications of Stratospheric Anomalies in the Freezing Rain and Snow Disaster in South China, 2008.” SCIENTIA SINICA Terrae 54 (8): 1248–1256.
- China, P. R. 2007. “Emergency Response Law of the People’s Republic of China.” http://www.gov.cn/flfg/2007-08/30/content_732593.htm.
- China Daily. 2011. “China Calls off Alert on Quake Lake.” http://www.chinadaily.com.cn/china/2008-06/11/content_6753597.htm.
- CNN. 2013. “Hurricane Katrina Statistics Fast Facts.” https://edition.cnn.com/2013/08/23/us/hurricane-katrina-statistics-fast-facts/index.html.
- CNN. 2017. “The hidden health dangers of flooding.” https://edition.cnn.com/2017/08/27/health/health-consequences-flood-waters/index.html.
- Cui, Yun, Kong Jiming, and Wu Wenping. 2012. “Cause Characteristics and Prevention /Control Strategies of the Secondary Mountain Disaster Chain of the Wenchuan Earthquake.” Journal of Natural Disasters 21 (01): 109–116.
- Dong, Leilei. 2009. “Modeling Emergency Event Chain Based on Bayesian Networks.” Dalian: Dalian University of Technology.
- Egghe, Leo. 2009. “New Relations Between Similarity Measures for Vectors Based on Vector Norms.” Journal of the Association for Information Science & Technology 60 (2): 232–239.
- Evans, T. S., and R. Lambiotte. 2009. “Line Graphs, Link Partitions, and Overlapping Communities.” Physical Review E Statistical Nonlinear & Soft Matter Physics 80 (2): 016105.
- Fan, Weicheng. 2007. “Advisement and Suggestion to Scientific Problems of Emergency Management for Public Incidents.” Bulletin of National Natural Science Foundation of China 21 (2): 71–76.
- Fan, Jianrong, Bingwei Tian, Gengwei Cheng, Heping Tao, Jianqiang Zhang, Yan Dong, S. U. Fenghuan, and Bintao Liu. 2008. “Investigation on Damming Object Induced by the Earthquake of Wenchuan on May 12 Based on Multi-Platform Remote Sensing.” Journal of Mountain Science 26 (3): 257–262.
- Ford, L. R. Jr., and D. R. Fulkerson. 1956. “Maximal Flow Through a Network.” Canadian Journal of Mathematics 8 (3): 399–404.
- Forward, J. A. P. A. N. 2017. “Remembering the 2011 Earthquake: Life is Fragile – and Therefore Beautiful.” https://japan-forward.com/everyday-life-is-fragile-and-therefore-beautiful/.
- Girvan, M., and M. E. J. Newman. 2001. “Community Structure in Social and Biological Networks.” Proceedings of the National Academy of Sciences of the United States of America 99 (12): 7821–7826.
- Gitis, V. G., E. N. Petrova, and S. A. Pirogov. 1994. “Catastrophe Chains: Hazard Assessment.” Natural Hazards 10 (1–2): 117–121.
- Guo, Lirong. 2017. “Python-based Web Crawler Design.” Electronic Technology & Software Engineering 23: 248–249.
- Ha, Si, Jiquan Zhang, Siqin Tong, and Sijia Li. 2016. “Progress and Prospect of the Research on Disaster Chain.” Journal of Catastrophology 31 (2): 131–138.
- Hallegatte, Stéphane. 2008. “An Adaptive Regional Input-Output Model and its Application to the Assessment of the Economic Cost of Katrina.” Risk Analysis An Official Publication of the Society for Risk Analysis 28 (3): 779–799.
- Han, Y. U., Jingai Wang, Mei Chai, Peijun Shi, and School of Geography, and Beijing Normal University. 2014. “Review on Research Methods of Disaster Loss Accumulation and Amplification of Disaster Chains.” Progress in Geography 33 (11): 1498–1511.
- He, Qin. 1999. “Knowledge Discovery Through Co-word Analysis.” Library Trends 48 (1): 133–159.
- Helbing, Dirk, and Christian Kühnert. 2003. “Assessing Interaction Networks with Applications to Catastrophe Dynamics and Disaster Management.” Physica A: Statistical Mechanics and Its Applications 328 (3–4): 584–606.
- Hu, Yingjie, Xinyue Ye, and Shih Lung Shaw. 2017. “Extracting and Analyzing Semantic Relatedness Between Cities Using News Articles.” International Journal of Geographical Information Science 31 (2): 1–25.
- Kothari, R., and V. Jain. 2002. “Learning from Labeled and Unlabeled Data.” Paper presented at the annual meeting for International Joint Conference on Neural Networks 2002: 2803–2808.
- Kwan, Mei Po, and Jiyeong Lee. 2005. “Emergency Response after 9/11: The Potential of Real-time 3D GIS for Quick Emergency Response in Micro-spatial Environments.” Computers, Environment and Urban Systems 29 (2): 93–113.
- Landauer, T. K., and S. T. Dumais. 1997. “A Solution to Plato’s Problem: The Latent Semantic Analysis Theory of Acquisition, Induction, and Representation of Knowledge.” Psychological Review 104 (2): 211–240.
- Li, Husheng. 2017. “Conceptual View and Main Research Content in the Field of Safety and Emergency Management.” Safety 38 (10): 23–26.
- Li, Jian, and Changkun Chen. 2014. “Modeling the Dynamics of Disaster Evolution Along Causality Networks with Cycle Chains.” Physical A Statistical Mechanics & Its Applications 401 (401): 251–264.
- Li, Mao, Jianguo Chen, Tao Chen, and Hongyong Yuan. 2010. “Probability for Disaster Chains in Emergencies.” Journal of Tsinghua University (Science and Technology) 50 (8): 1173–1177.
- Liang, J. T., C. Tang, and J. Wang. 2012. “Exploration- and Analysis-remote Sensing of Geological Hazards Induced by Earthquakes in Typical Areas of Qingchuan, Sichuan, China.” Journal of Chengdu University of Technology 39 (5): 530–534.
- Lin, Dalong, Liang Ming, Shengfang He, and Zhi Li. 2012. “University Fire Derived Disasters Based on Complex Networks.” Fire Science and Technology 31 (2): 205–206.
- Liu, Yang. 2013. “Research on the Typical Debris Flows Chain Based on RS in Palongzangbu Basin of Tibet.” Master diss., Chengdu University of Technology.
- Liu, Yu, Fahui Wang, Chaogui Kang, Yong Gao, and Yongmei Lu. 2014. “Analyzing Relatedness by Toponym Co-occurrences on Web Pages.” Transactions in GIS 18 (1): 89–107.
- Liu, Aihua, and Chao Wu. 2015. “Research on Risk Assessment Method of Disaster Chain Based on Complex Network.” Systems Engineering –Theory & Practice 35 (2): 466–472.
- Liu, Wenfang, Shengxie Xiao, Yanchun Sui, Jufang Zhou, and Haiwei Gao. 2006. “Analysis of Natural Disaster Chain and Chain-cutting Disaster Mitigation Mode.” Chinese Journal of Rock Mechanics & Engineering 25: 2675–2681.
- Loet. 2008. “On the Normalization and Visualization of Author Co-citation Data: Salton’s Cosine Versus the Jaccard Index.” Journal of the Association for Information Science & Technology 59 (1): 77–85.
- Mccarthy, James D., Phil A. Graniero, and Steven M. Rozic. 2008. “An Integrated GIS-expert System Framework for Live Hazard Monitoring and Detection.” Sensors 8 (2): 830–846.
- Men, Ke Pei. 2007. “Time-space Order of Severe Earthquake Disaster Chain and its Prediction.” Progress in Geophysics 22 (2): 645–651.
- Miller, Frederic P., Agnes F. Vandome, and John Mcbrewster. 2010. Complex Network. Saarbrücken: Alphascript Publishing.
- Palla, Gergely, Imre Derényi, Illés Farkas, and Tamás Vicsek. 2005. “Uncovering the Overlapping Community Structure of Complex Networks in Nature and Society.” Nature 435 (7043): 814–818.
- Pan, A., and X. Tang. 2002. “Preliminary Research Into the Typhoon Disaster Chain in Guangdong Coastal Area.” Journal of Guangzhou University 1 (3): 55–61.
- Sánchez, Cristina Rosales, Massimo Craglia, and Arnold K. Bregt. 2016. “New Data Sources for Social Indicators: The Case Study of Contacting Politicians by Twitter.” International Journal of Digital Earth 10: 1–17.
- Shuai, Jiabing, Xu Wei, and Shi Peijun. 2012. “Characteristic Analysis of Typhoon Disaster Chains in the Yangtze River Delta Region of China.” Journal of Natural Disasters 21 (03): 36–42.
- Tang, Xiaochun. 2008. “Discussion on Disaster Chains of 5.12 Earthquake in Sichuan Province.” Journal of Southwest University for Nationalities 34 (6): 1091–1095.
- Wang, Ran, Lian Fang, Yu Han, Shi Peijun, and Wang Jingai. 2016. “Classification and Regional Features Analysis of Global Typhoon Disaster Chains Based on Hazard-formative Environment.” Geographical Research 35 (5): 836–850.
- Wang, Junjie, Huiying Gao, and Junfeng Xin. 2010. “Application of Artificial Neural Networks and GIS in Urban Earthquake Disaster Mitigation.” The paper is presented for International Conference on Intelligent Computation Technology and Automation. Changsha: IEEE.
- Wang, Jianxiu, Xueying Gu, and Tianrong Huang. 2013. “Using Bayesian Networks in Analyzing Powerful Earthquake Disaster Chains.” Natural Hazards 68 (2): 509–527.
- Wang, Wei, and Kathleen Stewart. 2015. “Spatiotemporal and Semantic Information Extraction from Web News Reports About Natural Hazards.” Computers, Environment and Urban Systems 50: 30–40.
- Wang, Fei, and Hongyong Yuan. 2010. “Challenges of the Sensor Web for Disaster Management.” International Journal of Digital Earth 3 (3): 260–279.
- Wei, Yi Ming, Ying Fan, F. U. Ji liang, and X. U. Wei xuan. 2000. “Neural Network Based Predicative Method for Flood Disaster.” Chinese Journal of Management Science 8 (3): 57–62.
- Xie, Qi, Jing Guan, and Cuo Yang. 2015. “A New Academic Weapon after Google Scholar – Baidu Scholar.” Journal of Library & Information Sciences in Agriculture 27 (6): 110–114.
- Xu, Mengzhen, Zhaoyin Wang, Le Liu Lijian Qi, and Kang Zhang. 2012. “Disaster Chains Initiated by the Wenchuan Earthquake.” Journal of Mountain Science 65 (4): 975–985.
- Xue, Lan, Zongchao Peng, and Qiang Zhang. 2002. “Public Management and China’s Development – Review and Prospect of Public Management Development.” Management World 2: 43–56.
- Yao, Qinglin, and Zuji Qiang. 2006. “Mechanism of Earthquake Disaster Chain and Analysis of Earthquake – Flood Phenomenon.” China’s First Disaster Chain Symposium, 53–58.
- Yin, Weixia, Wang Jing’ai, Yu Han, and Shi Qinqing. 2012. “Study of Earthquake Disaster Chains Based on Disaster System Theory.” Journal of Institute of Disaster Prevention 14 (2): 1–8.
- Yin, Yong, and Kazuhiko Yasuda. 2005. “Similarity Coefficient Methods Applied to the Cell Formation Problem: A Comparative Investigation.” Computers & Industrial Engineering 48 (3): 471–489.
- Yu, Shizhou. 2010. “Probability Analysis of Earthquake Disaster Chain and Chain-cutting Disaster Mitigation Method.” China Civil Engineering Journal 43: 479–483.
- Yu, Han, Jing’ai Wang, Jiu Chai, and Peijun Shi. 2014. “Review on Research Methods of Disaster Loss Accumulation and Amplification of Disaster Chains.” Progress in Geography 33 (11): 1498–1511.
- Zheng, Liang, Fei Wang, Xiaocui Zheng, and Binbin Liu. 2017. “A Distinct Approach for Discovering the Relationship of Disasters Using Big Scholar Datasets.” Paper presented at the 5th annual 2017 international conference on geo-spatial knowledge and intelligence, Chiang Mai, December 8–10.
- Zhou, Hongjian, Xi Wang, Yi Yuan, and Dandan Wang. 2014. “Rapid-assessing Methods of Loss in Extremely Heavy Rainfall Disaster Chain in Semiarid Region – a Case Study on a Flash Flood Debris Flow in Minxian County, Gansu Province.” Arid Zone Research 31 (3): 440–445.