
 ?Mathematical formulae have been encoded as MathML and are displayed in this HTML version using MathJax in order to improve their display. Uncheck the box to turn MathJax off. This feature requires Javascript. Click on a formula to zoom.
ABSTRACT
Social media such as Twitter is increasingly being used as an effective platform to observe human behaviors in disastrous events. However, uneven social media use among different groups of population in different regions could lead to biased consequences and affect disaster resilience. This paper studies the Twitter use during 2017 Hurricane Harvey in 76 counties in Texas and Louisiana. We seek to answer a fundamental question: did social-geographical disparities of Twitter use exist during the three phases of emergency management (preparedness, response, recovery)? We employed a Twitter data mining framework to process the data and calculate two indexes: Ratio and Sentiment. Regression analyses between the Ratio indexes and the social-geographical characteristics of the counties at the three phrases reveal significant social and geographical disparities in Twitter use during Hurricane Harvey. Communities with higher disaster-related Twitter use in Harvey generally were communities having better social and geographical conditions. These results of Twitter use patterns can be used to compare with future similar studies to see whether the Twitter use disparities have increased or decreased. Future research is also needed to examine the effects of Twitter use disparities on disaster resilience and to test whether Twitter use can predict community resilience.
1. Introduction
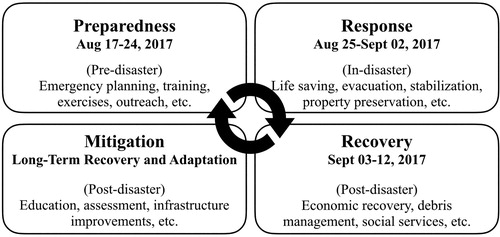
The ability of a community to prepare for, absorb, recover from, and more successfully adapt to disastrous events is one way to define disaster resilience (Lam et al. Citation2016; National Research Council Citation2012). Disaster resilience can be better understood by investigating human behaviors during the four phases of emergency management – preparedness, response, recovery, and mitigation (Federal Emergency Management Agency [FEMA] Citation2006). Given the same level of threat from a hazard, communities with different social and geographical characteristic have shown divergent experiences across emergency phases (Cai et al. Citation2016; Lam et al. Citation2015, Citation2016; Li et al. Citation2015; Mihunov et al. Citation2018; Muttarak and Pothisiri Citation2013; Petkova et al. Citation2018; Thieken et al. Citation2007). However, a major challenge is that data describing communities’ behaviors in different phases of emergency management are difficult to access through traditional databases.
Social media, such as Twitter, provides an innovative approach to observe human behaviors under emergencies in real-time. Previous studies have investigated the utility of social media in emergency management and resilience after major disastrous events (Earle Citation2010; Kent and Capello Citation2013; Tsou Citation2015; Tsou and Leitner Citation2013), such as Hurricane Sandy in 2012 (Guan and Chen Citation2014; Kryvasheyeu et al. Citation2015, Citation2016; Zou et al. Citation2018), Colorado Flood in 2013 (Liu et al. Citation2018), and Hurricane Matthew in 2016 (Li et al. Citation2018; Martín, Li, and Cutter Citation2017). Their results demonstrate that information extracted from social media data could be used to detect affected areas (Assumpção et al. Citation2018), estimate potential damages (Kryvasheyeu et al. Citation2016), monitor evacuation and recovery process (Guan and Chen Citation2014; Martín, Li, and Cutter Citation2017), improve emergency management (Yin et al. Citation2012), and enhance disaster resilience (Dufty Citation2012).
However, these previous studies also show that utilizing social media data alone to derive scientific conclusions remains challenging. First of all, inaccurate or false information on location and user characteristics could invalidate the results. Developing a social media data-mining framework with standardized tools and indexes should help alleviate some of the problems and enable comparative analysis across events and regions (Zou et al. Citation2018). Secondly, social media use is known to vary across demographics groups, with younger, urban dwellers being more inclined to use social media than older, rural population (Li, Goodchild, and Xu Citation2013). This digital divide among disparate groups of population and across different regions could lead to biased conclusions if analysis is not carefully done. In the case of disasters, the social and geographical disparities of social media use could generate uneven respone and affect the long-term resilience of the communities. Thus, analyzing the patterns of social media use and its social and geographical characteristics across the different phases of emergency management is important, and findings from these types of studies should provide useful insights into reducing the disparities, reducing damage, and speeding recovery.
This paper studies Twitter use during the 2017 Hurricane Harvey in 76 counties in Texas and Louisiana. Hurricane Harvey made its first landfall in the United States on 25 August 2017 near Rockport, Texas as a category-4 hurricane. It lingered over the Houston area and produced over 50 inches of rainfall, causing widespread flooding and damages in the region. This unprecedented disastrous event is marked by controversies, especially on the issue of inadequate flood warning due to the unexpected amount of rainfall (Friedman and Schwartz Citation2018). At the same time, a new phenomenon emerged during the Harvey event: many residents in the Houston area resorted to social media to call for rescue from flooded homes when the 911 system was overloaded. This changing use of social media marks Harvey as one of the very first disastrous events in which social media has played an important role in fast-responding and rescue missions in the response phase of emergency management.
In this study, we seek to answer a fundamental question: did social and geographical disparities of Twitter use exist during three phases of emergency management (preparedness, response, recovery)? We hypothesize that communities with better socioeconomic conditions had more disaster-related Twitter use in all three phases of emergency management, implying that they are more likely to access disaster information and get the responses for rescues. We will employ the Twitter data-mining framework for resilience analysis developed in a previous study of Hurricane Sandy to process the data and calculate two indexes: Ratio and Sentiment (Zou et al. Citation2018). Regression analyses between the Ratio indexes and the social and geographical characteristics of affected counties during three phrases of emergency management are conducted to identify the main social and geographical factors affecting Twitter use during the event. These results can be used to compare with future similar studies to evaluate whether Twitter use disparities have increased or decreased over time and whether such disparities may affect the resilience of the communities. Findings from this study will further elucidate potential applications and reveal the challenges of using Twitter in disaster resilience research and emergency management improvement.
2. Literature review
Social media use is rapidly changing and is increasingly infiltrating every sector of the society. Through social media, numerous users can share or exchange information at any time in any place. With the timestamps and geo-tags, every social media user can act as a smart sensor that collects information about their current locations or share feelings of any topics on social media in real-time. Analyzing social media data could provide useful information on understanding human behaviors during an event. Social media is also an effective way to measure public attitudes towards different global themes.
Because of the real-time nature and easy online access of the information, social media data such as Twitter data have increasingly been used to examine a variety of hazardous events and emergency management activities. Zou et al. (Citation2018) provides a summary of the literature on social media use during disasters (Dufty Citation2012; Earle, Bowden, and Guy Citation2012; Kent and Capello Citation2013; Li, Goodchild, and Xu Citation2013; Lindsay Citation2011; Mandel et al. Citation2012; Merchant, Elmer, and Lurie Citation2011; Rizza and Pereira Citation2014; Shelton et al. Citation2014; Tsou Citation2015; Tsou and Leitner Citation2013). For instance, Dufty (Citation2012) suggested that social media could play a significant role in building community resilience through risk reduction, emergency management, and post-hazard recovery. Earle, Bowden, and Guy (Citation2012) demonstrated that Twitter activities could help identify affected areas faster than traditional monitoring methods during earthquakes. Kent and Capello (Citation2013) analyzed the spatial patterns of user-generated contents on several social media platforms during the Horsethief Canyon fire of 2012. Their results show that regions with greater hazard threat levels, more young people, denser population and higher awareness levels produced more valuable disaster-related information on social media platforms. Several studies analyzed Twitter activities during Hurricane Sandy and concluded that monitoring activities on social media can help estimate damage and monitor post-disaster recovery status (Guan and Chen Citation2014; Kryvasheyeu et al. Citation2015, Citation2016; Shelton et al. Citation2014; Wang and Taylor Citation2014; Zou et al. Citation2018).
Most recently, Li et al. (Citation2018) proposed a novel approach of using Twitter data for rapid flood mapping. By integrating Twitter data with stream gauge data and Digital Elevation Model data, their model could generate a reliable flood extend map in near real-time. Martín and others leveraged Twitter data to analyze residential evacuation behaviors during Hurricane Matthew in 2016 (Martín, Li, and Cutter Citation2017). Their research confirms that social media could be used to monitor public awareness and evacuation behavior during emergencies.
Despite the above successful studies, there are significant theoretical as well as technical issues related to the use of social media in emergency management and disaster resilience research. Significant technical issues include how to mine the huge volume of data which often have unrelated or false information, and how to develop efficient computer algorithms to visualize and identify social networks and relationships (Tsou Citation2015). As the amount of data created by social media grows, it is necessary to develop a social media data-mining framework to extract useful information from social media data and enable the comparison of social media activities across events and spaces. In terms of theoretical challenges, a major issue is the social and geographical disparities in social media use. Such disparities could have dire consequences in emergency management and disaster resilience (Li, Goodchild, and Xu Citation2013; Sloan et al. Citation2015). In an attempt to address the above two challenges, Zou et al. (Citation2018) developed a geospatial data-mining framework with standardized indexes for analyzing Twitter use during disasters. The researchers applied the framework to study Hurricane Sandy and found significant social and geographical disparities in Twitter use existed in the event. Although social media use has become more popular nowadays, the digital divide in disaster-related social media use, which may affect the emergency management and disaster resilience building, needs more investigation.
3. Study area and data
3.1. Study area
Hurricane Harvey developed from a tropical wave to the east of the Lesser Antilles in the Caribbean Sea, reaching tropical storm status on 17 August 2017. On August 25 night, Harvey strengthened into a major hurricane at the intensity of Category-4, and made its first landfall near Rockport, Texas, at peak intensity (). On August 26 morning, Harvey made its second landfall on the northeast of Copano Bay, Texas. Afterwards, Harvey had downgraded to a tropical storm as it stalled near the coastline of Texas, dropping unprecedented amounts of rainfall over Houston metropolitan areas. On August 28, it emerged back over the Gulf of Mexico, strengthening slightly before making a third and final landfall in Cameron, Louisiana on August 30. As Harvey drifted inland, it quickly weakened again and became extratropical storm on September 1, before dissipating on 2 September 2017 (Blake and Zelinsky Citation2018).
Figure 1. Track and timeline of Hurricane Harvey.
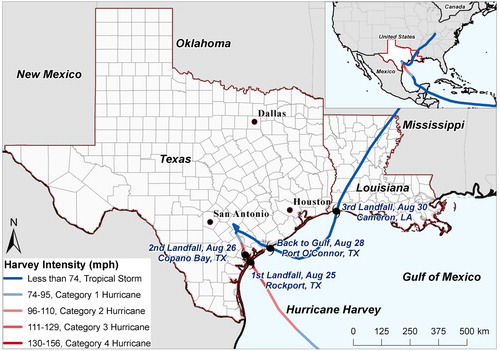
Harvey was the costliest tropical cyclone on record, inflicting approximately $125 billion in damage, primarily from widespread flooding in the Houston metropolitan area (National Oceanic and Atmospheric Administration [NOAA] Citation2018). Many areas received more than 40 inches of rain in less than one week as the system slowly meandered over eastern Texas and adjacent waters, causing catastrophic flooding. With peak accumulations of 60.58 inches, Harvey was the wettest tropical cyclone on record in the United States. The resulting floods inundated hundreds of thousands of homes, displaced more than 30,000 people, and prompted more than 17,000 rescues (Blake and Zelinsky Citation2018).
3.2. Twitter data
This study examines the disaster-related Twitter use during Hurricane Harvey. Twitter is a social media service that allows users to send and receive up to 140-character text messages (Twitter has officially expanded its character count to 280 after November 2017), images, or website links, referred as ‘tweets’, through any online device. As one of the most popular social networking sites, more than 500 million tweets are posted on Twitter every day (based on authors’ estimation), which makes it possible to obtain a large amount of information on human responses during any event. Twitter provides public Application Programming Interfaces (APIs) to help researchers collect data and analyze Twitter activities in near real-time. In addition to the tweet content and timestamps, the locational information of Twitter users could be obtained through different methods, which enables researchers to conduct spatial analysis.
In this research, Twitter data were obtained from Internet Archive (https://archive.org/), an online library which provides 1% (about 5 million tweets per day in 2017) randomly collected tweets from the full Twitter database since 2012 (Zou et al. Citation2018). Each tweet record contains information including the time when the tweet was created, tweet content, coordinates or places attached to the tweet, and information in the user profiles such as users’ descriptions, addresses, account history, and follower/following statuses. We downloaded the Twitter data from 17 August to 12 September 2017 from this library. Five attributes derived from the Twitter data were used in this study: time when the tweet was created, text content, coordinates, place, and address in the user profile. Time of tweets was used to tabulate the Twitter data into the three stages of the emergency management cycle (preparedness, response, and recovery). Text contents were used for classification and sentiment estimation, while the latter three geographic elements were used to determine the location of each tweet. Twitter data during Hurricane Sandy (23 October – 12 November 2012) were also accessed from Internet Archive so that we could compare the disaster-related Twitter uses between the two hurricane events.
3.3. Geographical and social data
In addition to Twitter data, we collected 17 social-geographical variables (). Two hazard variables, including rainfall threat and wind threat, were derived from the rainfall observations (A) and hurricane track data (D) from the National Hurricane Center under NOAA (NOAA Citation2018). There are 3,085 rainfall observation stations in Texas and Louisiana, each recording daily rainfall depth from 25 August to 4 September 2017. Empirical Bayesian Kriging (EBK) interpolation in ArcGIS 10.6 was used to generate a continuous surface of rainfall depth in Texas and Louisiana based on the cumulative rainfall depth during that period (Zou et al. Citation2015; B). The neighborhood searching number in EBK was defined as 12 neighboring observations with a grid size of 30m*30m. Rainfall threat in each county was computed as the averaged interpolated rainfall depth of all grids within a county (C). Wind threat in a county was calculated as the averaged kernel density based on the location of the hurricane track and its wind speed using ArcGIS 10.6 (E&F). The grid size was the same (30m*30m), with a bandwidth of 500 km, which is the largest extent of Hurricane Harvey (NOAA Citation2018).
Figure 2. (A) Rainfall observations during Hurricane Harvey in Texas and Louisiana; (B) interpolated rainfall depth by Empirical Bayesian Kriging; (C) rainfall threat, averaged county-level rainfall depth; (D) track and wind speed of Hurricane Harvey; (E) kernel density surface by hurricane track and wind speed; (F) wind threat, county-level averaged kernel density.
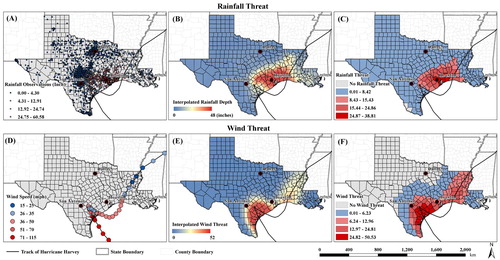
Table 1. List of geographical and social variables.
Four geographical variables, including mean elevation, impervious rate, water rate, and percent urban by county were obtained from Mihunov et al. (Citation2018), who processed and tabulated the original data from the U.S. Geological Survey into county-level estimates. A total of 11 socioeconomic variables () collected for the year 2016 (before Hurricane Harvey) were accessed from the U.S. Census (see https://www.census.gov/). The selection of these variables was based on three reasons. First, the same set of ten socioeconomic variables (except population density) and wind threat in Zou et al. (Citation2018) were selected, since these eleven variables were found significant in indicating the resilience of communities and the results could be compared to previous studies. Second, we added population density, elevation, impervious surface rate, and percent urban to this study because they were found important in representing disaster resilience in previous studies (Cai et al. Citation2018; Mihunov et al. Citation2018; Reams, Lam, and Baker Citation2012; Zhao et al. Citation2018). Third, the rainfall threat was included because of the disastrous flooding caused by tremendous rainfalls during Hurricane Harvey. These 17 selected variables, together representing the social and geographical environments of the community, can be used to test the hypotheses that digital divide in disaster-related twitter use existed during the three phases of emergency management.
4. Methods
4.1. Twitter data mining
We followed the Twitter data-mining framework developed in Zou et al. (Citation2018) for studying Hurricane Sandy and modified slightly for this study (). First, we used 10% randomly selected tweets during the collection period as the background tweets. Similar to the Hurricane Sandy study, the unfiltered Harvey-related tweets were extracted based on four keywords: hurricane, Harvey, flood, and storm. These four keywords have been suggested by other studies as an effective set of words to capture disaster-related tweets during hurricanes while avoiding too much unrelated information before and after events (Kryvasheyeu et al. Citation2015; Shelton et al. Citation2014). Any tweet containing one of the four keywords during the four weeks (17 August to 12 September 2017) was identified as an unfiltered Harvey-related tweet.
Figure 3. Twitter data mining framework (modified from Zou et al. Citation2018).
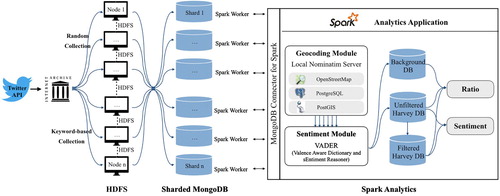
The data collection is implemented in a Hadoop Distributed File System (HDFS) with eight nodes. All selected background and unfiltered Harvey-related tweets were stored in a sharded MongoDB database (see https://www.mongodb.com/), which is well suited for social media data management due to its fast speed in data transmission (Walther and Kaisser Citation2013). Each Node, running MongoDB, is part of the Spark cluster and considered a spark worker. MongoDB connector for Spark maintains the connection between Spark environment and MongoDB. Machine learning applications and further analysis are being scheduled and distributed via Apache Spark and Yarn scheduler. Compared to the Twitter data mining framework in Zou et al. (Citation2018), the framework used in this analysis with HDFS, Apache Spark, and local geocoding server is more suitable for data collection and processing of large-size dataset.
The second step was to determine the location associated with each tweet, which could be realized by three approaches: geo-tags embedded in tweets, addresses in user profiles, or locational information in the tweet contents. Only the first two methods were used in this study. Twitter data with geo-tags contain either a pair of latitude-longitude coordinates or a Twitter suggested place name. For cases without geo-tags, the addresses in the user profiles were used to represent their associated locations. We updated the geocoding module developed in Zou et al. (Citation2018) () to accomplish the transformation of Twitter suggested place names or user addresses into pairs of coordinates. The geocoding module was based on a local Nominatim server, which uses OpenStreetMap planet data (https://planet.openstreetmap.org/, accessed in November 2017) as its data source and is managed by PostgreSQL and PostGIS databases. Compared with other commercial geocoding services, such as Google or ArcGIS geocoding APIs which have strict rate limits for free use by public users, the local Nominatim server provides unlimited geocoding services without rate restrictions, which makes it possible to handle large number of geocoding requests in a short time period (Singh Citation2017).
The third step was sentiment analysis. Sentiment analysis is the process to assign a sentiment score or category to each record based on its tweet content. The Sentiment module in this study utilizes the Valence Aware Dictionary and sEntiment Reasoner (VADER), a lexicon and rule-based python package for sentiment scoring, to evaluate the emotion status of each tweet (Hutto and Gilbert Citation2014). VADER assigns a sentiment score ranging from −1 (most negative) to 1 (most positive) to each input text message. Previous studies have successfully applied the VADER sentiment module to evaluate sentiment scores of Hurricane Sandy tweets (Zou et al. Citation2018), poll public attitude towards breast cancer screening (Wong et al. Citation2016) and predict election results from Twitter (Ramteke et al. Citation2016). After each selected tweet was geocoded and assigned a sentiment score, it was imported into the background and unfiltered Harvey databases, respectively.
The fourth step was filtration. Hurricane Irma was formed and named on 30 August 2017 when Hurricane Harvey was still devastating the Gulf of Mexico and made its third landfall on coastal Louisiana. The issue of collecting Irma-related tweets to Harvey database arises when users tweeted about Hurricane Irma after August 30 using one of the same keywords: hurricane, storm, or flood. We used an ‘Irma’ filter to exclude those cases. If one tweet mentioned ‘Irma’ but did not mention ‘Harvey’, then this tweet is identified as not related to Hurricane Harvey. Tweets not excluded by the ‘Irma’ filter in the unfiltered Harvey database were stored in the filtered Harvey database.
Fifth, we calculated two Twitter indexes, Ratio and Sentiment, from the Background and the two Harvey databases. Ratio index is the number of disaster-related tweets divided by the number of background tweets (Equationequation 1(1)
(1) ), while Sentiment index is the averaged sentiment scores (Equationequation 2
(2)
(2) ). Both indexes can be tabulated into different spatial and temporal scales. Previous studies have demonstrated the uses of Ratio index in damage estimation (Zou et al. Citation2018), flood mapping (Li et al. Citation2018), and assessing citizen awareness on climate change (Kirilenko and Stepchenkova Citation2014, Citation2015), while Sentiment index has been applied to survey public mood and attitudes towards critical global themes (Bollen, Mao, and Zeng Citation2011; Cody et al. Citation2015) and emergency management (Kryvasheyeu et al. Citation2016; Zou et al. Citation2018).
(1)
(1)
(2)
(2)
4.2. Data analysis
Twitter indexes (Ratio and Sentiment) were derived at multiple spatiotemporal scales. First, Ratio and Sentiment indexes for both Hurricanes Harvey and Sandy were calculated hourly and daily at the U.S. national scale to provide and compare the general trends of public awareness and sentiment toward these two events. To distinguish the spatial patterns of public awareness to Hurricane Harvey from Hurricane Irma, two U.S. county-level maps of Ratio index for the whole period were created using the unfiltered and filtered Harvey dataset, respectively.
Second, county-level Ratio indexes were tabulated into preparedness, response, and recovery phases in the severely affected counties in the states of Texas and Louisiana. If a county has very few background tweets, the small number problem might occur when computing the Ratio indexes. Therefore, as in Zou et al. (Citation2018), we used a threshold of 50 background tweets to select counties with active Twitter use and 126 out of 191 counties were selected for more detailed analysis of Hurricane Sandy. Also, only counties that suffered rainfall and wind threats during Harvey were included in the analysis. A total of 76 counties in the two states were selected for Hurricane Harvey analysis based on these above criteria.
Ratio indexes for each selected county were tabulated into preparedness, response, and recovery phases according to FEMA’s emergency management framework (). By tabulating Twitter activities into the three phases, we can better understand the factors affecting disaster-related Twitter use in different phases. We defined a week before the landfall of Harvey as the preparedness phase (17–24 August), nine days during the landfall as the response phase (25 August – 02 September), and ten days after as the recovery phase (3–12 September; ). Since mitigation is a long-term recovery and adaptation process, information extracted from the post-disaster Twitter dataset (10 days after the event) may not be sufficient to provide a complete picture on mitigation. Therefore, this study only considered the first three phases of emergency management for subsequent analysis. Similarly, the preparedness, response, and recovery phases for Hurricane Sandy were defined as 23–28 October, 29–31 October, and 1–12 November 2012, according to Zou et al. (Citation2018). Summary statistics of Ratio and Sentiment indexes in different phases during Harvey and Sandy at the regional level were computed and compared.
Figure 4. The four phases of emergency management.
Third, to test whether geographical and social disparities in disaster-related Twitter use existed across different phases in severely affected counties, we first computed the Pearson correlations between the Ratio index at different phases and the 17 geographical-social variables (). Then, we conducted stepwise linear regressions to identify the geographical and social variables that are significant in affecting the Ratio index. Four models were derived for the preparedness, response, and recovery phases, and for the entire period.
5. Results and discussion
The Twitter data collected for this study are summarized in . During the study period (17 August–12 September 2017), a total of 458,290 out of 125 million (0.37%) tweets were collected into the unfiltered Harvey database. Among them, 268,464 (58.6%) tweets were successfully geocoded to a location (this number included 6,618 or 1.4% of tweets that had geo-tags). After the ‘Irma’ filtration, 385,213 tweets out of 125 million background tweets (0.31%) were collected into the filtered Harvey database. Among them, 218,694 (56.8%) tweets were successfully geocoded to a location based on users’ addresses or attached places, while 5,633 (1.5%) tweets had geo-tags with coordinates. Meanwhile, 12,533,794 (10% of the total tweets) background tweets were randomly selected from the data library, and 4,077,447 (32.5%) of them were successfully geocoded or had geo-tags and used as a base layer to normalize the Harvey-related tweets. Because the selected background tweets are one tenth of the whole database, all calculated Ratio indexes were divided by ten to derive the true Ratio indexes. Results from the three analyses are summarized as follows.
Table 2. Twitter data collected from internet archive (17 August-12 September 2017).
5.1. The spatial-temporal patterns of the U.S.
depicts the temporal variations of Ratio and Sentiment indexes in the United States, which reflects the general trend of public awareness and sentiment towards Hurricanes Harvey (A) and Sandy (B) through time. The Ratio and Sentiment indexes using the filtered Harvey dataset were aggregated hourly and daily and represented as blue and red lines, respectively. The dashed black line represents the daily Ratio indexes using the unfiltered Harvey dataset. Compared to the unfiltered Harvey-related dataset, the filtered Harvey dataset shows significantly lower Ratio values after Hurricane Irma was formed, especially after 2 September 2017 when Harvey dissipated. This phenomenon is quite unique, as we seldom experienced two hurricanes hitting the U.S. within a short time span. It shows that keyword-based collection alone may collect a large amount of information not targeted to the specific event. Through a combination of keyword-based and rule-based collection, such as the ‘Irma’ filter in this case, we can effectively remove Irma-related tweets into the filtered Harvey database.
Figure 5. Temporal trends of hourly and daily Ratio and Sentiment indexes in the U.S. during (A) Hurricane Harvey in 2017 and (B) Hurricane Sandy in 2012.
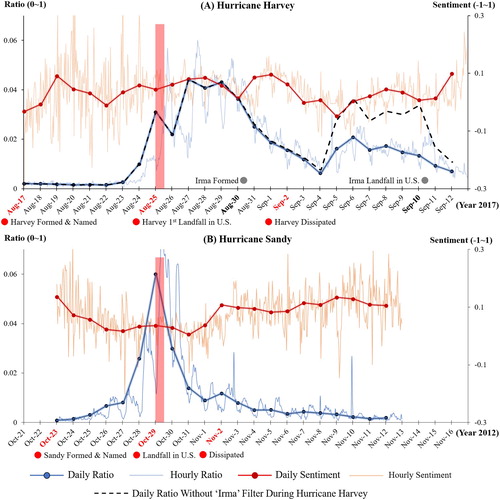
lists the summary statistics of Ratio and Sentiment indexes during Harvey. We also list both indexes for Sandy to provide a context for comparison. For the Harvey event, the daily Ratio indexes ranged from 0.002 to 0.044, with an average value of 0.016. The highest hourly Ratio index value was at 1:00 pm. on 27 August 2017 when the rainfall was heaviest, whereas the highest daily Ratio index value were during 27–29 August 2017 when the Houston metropolitan area suffered extensive flooding due to the heavy rainfall. These Ratios were very similar to that of Sandy (0.001 to 0.059, with an average of 0.010), suggesting that the degree of awareness in United States between the two hurricanes is very similar despite a five-year difference in time between the two events.
Table 3. Summary statistics of daily Ratio and Sentiment indexes at the national level during Harvey and Sandy.
The Sentiment scores tabulated for the entire period at the national level between the two events differ slightly. For Harvey, the Sentiment scores ranged from −0.05 to 0.098 with a mean of 0.036, compared with a range of 0.005 to 0.229 and a mean of 0.088 for Sandy (). In general, Harvey has a narrower range and a more negative sentiment than Sandy. shows that there is no distinct pattern of Sentiment scores for Harvey at the national level, whereas for Sandy, a gentle dip in the Sentiment scores in the response phrase is observed.
To exemplify how people utilized Twitter during disasters and how tweets associated with the Sentiment scores, the top five saddest and happiest filtered Harvey-related tweets by Sentiment scores during the four weeks are listed in . The lowest and highest Sentiment scores of all tweets were −0.9482 and 0.9413, respectively. Two of the saddest Harvey-related tweets connected Hurricane Harvey with other tragic events around the world, one was worrying about the robbery caused by Hurricane Harvey, and the other two were simply depressed about this event. On the contrary, most of the happiest tweets were praying for or expressing their supports to people suffered from Hurricane Harvey.
Table 4. The top 5 happiest and saddest filtered Harvey-related Tweets by Sentiment scores.
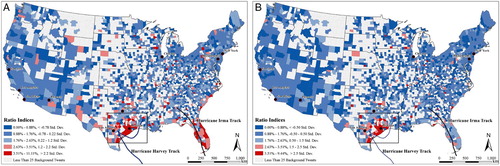
The spatial patterns of county-level Ratio indexes in the United States during the entire period are displayed in . A total of 1,877 counties with more than 25 background tweets were selected for the mapping to avoid the small number problem. Two maps were generated using the unfiltered and filtered Harvey datasets, both of which show very distinct patterns. The Ratio map using the unfiltered Harvey database shows two clusters of high Ratio values, one in coastal Texas and the other in Florida (A), whereas the Ratio map using the filtered Harvey dataset shows that most of counties with high Ratio values were concentrated along the Texas coastline, including the metropolitan areas of Corpus Christi, Houston, and San Antonio, and no cluster of high Ratio values were found in Florida (B). This is expected since many users in Florida had started to discuss Hurricane Irma during the overlapping period.
Figure 6. Comparison of county-level ratio indexes of Hurricane Harvey in the United States: (A) unfiltered Harvey dataset (B) filtered Harvey dataset.
5.2. The spatial-temporal patterns in coastal Texas and Louisiana
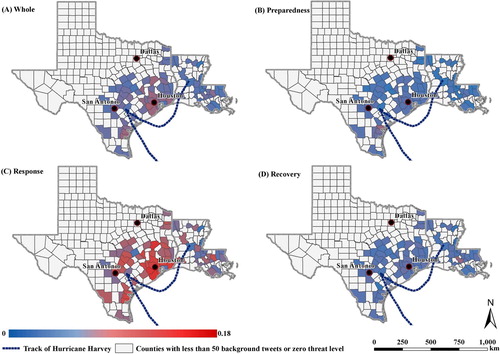
Zooming into the severely affected area and tabulating the tweets into three phases reveals more information on how public awareness changed through the three phases. As mentioned above, a total of 76 counties in Texas and Louisiana were selected for the regional analysis because they had more than 50 background tweets and encountered threats from both wind and rainfall from Harvey. maps the spatial patterns of the Ratio indexes for the whole period and at the three phases using data of the 76 counties. These maps clearly show that higher Twitter use were concentrated in the Houston metropolitan area, with the highest Twitter activities occurring in the response phrase.
Figure 7. County-level ratio indexes for the entire period and at different phases of emergency management in affected areas.
lists the summary statistics of Ratio and Sentiment indexes in different phases during Harvey. The mean indexes of the 126 counties affected by Sandy are also included to enable comparison (Zou et al. Citation2018). provides a better visualization of by plotting the mean values of the two indexes in the three phases for the two hurricanes. The results show that Twitter use patterns in the three phrases were very similar between the two hurricanes, with Harvey on average having a slightly higher Ratio than Sandy (0.0265 vs. 0.0185). Twitter use was the highest in the response phase, whereas the lowest Twitter use (i.e. Ratio index) was found in the preparedness phase for both hurricanes.
Figure 8. Comparison of the mean county-level Twitter indexes in the affected areas during Hurricanes Harvey and Sandy: (A) Ratio, (B) Sentiment.
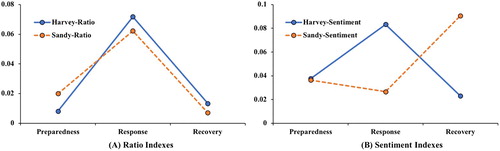
Table 5. Summary statistics of Ratio and Sentiment indexes in different phases during Harvey, tabulated at the regional level.
However, there is a marked difference in the Sentiment scores between Harvey and Sandy (B). For Harvey, the highest Sentiment scores were in the response phrase and the lowest Sentiment scores were in the recovery phase. For Sandy, the pattern was reversed, with the highest and the lowest Ratio indexes being in the recovery and response phases, respectively (Zou et al. Citation2018). This contrast could be explained by the following three reasons. First, there was insufficient flood warning for Harvey because of the unexpected amount of rainfall. Residents in the impacted areas were underprepared for this event. During the response phrase, more Twitter users started to share disaster-related information, ask for help, or help victims in the rescue operation. Since more tweets were used to convey disaster information and they generally had fewer emotional words, this could lead to higher Sentiment scores during the response phase. However, in the recovery phrase, the catastrophic flooding caused by Hurricane Harvey had a lingering effect. The flood water hindered residents’ daily lives and reminded them of the damage caused by Harvey, their tweets were more likely to be negative and emotional, thus leading to a lower Sentiment score. Third, Hurricane Irma was formed and made its landfall in the U.S. during the recovery phase of Hurricane Harvey, which could make many users to connect these two events together. All three reasons could result in higher Sentiment scores in the response phase and lower Sentiment scores in the recovery phase for Harvey.
5.3. Social and geographical disparities
Pearson correlations and stepwise linear regression analyses between Ratio indexes and the 17 social-geographical variables at the three phases and for the entire period were conducted to test the main hypothesis that communities with better socioeconomic conditions had more disaster-related Twitter use in all three phases of emergency management. This analysis resulted in four regression models with R2 of 0.42, 0.40, 0.48, and 0.16 for the whole, preparedness, response, and recovery phases, respectively (). The standardized regression coefficients listed in each model can be used to evaluate the relative importance of the selected variables on the Ratio indexes. The model for the whole period provides a general view of the relationships between disaster-related Twitter use and social-geographical conditions. Rainfall threat, wind threat, household income, and percentage of young population between 17 and 29 years were found to be positively correlated with the Ratio index ().
Table 6. Stepwise regression models (p-value < 0.05) between Ratio indexes and the 17 variables.
An examination of the three models for the different phases further reveal how social-geographical conditions affect disaster-related Twitter use during the cycle of emergency management. In the preparedness phase (the second model), Ratio index was positively associated with wind threat while negatively associated with percentage of households without a vehicle and median age. In the response phase (the third model), the social-geographical disparities were most significant, and the model yielded the highest R2 of all models (0.48). In this model, rainfall threat, instead of wind threat, was selected as a positive indicator, while percentages of mobile homes, female-headed households, and households without telephone services were negatively associated with disaster-related Twitter use. In the recovery phase, neither rainfall threat nor wind threat were selected in the model, and only household income (positively associated) and elevation (negatively associated) were selected, though this last model yielded the lowest R2 (0.16). All four models support the hypothesis that communities with better social-geographical conditions had higher Twitter use.
Two additional observations are made here. First, the changing hazard threats through the three phases during Harvey have been adequately reflected by the Twitter use, which also reflects residents’ perception of risks. In the preparedness phase, residents’ perceptions of disaster risk were based on hurricane forecasts with projected hurricane track information. Therefore, as residents along the hurricane track are more aware of the risks, they are more likely to tweet. As a result, the wind threat variable was selected in this phase. In the response phase, communities with high rainfall threat were at high risk of intensive flooding that residents payed more attention to hazard information, asked for help, or helped others on Twitter. All these reasons led to increased Twitter use, and the rainfall threat variable was selected. In the recovery phase, neither wind threat nor rainfall threat were significant in affecting disaster-related Twitter use. The Pearson correlations () further illustrate the changing perception of residents on disaster risk, with the highest correlations between Ratio index and wind and rainfall threats occurred in the preparedness and response phases.
Table 7. Pearson correlations between Ratio indexes and the 17 variables.
From a socioeconomic perspective, percentages of households without a vehicle, mobile homes, female-headed households, and households without telephone services are common indicators of low socioeconomic conditions, while average household income and percentage of young population are considered positive indicators of community resilience. The relationships found in all four models and the correlation analysis show positive and significant correlations between socioeconomic conditions and disaster-related Twitter use in all phases and the entire period (). Variables positively correlated with the Ratio indexes were positive indicators of disaster resilience (Education, HIncome, PctUrban, EmployR, PctYoung, Impervious, and PopulationDensity). Negative indicators of disaster resilience, including MedAge, FemaleH, MobileH, NoPhone, Poverty, NoVehicle, and Elevation, were negatively associated with the Ratio indexes. A total of nine socioeconomic factors were found to correlate significantly with Ratio indexes in the response phase, while only four and three were significantly associated with Ratio indexes in the preparedness and recovery phases, respectively. The top three most significant socioeconomic variables were averaged household income, percent of households without a vehicle, and percentage of employment. These communities with higher economic vitality have better accessibility to transportation tools; they are likely to have better access to disaster-related information through Twitter during Harvey, which may help them better respond to and recover from disasters.
These regression and correlation results demonstrate that the digital divide in disaster-related Twitter use existed during Hurricane Harvey. Communities with better socioeconomic conditions had higher disaster-related Twitter use in all three phases of emergency management during Hurricane Harvey. These results are consistent with previous studies of Hurricane Sandy and Horsethief Canyon fire in 2012 (Kent and Capello Citation2013; Zou et al. Citation2018). Although social media has become more ubiquitous in 2017, the digital divide in social media use during disasters still existed in Harvey.
5.4. Limitations and future research
There are some limitations of this study, which necessitate future research. First, the keyword/rule-based method to extract Harvey-related tweets could be improved by including a set of location keywords to identify if a tweet is related to Harvey or Irma. For example, tweets mentioning ‘Houston’ or ‘Texas’ are more likely to be associated with Harvey, while tweets containing ‘Florida’ or ‘Miami’ are related to Irma and should be excluded from the filtered Harvey database.
Second, the social and geographical analysis indicates that the selected 17 geographical and social factors cannot fully explain the disaster-related Twitter activities. Other factors, such as damage caused by disasters, recovery status, and hazard experiences, may also affect disaster-related Twitter activities and could be considered in future research.
Third, we conducted a preliminary correlation analysis between sentiment indexes and socioeconomic variables, but no clear correlation was detected. Previous studies indicate that damage may impact public sentiment towards disasters (Kryvasheyeu et al. Citation2016; Zou et al. Citation2018). How public sentiment towards Hurricane Harvey is associated with different topics as well as local socioeconomic conditions is unknown. More future investigations on the relationships among sentiment indexes, social-geographical factors, and popular Twitter topics at different emergency phases could be conducted. Twitter data could be categorized as different disaster-related usage types, such as sharing hazard status, comments of disaster impacts, rescue-related information, and communications. The results may lead to new research findings on how social-geographical disparities affect public emotions and concerns during disasters.
Fourth, the Twitter data mining framework could be improved by collecting real-time data using Twitter streaming API and the Spark Streaming extension. The data used in this study were accessed and analyzed after Hurricane Harvey. In future events, however, it is necessary to collect and process social media data in real-time to enable monitoring as well as applications of social media activities during disasters to enhance emergency management.
Finally, although this study reveals the social and geographical disparities in disaster-related Twitter use during Hurricane Harvey, how such digital divide affects the long-term disaster resilience of different communities and how to reduce such digital divide so that hazard victims could easily access disaster- or rescue-related information are important questions for future research to address.
6. Conclusion
This study analyzed the Twitter activities during Hurricane Harvey from 17 August to 12 September 2017. The study sought to answer a fundamental question: did social and geographical disparities of Twitter use exist during the three phases of emergency management (preparedness, response, recovery). The study employed a Twitter data-mining framework modified from a previous Hurricane Sandy study and computed two indexes: Ratio and Sentiment. Regression analyses between the Ratio indexes and the social-geographical variables confirm our hypothesis and reveals significant social and geographical disparities in Twitter use, with the highest R2 (0.48) found in the response phase. Communities with higher disaster-related Twitter use generally were communities of better social-geographical conditions. Compared with Hurricane Sandy, the sentiment in Harvey was tied to the prolonged flooding effect, with the lowest sentiment scores occurring in the recovery phase instead of the response phase.
There are important implications of the framework and research findings. First, this study improved the utility of the previously developed Twitter data mining framework. The updated framework is more efficient for fast data collection and processing of large amounts of Twitter dataset than the framework in Zou et al. (Citation2018). Second, the computed Twitter indexes provide useful baseline information on Twitter activity in Hurricane Harvey, which can be used to compare with similar disaster events across space and through time. Third, the social and geographical disparities in Twitter use found in this study imply that communities with better socioeconomic conditions are more likely to have access to hazard information and receive rescue responses during emergencies. This digital divide of Twitter use could further deepen the divide in recovery and resilience among communities. Future research is needed to examine the effects of Twitter use and its disparities on the disaster resilience of communities, and to test whether Twitter use can serve as an indicator for predicting the resilience of different communities.
Disclosure statement
No potential conflict of interest was reported by the authors.
ORCID
Lei Zou http://orcid.org/0000-0001-6206-3558
Nina S. N. Lam http://orcid.org/0000-0002-5344-9368
Heng Cai http://orcid.org/0000-0001-6068-5150
Michelle A. Meyer http://orcid.org/0000-0002-8750-8178
Margaret A. Reams http://orcid.org/0000-0002-5636-0318
Additional information
Funding
References
- Assumpção, T. H., I. Popescu, A. Jonoski, and D. P. Solomatine. 2018. “Citizen Observations Contributing to Flood Modelling: Opportunities and Challenges.” Hydrology and Earth System Sciences 22 (2): 1473–1489. doi:10.5194/hess-22-1473-2018.
- Blake, Eric S., and David A. Zelinsky. 2018. Hurricane Harvey. AL092017. National Hurricane Center Tropical Cyclone Report. National Hurricane Center. https://www.nhc.noaa.gov/data/tcr/AL092017_Harvey.pdf.
- Bollen, Johan, Huina Mao, and Xiaojun Zeng. 2011. “Twitter Mood Predicts the Stock Market.” Journal of Computational Science 2 (1): 1–8. doi:10.1016/j.jocs.2010.12.007.
- Cai, Heng, Nina S. N. Lam, Lei Zou, and Yi Qiang. 2018. “Modeling the Dynamics of Community Resilience to Coastal Hazards Using a Bayesian Network.” Annals of the American Association of Geographers 108 (5): 1260–1279. doi:10.1080/24694452.2017.1421896.
- Cai, Heng, Nina S.-N. Lam, Lei Zou, Yi Qiang, and Kenan Li. 2016. “Assessing Community Resilience to Coastal Hazards in the Lower Mississippi River Basin.” Water 8 (2): 46. doi:10.3390/w8020046.
- Cody, Emily M., Andrew J. Reagan, Lewis Mitchell, Peter Sheridan Dodds, and Christopher M. Danforth. 2015. “Climate Change Sentiment on Twitter: An Unsolicited Public Opinion Poll.” PLOS ONE 10 (8): e0136092. doi:10.1371/journal.pone.0136092.
- Dufty, Neil. 2012. “Using Social Media to Build Community Disaster Resilience.” Australian Journal of Emergency Management, The 27 (1): 40.
- Earle, Paul. 2010. “Earthquake Twitter.” Nature Geoscience 3 (April): 221–222. doi:10.1038/ngeo832.
- Earle, Paul S., Daniel C. Bowden, and Michelle Guy. 2012. “Twitter Earthquake Detection: Earthquake Monitoring in a Social World.” Annals of Geophysics 54 (6), doi:10.4401/ag-5364.
- FEMA (Federal Emergency Mnaagment Agency). 2006. Principles of Emergency Management: Independent Study Manual. https://www.hsdl.org/?abstract&did=485174.
- Friedman, Lisa, and John Schwartz. 2018. “How Hurricane Harvey Became So Destructive.” The New York Times, January 20, sec. Climate. https://www.nytimes.com/2017/08/28/climate/how-hurricane-harvey-became-so-destructive.html.
- Guan, Xiangyang, and Cynthia Chen. 2014. “Using Social Media Data to Understand and Assess Disasters.” Natural Hazards 74 (2): 837–850. doi:10.1007/s11069-014-1217-1.
- Hutto, C. J., and Eric Gilbert. 2014. “VADER: A Parsimonious Rule-Based Model for Sentiment Analysis of Social Media Text." 10
- Kent, Joshua D., and Henry T. Jr Capello. 2013. “Spatial Patterns and Demographic Indicators of Effective Social Media Content During TheHorsethief Canyon Fire of 2012.” Cartography and Geographic Information Science 40 (2): 78–89. doi:10.1080/15230406.2013.776727.
- Kirilenko, Andrei P., Tatiana Molodtsova, and Svetlana O. Stepchenkova. 2015. “People as Sensors: Mass Media and Local Temperature Influence Climate Change Discussion on Twitter.” Global Environmental Change 30 (January): 92–100. doi:10.1016/j.gloenvcha.2014.11.003.
- Kirilenko, Andrei P., and Svetlana O. Stepchenkova. 2014. “Public Microblogging on Climate Change: One Year of Twitter Worldwide.” Global Environmental Change 26 (May): 171–182. doi:10.1016/j.gloenvcha.2014.02.008.
- Kryvasheyeu, Yury, Haohui Chen, Esteban Moro, Pascal Van Hentenryck, and Manuel Cebrian. 2015. “Performance of Social Network Sensors During Hurricane Sandy.” PLOS ONE 10 (2): e0117288. doi:10.1371/journal.pone.0117288.
- Kryvasheyeu, Yury, Haohui Chen, Nick Obradovich, Esteban Moro, Pascal Van Hentenryck, James Fowler, and Manuel Cebrian. 2016. “Rapid Assessment of Disaster Damage Using Social Media Activity.” Science Advances 2 (3): e1500779. doi:10.1126/sciadv.1500779.
- Lam, Nina S.-N., Yi Qiang, Helbert Arenas, Patricia Brito, and Kam-biu Liu. 2015. “Mapping and Assessing Coastal Resilience in the Caribbean Region.” Cartography and Geographic Information Science 42 (4): 315–322. doi:10.1080/15230406.2015.1040999.
- Lam, Nina S.-N., Margaret Reams, Kenan Li, Chi Li, and Lillian P. Mata. 2016. “Measuring Community Resilience to Coastal Hazards Along the Northern Gulf of Mexico.” Natural Hazards Review 17 (1): 04015013. doi:10.1061/(ASCE)NH.1527-6996.0000193.
- Li, Linna, Michael F. Goodchild, and Bo Xu. 2013. “Spatial, Temporal, and Socioeconomic Patterns in the Use of Twitter and Flickr.” Cartography and Geographic Information Science 40 (2): 61–77. doi:10.1080/15230406.2013.777139.
- Li, Kenan, Nina S. N. Lam, Yi Qiang, Lei Zou, and Heng Cai. 2015. “A Cyberinfrastructure for Community Resilience Assessment and Visualization.” Cartography and Geographic Information Science 42 (sup1): 34–39. doi:10.1080/15230406.2015.1060113.
- Li, Zhenlong, Cuizhen Wang, Christopher T. Emrich, and Diansheng Guo. 2018. “A Novel Approach to Leveraging Social Media for Rapid Flood Mapping: A Case Study of the 2015 South Carolina Floods.” Cartography and Geographic Information Science 45 (2): 97–110. doi:10.1080/15230406.2016.1271356.
- Lindsay, Bruce R. 2011. “Social Media and Disasters: Current Uses, Future Options and Policy Considerations.” Journal of Current Issues in Media & Telecommunications 2 (4): 287.
- Liu, Xiaohui, Bandana Kar, Chaoyang Zhang, and David M. Cochran. 2018. “Assessing Relevance of Tweets for Risk Communication.” International Journal of Digital Earth, June. https://www.tandfonline.com/doi/abs/10.1080/17538947.2018.1480670.
- Mandel, Benjamin, Culotta Aron, Boulahanis John, Stark Danielle, Lewis Bonnie, and Rodrigue Jeremy. 2012. “A Demographic Analysis of Online Sentiment During Hurricane Irene.” Proceedings of the Second Workshop on Language in Social Media, 27–36. LSM ’12. Stroudsburg, PA: Association for Computational Linguistics. http://dl.acm.org/citation.cfm?id=2390374.2390378.
- Martín, Yago, Zhenlong Li, and Susan L. Cutter. 2017. “Leveraging Twitter to Gauge Evacuation Compliance: Spatiotemporal Analysis of Hurricane Matthew.” PLOS ONE 12 (7): e0181701. doi:10.1371/journal.pone.0181701.
- Merchant, Raina M., Stacy Elmer, and Nicole Lurie. 2011. “Integrating Social Media into Emergency-Preparedness Efforts.” New England Journal of Medicine 365 (4): 289–291. doi:10.1056/NEJMp1103591.
- Mihunov, Volodymyr V., Nina S. N. Lam, Lei Zou, Robert V. Rohli, Nazla Bushra, Margaret A. Reams, and Jennifer E. Argote. 2018. “Community Resilience to Drought Hazard in the South-Central United States.” Annals of the American Association of Geographers 108 (3): 739–755. doi:10.1080/24694452.2017.1372177.
- Muttarak, Raya, and Wiraporn Pothisiri. 2013. “The Role of Education on Disaster Preparedness: Case Study of 2012 Indian Ocean Earthquakes on Thailand’s Andaman Coast.” Ecology and Society 18 (4), http://www.jstor.org/stable/26269420. doi: 10.5751/ES-06101-180451
- National Research Council. 2012. Disaster Resilience: A National Imperative. doi:10.17226/13457.
- NOAA (National Oceanic and Atmospheric Administration). 2018. “2017 Atlantic Hurricane Season.” Accessed July 7, 2018. https://www.nhc.noaa.gov/data/tcr/.
- Petkova, Elisaveta P., Jaishree Beedasy, Eun Jeong Oh, Jonathan J. Sury, Erin M. Sehnert, Wei-Yann Tsai, and Michael J. Reilly. 2018. “Long-Term Recovery from Hurricane Sandy: Evidence From a Survey in New York City.” Disaster Medicine and Public Health Preparedness 12 (2): 172–175. doi:10.1017/dmp.2017.57.
- Ramteke, J., S. Shah, D. Godhia, and A. Shaikh. 2016. “Election Result Prediction Using Twitter Sentiment Analysis.” 2016 international conference on inventive computation technologies (ICICT), 1:1–5. doi:10.1109/INVENTIVE.2016.7823280.
- Reams, Margaret A., Nina S. N. Lam, and Ariele Baker. 2012. “Measuring Capacity for Resilience among Coastal Counties of the U. S. Northern Gulf of Mexico Region.” American Journal of Climate Change 01 (December): 194–204. doi:10.4236/ajcc.2012.14016.
- Rizza, Caroline, and Ângela Guimarães Pereira. 2014. “Building a Resilient Community through Social Network: Ethical Considerations about the 2011 Genoa Floods.” 6.
- Shelton, Taylor, Ate Poorthuis, Mark Graham, and Matthew Zook. 2014. “Mapping the Data Shadows of Hurricane Sandy: Uncovering the Sociospatial Dimensions of ‘Big Data’.” Geoforum 52 (March): 167–179. doi:10.1016/j.geoforum.2014.01.006.
- Singh, Sushant K. 2017. “Evaluating Two Freely Available Geocoding Tools for Geographical Inconsistencies and Geocoding Errors.” Open Geospatial Data, Software and Standards 2 (1): 11. doi:10.1186/s40965-017-0026-3.
- Sloan, Luke, Jeffrey Morgan, Pete Burnap, and Matthew Williams. 2015. “Who Tweets? Deriving the Demographic Characteristics of Age, Occupation and Social Class from Twitter User Meta-Data.” PLOS ONE 10 (3): e0115545. doi:10.1371/journal.pone.0115545.
- Thieken, Annegret H., Heidi Kreibich, Meike Müller, and Bruno Merz. 2007. “Coping with Floods: Preparedness, Response and Recovery of Flood-Affected Residents in Germany in 2002.” Hydrological Sciences Journal 52 (5): 1016–1037. doi:10.1623/hysj.52.5.1016.
- Tsou, Ming-Hsiang. 2015. “Research Challenges and Opportunities in Mapping Social Media and Big Data.” Cartography and Geographic Information Science 42 (sup1): 70–74. doi:10.1080/15230406.2015.1059251.
- Tsou, Ming-Hsiang, and Michael Leitner. 2013. “Visualization of Social Media: Seeing a Mirage or a Message?” Cartography and Geographic Information Science 40 (2): 55–60. doi:10.1080/15230406.2013.776754.
- Walther, Maximilian, and Michael Kaisser. 2013. “Geo-Spatial Event Detection in the Twitter Stream.” In Advances in Information Retrieval, 356–367. Lecture Notes in Computer Science. Berlin, Heidelberg: Springer. doi:10.1007/978-3-642-36973-5_30.
- Wang, Qi, and John E. Taylor. 2014. “Quantifying Human Mobility Perturbation and Resilience in Hurricane Sandy.” PLOS ONE 9 (11): e112608. doi:10.1371/journal.pone.0112608.
- Wong, Kai O., Faith G. Davis, Osmar R. Zaïane, and Yutaka Yasui. 2016. “Sentiment Analysis of Breast Cancer Screening in the United States Using Twitter - Semantic Scholar.” In Porto, Portugal. https://pdfs.semanticscholar.org/10a6/16f71a8f2f2ba9d61091612bfd91e7da9d84.-pdf.
- Yin, J., A. Lampert, M. Cameron, B. Robinson, and R. Power. 2012. “Using Social Media to Enhance Emergency Situation Awareness.” IEEE Intelligent Systems 27 (6): 52–59. doi:10.1109/MIS.2012.6.
- Zhao, Qunshan, Heather Fischer, Wei Luo, and Elizabeth Wentz. 2018. “Community Resilience in Maricopa County, Arizona, USA: The Analysis of Indoor Heat-Related Death and Urban Thermal Environment.” In Madison, Wisconsin, USA. https://www.researchgate.net/publication/325247226_Community_Resilience_in_Maricopa_County_Arizona_USA_The_Analysis_of_Indoor_Heat-related_Death_and_Urban_Thermal_Environment.
- Zou, Lei, Joshua Kent, Nina S.-N. Lam, Heng Cai, Yi Qiang, and Kenan Li. 2015. “Evaluating Land Subsidence Rates and Their Implications for Land Loss in the Lower Mississippi River Basin.” Water 8 (1): 10. doi:10.3390/w8010010.
- Zou, Lei, Nina S. N. Lam, Heng Cai, and Yi Qiang. 2018. “Mining Twitter Data for Improved Understanding of Disaster Resilience.” Annals of the American Association of Geographers 108: 1422–1441. doi:10.1080/24694452.2017.1421897.