
 ?Mathematical formulae have been encoded as MathML and are displayed in this HTML version using MathJax in order to improve their display. Uncheck the box to turn MathJax off. This feature requires Javascript. Click on a formula to zoom.
ABSTRACT
Social media platforms have been contributing to disaster management during the past several years. Text mining solutions using traditional machine learning techniques have been developed to categorize the messages into different themes, such as caution and advice, to better understand the meaning and leverage useful information from the social media text content. However, these methods are mostly event specific and difficult to generalize for cross-event classifications. In other words, traditional classification models trained by historic datasets are not capable of categorizing social media messages from a future event. This research examines the capability of a convolutional neural network (CNN) model in cross-event Twitter topic classification based on three geo-tagged twitter datasets collected during Hurricanes Sandy, Harvey, and Irma. The performance of the CNN model is compared to two traditional machine learning methods: support vector machine (SVM) and logistic regression (LR). Experiment results showed that CNN models achieved a consistently better accuracy for both single event and cross-event evaluation scenarios whereas SVM and LR models had lower accuracy compared to their own single event accuracy results. This indicated that the CNN model has the capability of pre-training Twitter data from past events to classify for an upcoming event for situational awareness.
1. Introduction
Recently, we have unfortunately witnessed a series of deadly hurricane events (e.g. Harvey, Irma, Florence, and Michael) and Northern California wildfires. These events claim many lives, result in billions of dollars of economic loss, and significantly impact the environment. When a natural hazard occurs, managers and responders rely on timely and accurate information about the disaster situations (e.g. damages) to make effective response decisions and improve management strategies. Such information is referred as ‘situational awareness' (SA), i.e. an individually as well as socially cognitive state of understanding ‘the big picture' during critical situations (Vieweg et al. Citation2010). Since SA relevant information mostly has a spatial component (e.g. all damages occur at a specific location), it has been referred as geographically grounded situational awareness (MacEachren et al. Citation2011) or geographic situational awareness (GSA) (Huang and Xiao Citation2015) in geospatial fields. GSA focuses on identifying the locations or areas of damaged infrastructure, affected people, evacuation zones, and the communities of great needs of resources, etc.
Because of the massive popularity of social media networks and their real-time production of data, social media offers new opportunities for natural hazards. For example, social media has contributed significantly in disaster management as a tool to communicate information during emergencies (Charalabidis et al. Citation2014). Social media is increasingly being used by both Non-Governmental Organizations and government emergency management agencies to determine public sentiment and reaction to an event (Emergency Alerting Platform Working Group Citation2016). As a multidirectional flow of communication and information platform, social media efficiently facilitates response and recovery efforts (Roche, Propeck-Zimmermann, and Mericskay Citation2013).
Much useful information in social networks such as Twitter is textual. For example, people post text messages related to the resource, damage, donation or aid during a disaster. From the text, disaster relevant data can be extracted to establish GSA or produce a crisis map (Huang and Xiao Citation2015; Vieweg et al. Citation2010). As the messages broadcasted and shared through the social media networks are extremely massive and varying, an effective text mining solution should be developed to separate the messages into different themes before we can understand the meaning and leverage useful information from the social media text content (Aggarwal and Wang Citation2011). Information about casualties and damage, donation efforts, and alerts are more likely to be used and extracted to improve SA during a time-critical event (Huang and Xiao Citation2015). As a result, messages are typically categorized into these categories. For example, previous work (Imran et al. Citation2013) extracted tweets published during a natural disaster into five categories, including caution and advice, casualty and damage, donation and offer, people, and information source to augment our understanding about disaster situation. While manually examining 5000 sampled tweets generated during the 2012 Hurricane Sandy, we noticed that a large number of informative messages were reporting the status of infrastructure (e.g. transportation) and resource (e.g. gas, power, internet, food). Therefore, we created an additional category named as infrastructure and resource in our classification schema for this study.
Traditional text mining methods mostly rely on machine learning techniques, such as support vector machine (SVM; Cortes and Vapnik Citation1995) and logistic regression (LR; Freedman Citation2009). Those methods have shown mixed results and are criticized for being unable to generalize beyond the scope of the designed study. Such retrospect models have little value for handling data generated during a new disaster event, as they yield the best result in a specific disaster situation. What has been learnt from a specific event was difficult to generalize for other events. One possible reason is that different disaster events evolve differently through time, resulting in different topics could be discussed throughout the social media platform. Another possible reason is that incidents and damages occurred within a specific disaster are different and unpredictable in nature (Lazreg, Goodwin, and Granmo Citation2016).
This research aims to address this challenge by examining the capability of deep learning in cross-event topic classification of Twitter data for disaster SA in different hurricane events. Recently, deep learning has produced promising results for various tasks in text mining (Collobert et al. Citation2011), particularly topic classification, sentiment analysis, question answering (Yu et al. Citation2014), and language translation (Wang, Raj, and Xing Citation2017). The key characteristics of deep learning is that nonlinear, high-level features are self-learned directly from unstructured data, such as images, sound, video, and text (LeCun, Bengio, and Hinton Citation2015). These characteristics have granted deep learning the capability of solving much more complicated artificial intelligence (AI) tasks, including speech recognition, genomic pattern discovery, and unmanned car driving (Wang, Raj, and Xing Citation2017). Currently, deep learning methods include autoencoder, restricted Boltzmann model, deep belief network, convolutional neural network (CNN) and recurrent neural network, and so on.
Using three geo-tagged twitter datasets collected during Hurricane Sandy, Hurricane Harvey, and Hurricane Irma, this research evaluates the performance of the CNN model for cross-event topic classification by comparing with two traditional machine learning models, including SVM and LR. Specifically, two groups of experiments are conducted, including (1) single-event experiment, which randomly selects 80% of the dataset from each disaster event to build the classifiers, and tests the performance of every classifier using the remaining 20%, and (2) cross-event validation experiment, which compares the classifiers that are trained with historical Twitter datasets to classify tweet messages generated during a later event into different topics. Experimental results reveal the proposed model based on CNN is able to establish an evolving SA knowledge base using historical Twitter datasets to facilitate the topic classification for future hurricane events with insufficient training data.
The rest of paper is organized as follows. Section 2 reviews the state-of-the-art work in social media text analysis efforts for disaster management and deep learning efforts for text mining. Section 3 describes the CNN model architecture and the underlying layers inside the network. Section 4 introduces the Twitter dataset for training and testing, the model configuration, and the experiment results of the CNN classifier compared to two well-known machine learning models, including SVM and LR. Section 5 demonstrates the experiment for cross-event validation of the CNN model, and compares it with SVM and LR. Finally, in Section 6, we conclude the research and provide future research directions.
2. Literature review
2.1. Social media for disaster analysis
Previously, methodologies such as phone calls, direct observation or personal interview are commonly used by disaster responders, relief coordinators and damage evaluators to gain SA for emergency response and relief coordination during a critical crisis. However, these data collection methods are time-consuming and laborious in processing the data. Social media data, however, can provide ‘real-time' information for decision-making through multiple stages of the disaster management. Recently, much work has been done to leverage these new data sources to support various disaster relevant analysis and management, such as disaster event detection and tracking (Sakaki, Okazaki, and Matsuo Citation2010), disaster response and relief (Ashktorab et al. Citation2014; Kumar et al. Citation2011; Purohit et al. Citation2014), and damage assessment (Cervone et al. Citation2016).
Among the massive social media data collected during a period for a natural hazard, only a small portion of the messages are related and contribute to SA. Due to the volume of data is far beyond the capabilities of manual examination, text mining of social media messages typically starts with filtering out non-relevant messages and transforms unstructured text data sets into a structured form using various natural language processing techniques (NLP; Chae et al. Citation2012). Next, more advanced text mining techniques based on machine learning algorithms then can be applied to assign pre-defined topics to text documents (classification) or automatically structure document collections to find groups of similar documents (clustering; Hotho, Nürnberger, and Paaß Citation2005). A few attempts have been made to uncover and explain the social media message topics discussed when Twitter users communicate during mass emergencies (Huang and Xiao Citation2015; Imran et al. Citation2013; Vieweg et al. Citation2010). Imran et al. (Citation2013), for instance, extracted tweets published during a natural disaster into several categories, including caution and advice, casualty and damage, donation and offer, and information source. The content categories (or topics) defined in those studies (Vieweg et al. Citation2010; Imran et al. Citation2013) are very useful to explore and extract the data involved in the disaster response and recovery phases. However, those content categories or topics (Imran et al. Citation2013; Imran and Castillo Citation2015; Vieweg et al. Citation2010; Vieweg Citation2012) mostly considered and are very useful to explore and extract the data involved in the disaster response and recovery phases. Huang and Xiao (Citation2015) made an effort by coding social media messages into different categories within various stages of disaster management by including useful information that could be posted before or after a disaster event. Since our study focuses on the messages during the response and recovery phases, we will use the message coding schema based on Imran et al. (Citation2013)’s work.
While classifying social media messages into different topics, previous work primarily applies traditional machine learning techniques, such as SVM (Cortes and Vapnik Citation1995) and LR (Freedman Citation2009). One drawback for traditional machine learning approaches is that these supervised classifiers learnt from a specific event do not generalize well to other events as different events may generate unique responses on social media (Li et al. Citation2015). Due to this drawback, when using these methods, we have to manually examine tweets for a new event and train a new classifier to identify different topics, which is labor intensive and time-consuming.
2.2. Deep learning for text mining
Deep learning technology is applied in common text mining tasks, such as sentiment analysis (Severyn and Moschitti Citation2015), text classification (Liu et al. Citation2015), text generation (Graves Citation2013) and social event detection (Chen et al. Citation2015). In this study, we examine the capability of CNN in text classification for disaster relevant tweets and facilitate the rapid identification of disaster response and relief contents. Therefore, here we review the deep learning technologies, particularly for text classification.
CNN was one of the most popular methods for pattern recognition. Kim (Citation2014) described the basics of CNN for sentence-level classification tasks using pre-trained word vectors. Detection filters with different lengths were used to convolve text matrix to search for the presence of specific features or patterns present in the text. Then max pooling, operating extractive vectors of every filter, was employed to down-sample the input representation by reducing its dimensionality and allowing for assumptions to be made about features contained in the filtered subregions. Finally, each filter corresponded to a digit and these filters were connected to obtain a vector representing this sentence, on which the final prediction was based. Zhang and LeCun (Citation2015) applied deep learning to text understanding using temporal convolutional networks (ConvNets; LeCun et al. Citation1998) and conducted experiments, including ontology classification, sentiment analysis, and text categorization, on various large-scale datasets. Results showed that temporal ConvNets can achieve satisfactory performance without the knowledge of words, phrases, sentences and any other syntactic or semantic structures with regards to a human language. Furthermore, Zhang, Zhao, and LeCun (Citation2015) applied ConvNets only on characters using large-scale datasets, and the experiment results showed that deep ConvNets is able to classify words without the knowledge of words or the syntactic or semantic structure of a language. The aforementioned literature deals with sentence-based text data, whereas Lai et al. (Citation2015) proposed a recurrent convolutional neural network (RCNN) and achieved promising results on document-level datasets.
More recently, deep learning methods have been applied to the field of disaster response utilizing social media datasets. Caragea, Silvescu, and Tapia (Citation2016) and Nguyen et al. (Citation2017) utilized CNN models to identify informative tweets for flood events and earthquake events respectively. Aipe et al. (Citation2018) utilized a deep CNN model to extract linguistic features from tweets and utilize these features to classify tweets into different informative categories for crisis management. However, the capability of deep learning on cross-event multi-class tweet topic classification needs to be further examined, and this research serves as the starting point of establishing an evolving knowledge base for Twitter topic classification for disaster situation awareness.
3. Methodology
The general CNN architecture can be created using multiple layers, such as input, convolution, pooling, activation, and output layers. A deep CNN is defined when the architecture is composed of convolution layers and auxiliary layers (e.g. dropout and batch normalization layers). This section explains the overall architecture, the layers used in this study, and the backgrounds of each layer.
3.1. Overall architecture
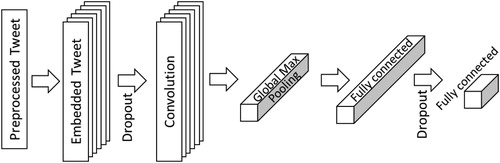
presents the CNN architecture, which is the configuration for geo-tagged tweet theme classification. The first step is preprocessing, where each word of the tweet is represented by an integer (Section 3.2). The preprocessed tweet passes through the first layer, word embedding, which expands the word integers to a larger matrix and represents them in a more meaningful way (Section 3.3). The convolution layer then extracts features from the word embedding and transforms them through global max pooling (Sections 3.4 and 3.5). Then two fully connected layers predict the themes of each tweet (Section 3.8). Dropout layers are utilized before the convolution layer and the last fully connected layer (Section 3.6). Activation functions are used after the convolution layer and the fully connected layers (Section 3.7).
Figure 1. Overall architecture of the CNN.
3.2. Preprocessing
Since machines understand numbers better than words, we first need to split each text into words and represent each word by a number to train our neural network with texts. The most common words are represented with lower numbers, thus we can easily train on only the N most common words in our dataset, and adjust N as necessary. In this way, we can ignore rare words, which neural networks can hardly learn from and might increase the processing time. In the experiment, we calculate the frequency of each word and select the 2,000,000 first most-common words in the dataset. Then all tweets are converted to list of integers. Finally, each list of integers is ‘padded’, so that all training and testing examples are in the same size (50 integers).
3.3. Embedding layer
The list of integers is further computed into known embedding, by parsing the data using pre-trained embedding, word2vec, which were trained on 100 billion words from Google News (Mikolov et al. Citation2013). In word2vec, words with similar semantic meanings are represented closely in the embedded vector space. The words oak, elm, and birch may cluster in one corner, while war, conflict and strife group together in another. This layer lets the network expand each token to a larger vector, allowing the network to represent words in a meaningful way ().
Table 1. Dimensions of layers and operations.
3.4. Convolution layer
The convolution layer performs the following three operations throughout an input array. First, it performs element-by-element multiplications (i.e. dot product) between a subarray of an input array, and a filter, which is also often called the filter, or kernel. Second, the multiplied values are summed, and bias is added to the summed values. One of the advantages of the convolution is that it reduces input data size, which reduces computational cost. A convolution operation involves a weight matrix w, which is applied to a window of h words to produce a new feature. For example, a feature is generated through
(1)
(1) Here b is a bias term and f is a nonlinear function. This operation is applied to each possible window of words in the text array {x1:h, x2:h+1, ... , xn−h+1:n }and produces a feature map:
(2)
(2)
Three hyperparameters control the size of the output: the depth, padding and stride. The depth corresponds to the number of filters, and each different number will learn different information from the input. For example, the convolution layer takes the word embedding as input, and then different neurons along the depth dimension may activate in presence of various oriented edges. So, the depth column is a set of neurons looking at the same region of the input. The padding controls the size of the output volumes. The stride defines for the filter how many of columns and rows slide at a time across the input array's width and height. A larger stride size leads to fewer filter applications and a smaller output size reduces computational cost but may lose features of the input data.
The convolution layer accepts word embedding of size [50*300]. It uses neurons with filter size F = 3, stride S = 1, no padding P = 0, and depth K = 250. The output size of a convolution is [(input width – filter size)/stride + 1 = 48]. Each of the 48*250 neurons in this volume is connected to a size [1*3] region of the input. Moreover, all 250 in each depth column are connected to the same [1*3] region of the input, but with different weights.
3.5. Global max pooling layer
The global max pooling layer (Lin, Chen, and Yan Citation2013) reduces the size of the representation to decrease the number of parameters and computation in the network, and hence also controls overfitting. Consecutive layers of the network are activated by ‘higher' or more complex features, thus strategically reducing the size of the representation will still pass on the valid information from the previous layer to the next one. The global max pooling operation performs by reducing the dimensions of the input of 1×50×250–1×1×250, and reduces each 1×50 feature map to a single number by simply taking the average of all 1×50 values.
3.6. Dropout layers
Overfitting, a long-standing issue in the field of machine learning, happens when a network classifies a training data set effectively but fails to provide satisfactory validation and testing results. This happens when a neural network is built, two or more neurons begin to detect the same feature repeatedly, i.e. co-adaptations. To address this issue, dropout layers (Srivastava et al. Citation2014) are used to randomly disconnect the connections between neurons of connected layers at a certain dropout rate. Accordingly, a network can generalize training examples much more efficiently by reducing these co-adaptations. In this model, the dropout rate is 0.2.
3.7. Activation layer
Activation functions are an extremely important feature of the artificial neural networks. They basically decide whether a neuron should be activated or not. Whether the information that the neuron is receiving is relevant for the given information or should it be ignored. Since all layers in a neural network are nonlinear, values for each of the neurons are calculated and put through an activation function. The most typical way to give nonlinearity in the neural network calculation is using sigmoidal functions, such as . However, it has been claimed that saturating nonlinearities slows down computations (Nair and Hinton Citation2010).
ReLU was introduced as a nonlinear activation function (Nair and Hinton Citation2010). It is defined as . Briefly, while other nonlinear functions are bounded to output values (e.g. positive and negative ones and zeros), the ReLU has no bounded outputs except for its negative input values, which means that it does not activate all the neurons at the same time, making the network sparse but efficient and easy for computation. Intuitively, the gradients of the ReLU are always zeros and ones. These features speed up computations than those using sigmoidal functions and achieve better accuracies.
The softmax function is another type of sigmoid function. The sigmoid function can only handle two classes, whereas softmax is effective in handling multi-classification problems. The output of the softmax function can be represented as a categorical distribution. The goal of softmax is to highlight the largest values and suppress values which are significantly below the maximum value. The softmax function can be defined as(3)
(3) The softmax function is ideally used in the output layer of the classifier where we intend to obtain the probabilities to define the class of each input.
3.8. Fully connected layer
Neurons in a fully connected layer have full connections to all activations in the previous layer, as seen in regular Neural Networks. Their activations can be computed with a matrix multiplication followed by a bias offset: , where Y is the predictions, X is the previous layer output, W is the weights, and b is the biases.
Adding a fully connected layer is a cheaper way of learning nonlinear combinations of these features. Most of the features from convolutional and pooling layers are good for the classification task, but combinations of those features could be even better. The first fully connected layer uses ReLU as the activation function, and its output is [0, +∞).
The output from the convolution and pooling layers represent high-level features of the input text array. The purpose of the fully connected layer is to use these features for classifying the input into various classes based on the training dataset. The sum of output probability from the fully connected layer is 1, ensured by using softmax as the activation function in the output layer of the fully connected layer. The softmax function takes a vector of arbitrary real-valued scores and squashes it to a vector of values between zero and one that sums to one.
4. Building a classifier for classifying tweet theme
This section describes the dataset generation and the underlying hyperparameters assigned to train the deep learning model. Configuring and choosing adequate hyperparameter (e.g. batch size and iteration number) is tedious and no existing guidelines for those parameter optimizations are available. Thus, the optimal network architecture for the tweet theme classification must be explored via trial-and-error and guided by checking the validation set error (Goodfellow et al. Citation2016). The classifier is developed by the library Keras (https://github.com/keras-team/keras) with TensorFlow as the backend.
4.1. Dataset
Twitter data from three hurricane events, including the 2012 Sandy, 2017 Harvey and 2017 Irma, are collected and used as experiment datasets. For each hurricane event, around 5000–15,000 tweets were manually reviewed (Sandy: 5000, Harvey: 7342, Irma: 15,254), and around 2000–3000 informative tweets (Sandy: 1900, Harvey: 2180, Irma: 3910) were annotated into different categories.
Our classification scheme is derived and modified from existing work with five commonly used classes, including (1) Caution and Advice (CA), (2) Casualties and Damage (CD), (3) Information Sources (IS), (4) Donation and Aid (DA), and (5) People (Imran et al. Citation2013). Due to few samples in People and oversized sample in CA, we removed People class and extracted a portion of CA tweets and defined an additional class named infrastructure and resource (IR). IR is related to the status of infrastructure (e.g. transportation) and resource (e.g. gas, power, internet, food), which are very useful to establish GSA. For example, disaster managers and the public may want to quickly traffic status for an effective evacuation plan. The descriptions for the five classes are illustrated in . This classification scheme is suitable for the twitter data of the three hurricane events, as it produces equally distributed samples within each class without a great imbalance issue.
Table 2. Social media classification scheme.
shows the temporal distribution of the five tweet topics during the hurricane events. For Hurricane Sandy, a significant increase of tweet number for ‘Caution and Advice' can be observed on October 29, since the wind, rain, and flooding occurred in the city during that night. We also observe an increase for the class ‘Infrastructure and Resources' on October 30, and a continuous increase of ‘Casualties and Damage' during the two days of October 30 and 31. Moving forward, we observe a gradual increase for ‘Donation and Aid' throughout the study time period until it reaches its peak on November 3, and decreases gradually for the rest of the time.
Figure 2. Tweet topic over time.
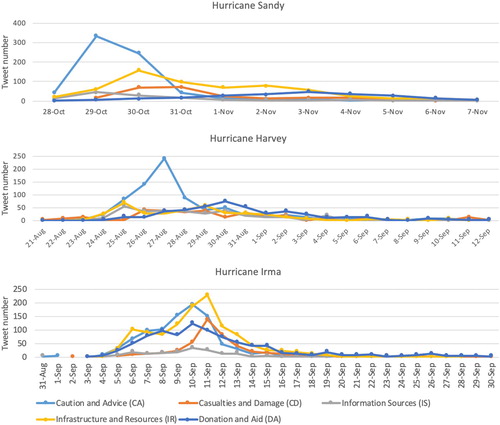
For Hurricane Harvey, ‘Caution and Advice' also appears to be the dominating topic with a peak of ∼250 tweets on August 27 and a rapid increase and decrease before and after the peak. Both ‘Infrastructure and Resources' and ‘Information Sources' display a different pattern between Hurricane Sandy and Harvey, which has two peaks on August 25th and 29th, 2017. On 25 August 2017, Harvey hit Port Aransas and Port O’Connor near Corpus Christi with 130 mph winds. The Category 4 hurricane left 250,000 people without power. On August 29, Harvey made landfall for a third time as it hit the coastal cities of Port Arthur and Beaumont Texas on the border of Louisiana. It dumped 26 in. of rain in 24 h. It flooded Port Arthur, a city of 55,000 people. Water entered one-third of the city's building, including the shelter. Beaumont has been without drinking water since the storm. A time lag can be observed for ‘Casualties and Damage’ which reached its peak on August 26th, one day after Harvey made its landfall, and remained active during Harvey's peak days. ‘Donation and Aid’ shows a similar pattern as the one in Hurricane Sandy, which increases gradually until it reached its peak on August 30th and decreased gradually.
For Hurricane Irma, it was first developed from a tropical wave near Cape Verde on 30 August 2017. Topics about preparing for Irma started until it reached to its first peak on 6 September 2017 when it hit the Leeward Islands and left hundreds in Puerto Rice without power on 7 September 2017. Irma remained a Category 5 hurricane on September 8, downgraded to Category 3 on September 9, and regained its strength to Category 4 on September 10, when it affected Florida Keys with hugh rainfall and high storm surge. After September 11, Irma downgraded to Category 1 and then a tropical storm.
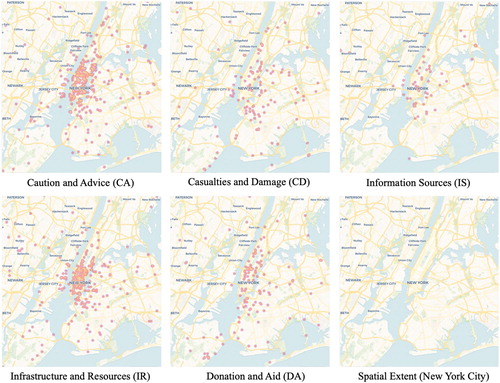
shows the spatial distribution of the five topics in the New York area during the Hurricane Sandy using heatmaps. It is observed that most tweets for ‘Caution and Advice' are from the communities of lower Manhattan, since news reports broadcasted that this area would be impacted and drew people's attention. Similar distribution can be observed for the class ‘Information Resources' due to the dense population in the same area. Tweets about ‘Casualties and Damage' are more distributed in the area indicating damages of storm surge and high winds occurred throughout the area. Similar patterns can be observed for the class ‘Donation and Aid' mentioning about ‘red cross’, ‘FEMA', and ‘volunteering'.
Figure 3. Spatial distribution of Hurricane Sandy tweet topic.
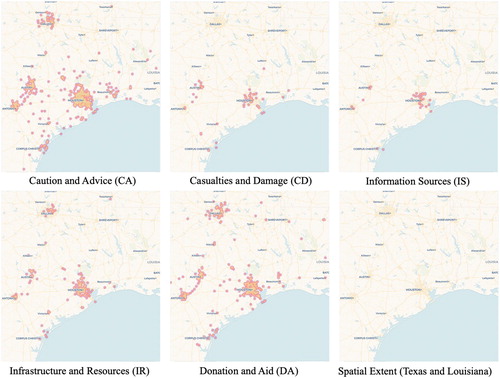
illustrates the spatial distribution of tweets in the Texas and Louisiana area during Hurricane Harvey. Tweets providing ‘Caution and Advice' were spread in major cities in Texas, including Houston, Dallas, Austin, San Antonio and the Texas coast area. Given that Hurricane Harvey impacted most severely in Houston area where most of the population are located, most of the tweets related to ‘Casualties and Damage', ‘Information Sources', and ‘Infrastructure and Resources' are located at the Houston area. ‘Donation and Aid' are more broadly distributed and not so much dependent on destruction severity and geography area.
Figure 4. Spatial distribution of Hurricane Harvey tweet topic.
Different from Hurricane Harvey, Hurricane Irma had a more spatially distributed impact to Florida area regarding ‘Caution and Advice', ‘Casualty and Damage', ‘Infrastructure and Resources', and ‘Donation and Aid', but there was fewer official information than Harvey. Irma's large wind field resulted in strong winds across the state of Florida and over 70% homes lost power. Heavy rainfall – and storm surge, in some instances – caused at least 32 rivers and creeks to overflow, resulting in significant flooding, especially along the St. Johns River and its tributaries. These impacts occurred in a fairly short amount of time (September 9–11) sweeping from Southeast Florida towards Georgia, which explains the spatial distribution of tweets in the impacted area.
4.2. Experiment configuration
As the CNN model is defined and described in Section 3, it needs to be compiled for efficient training, which represents the process of finding the best set of weights to make predictions. Compiling the model requires the specification of the lost function (used to evaluate a set of weights), the optimizer (used to search through different weights for the network) and metrics (used to judge the performance of the model). The metrics are similar to a loss function, but the results from evaluating a metric are not used when training the model, whereas the loss function gets minimized by the optimizer to optimize the model during training. In this experiment, we use the categorical cross-entropy as the loss function, RMSprop (Hinton, Srivastava, and Swersky Citation2012) as the optimizer, and categorical accuracy as the metrics.
After being compiled for efficient computation, the model is executed on training data for the training process. The training process runs for 50 iterations, which is specified by the parameter ‘epoch’. We used a batch size of 70, the number of instances that are evaluated before a weight update in the network is performed. The epoch and batch size are chosen experimentally through trial and error. Tweets are randomly selected from the dataset to generate training (80%) and validation (20%) sets.
4.3. CNN results
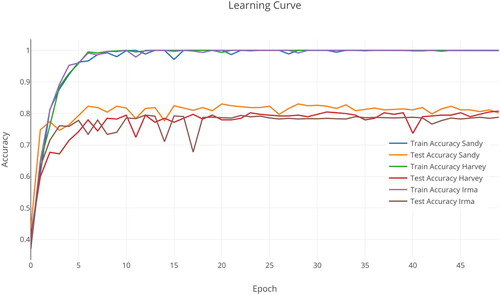
The classification accuracy on the training data and test data changes over time (). The accuracy rises gradually towards 1.0, whereas the test accuracy reaches ∼0.81. This indicates that our network is overfitting, i.e. the network is memorizing the training set, without understanding texts well enough to generalize to the test set. As a major problem in neural networks, overfitting is difficult to address especially when deep learning networks often have very large numbers of weights and biases. In this case, the network has 2,138,155 parameters with 289,255 trainable parameters. Although techniques like dropout and regularization have been utilized in our network, the sign of overfitting is still not improving. The reason is that our training dataset is relatively small with ∼1200 samples for each hurricane event, comparing to other benchmarking large-scale datasets, e.g. AG's news: 120,000 train samples and Amazon Review Full: 3,600,000 train samples (Zhang, Zhao, and LeCun Citation2015). The size of our train and test data is limited by the nature of twitter data, which was harvested real time through Twitter Streaming API. Currently, while we are not able to increase the dataset, we assume that using twitter data integrated from multiple disasters to increase the dataset will produce better performance with this CNN model ().
Figure 5. Spatial distribution of Hurricane Irma tweet topic.
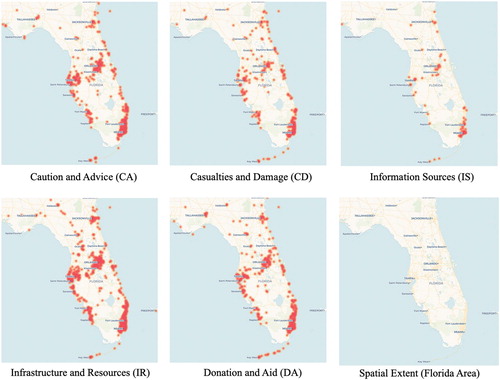
Figure 6. Learning curve of the CNN classifier.
5. Comparative studies
The CNN classifier is compared in terms of its capability on single-event and cross-event topic classification against the well-established text classification methods SVM and LR. For single-event experiment, we randomly select from the single-event dataset to generate training (80%) and validation (20%) sets. For cross-event experiment, we train the classifiers using the dataset from one event and test the others.
5.1. Single-event experiment among the classifiers
Three single-event experiments were conducted for using the twitter datasets for each hurricane event correspondingly. We performed a statistical analysis on the outcomes of the classification for both methods. A confusion matrix for each experiment was created by calculating values for the five classes in main diagnostic tests including Positive predictive value (Precision), True positive rate (Recall), and F1-score. The overall or averaged accuracy scores are demonstrated in and the scores for each topic are demonstrated in box plots in . It is evident that the CNN model outperformed SVM and LR. With respect to Precision, the CNN model had values ∼0.8 while the SVM model had 0.63–0.72 and LR had 0.44–0.6 for the three experiments. Almost similar behavior is observed in the Recall and in F1-score, where CNN achieved the best performance while SVM and LR had lower scores. These findings state clearly that CNN outperforms traditional text mining approaches for tweet classification presenting the potential for further development on tweet theme identification.
Figure 7. Performance scores comparison among CNN, SVM, and LR.
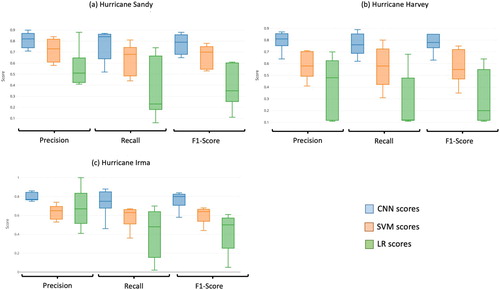
Table 3. Overall accuracy scores for single event experiments.
5.2. Cross-event validation
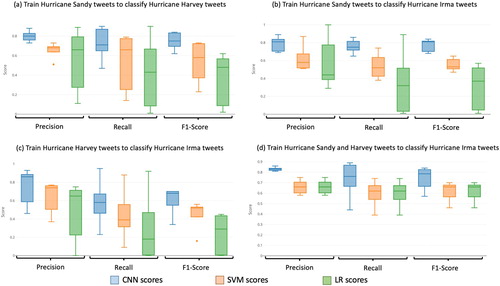
We apply the same methodology for cross-event experiments, and based on the three Hurricane events, we have designed four experiments which utilize twitter data from one or more historical events as training data to classify the data from a later event. This design ends up with four experiments: (a) Train Hurricane Sandy tweets to classify Hurricane Harvey tweets, (b) Train Hurricane Sandy tweets to classify Hurricane Irma tweets, (c) Train Hurricane Harvey tweets to classify Hurricane Irma tweets, and (d) Train Hurricane Sandy and Harvey tweets to classify Hurricane Irma tweets.
The accuracy scores are recorded in . Results showed that the CNN model achieved a consistent accuracy for the cross-event experiments with an average precision around 0.8. However, SVM and LR resulted in much lower accuracy than using a single event for training and testing. In addition, by combining the twitter data from two historical events (Sandy and Harvey) as training data to classify the topics for a later event (Irma), we achieved better accuracy results for all three classifiers (for precision, CNN: 0.83, SVM: 0.67 and LR: 0.67) than using only one event to classify another. Therefore, the CNN model outperformed SVM and LR when applying to different events; and this capability enables CNN to better predict and classify twitter topics for future events based on a pre-trained model built on the datasets generated during past events.
Table 4. Overall accuracy scores for cross-event experiments.
The boxplots () for each cross-event experiment reveal the limitations for SVM and LR on classifying different topic categories. It is observed that the ranges in accuracy scores are more stretched compared to the single-event experiments () for SVM and LR.
Figure 8. Cross-event classification accuracy.
A notable difference is that in Hurricane Sandy twitter texts were more explicit in text messages, whereas in Hurricane Harvey and Irma twitter texts contained more links to other websites or apps, such as Instagram, news reports, and using images and videos rather than expressing in full sentences. Therefore, the messages conveyed from Hurricane Harvey and Irma tweets are less explicit than the ones from Hurricane Sandy. In future studies, we will incorporate the information discovered from images, videos, and news reports to complete the message being shared from the Twitter users to better facilitate the disaster response stage.
5.2. Discussion
CNN outperforms SVM and LR in single-event topic classification. This is probably due to the complexity of Twitter data in nature since the tweets typically contain misspellings, abbreviations, deletions and phonetic spellings. The training set is produced through a human labeling process, which may introduce different levels of uncertainty. SVM, LR, and other machine learning methods largely depend on the correctness of the training set, whereas CNN is capable of deducting high-level abstraction from the tweets.
The capability of CNN on cross-event topic classification indicates that with existing knowledge base constructed from past hurricane events, we are able to classify twitter topics in the early hours of a new event. CNN outperforms SVM and LR in cross-event classification because it can provide a generic solution that infers similarity and dissimilarity patterns between different events. However, CNN is more time consuming than SVM and LR because there are more parameters to learn, which poses a challenge for utilizing CNN for online learning when social media data is streaming and accumulating rapidly.
6. Conclusion and future research
This research examines the capability of a deep learning model based on CNN for twitter topic classification under the background of Hurricanes Sandy, Harvey, and Irma disaster management. In the paper, we described the CNN model, and applied the classifier to three manually labeled twitter datasets, which are classified into five different topics: Caution and Advice, Casualties and Damage, Information Sources, Infrastructure and Resources, and Donation and Aid. Even though the CNN used in the experiments is a basic model and has not been further optimized to the task at hand, the results show a significantly higher performance in direct comparison to traditional approaches on the considered dataset. For single-event experiment, the CNN classifier achieves an accuracy up to 0.81 for all three datasets, and consistently outperforms two well-known classification methods SVM (0.63–0.72) and LR (0.44–0.60). The cross-event validation was conducted by using the CNN built on twitter data from historical events to classify tweet messages posted during a later event t. Experiment results showed that CNN achieved a consistent performance, whereas the accuracy of SVM and LR dropped significantly. Additionally, by combining multiple datasets from different historical events, we can achieve a higher accuracy when classifying datasets generated from a later event. This leads to the assumption that a CNN model, similar to the one evaluated in the experiments, is preferable for the task of social media data classification in a context of disaster management. In addition, the CNN model has the capability of using Twitter data from past events to classify twitter topics of an upcoming event in real time for enhanced SA.
A significant improvement can be expected using larger-scale dataset for training and testing. Future research may test the performance of CNN-based model using labeled twitter datasets from multiple disasters of the same kind (e.g. combining twitter data from multiple hurricane events, hurricanes in the past 10 years). In addition, this research is applying the CNN model to twitter text only. To improve the classification accuracy, features of each tweet can be enhanced by adding the contextual information, including its geolocation, environmental conditions (e.g. wind and precipitation), and other linked media (news, blogs, images, and videos). Finally, other deep learning technologies, such as recurrent neural networks (RNN) and long-short term memory (LSTM), may be further explored.
Acknowledgements
Dr. Manzhu Yu and Dr. Qunying Huang initiated the original idea. Dr. Manzhu Yu wrote the major part of the paper. Dr. Qunying Huang contributed on the introduction and literature review, and also revised the paper. Mr. Chris Scheele helped with the Tweeter data preprocessing and classification scheme. Dr. Han Qin helped with experiment design and implementation. Dr. Chaowei Yang revised a later version of the paper.
Disclosure statement
No potential conflict of interest was reported by the authors.
Additional information
Funding
References
- Aggarwal, C. C., and H. Wang. 2011. “Text Mining in Social Networks.” In Social Network Data Analytics, edited by C. C. Aggarwal, 353–378. Boston, MA: Springer.
- Aipe, A., N. S. Mukuntha, A. Ekbal, and S. Kurohashi. 2018. “Deep Learning Approach towards Multi-label Classification of Crisis Related Tweets.” In Proceedings of the 15th ISCRAM Conference, edited by Kees Boersma and Brian Tomaszewski, Rochester, NY, USA May 2018.
- Ashktorab, Z., C. Brown, M. Nandi, and A. Culotta. 2014. “Tweedr: Mining Twitter to Inform Disaster Response.” In Proceedings of the 11th International ISCRAM Conference, 18–21 May 2014, University Park, PA, USA, edited by S. R. Hiltz, M. S. Pfaff, L. Plotnick, and P. C. Shih, 354–358. University Park, PA: Pennsylvania State University.
- Caragea, C., A. Silvescu, and A. H. Tapia. 2016, May. “Identifying Informative Messages in Disaster Events Using Convolutional Neural Networks.” International Conference on Information Systems for Crisis Response and Management, 137–147.
- Cervone, G., E. Sava, Q. Huang, E. Schnebele, J. Harrison, and N. Waters. 2016. “Using Twitter for Tasking Remote-Sensing Data Collection and Damage Assessment: 2013 Boulder Flood Case Study.” International Journal of Remote Sensing 37 (1): 100–124. doi: 10.1080/01431161.2015.1117684
- Chae, J., D. Thom, H. Bosch, Y. Jang, R. Maciejewski, D. S. Ebert, and T. Ertl. 2012. “October. Spatiotemporal Social Media Analytics for Abnormal Event Detection and Examination Using Seasonal-Trend Decomposition.” In 2012 IEEE Conference on Visual Analytics Science and Technology (VAST), October 14–19, 2012, Seattle, WA, USA, 143–152. New York, NY: IEEE.
- Charalabidis, Y., EN, Loukis, A. Androutsopoulou, V. Karkaletsis, and A. and Triantafillou. 2014. “Passive Crowdsourcing in Government Using Social Media.” Transforming Government: People, Process and Policy 8 (2): 283–308. doi: 10.1108/TG-09-2013-0035
- Chen, Y., L. Xu, K. Liu, D. Zeng, and J. Zhao. 2015. “Event Extraction via Dynamic Multi-Pooling Convolutional Neural Networks.” In Proceedings of the 53rd Annual Meeting of the Association for Computational Linguistics and the 7th International Joint Conference on Natural Language Processing (Vol. 1), July 26–31, 2015, Beijing, China, 167–176. Stroudsburg, PA: ACL.
- Collobert, R., J. Weston, L. Bottou, M. Karlen, K. Kavukcuoglu, and P. Kuksa. 2011. “Natural Language Processing (Almost) From Scratch.” Journal of Machine Learning Research 12 (Aug): 2493–2537.
- Cortes, C., and V. Vapnik. 1995. “Support-vector Networks.” Machine Learning 20 (3): 273–297.
- Emergency Alerting Platform Working Group, 2016. Social Media & Complementary Alerting Methods – Recommended Strategies & Best Practices. Available from: https://www.atis.org/01_legal/docs/CSRIC%20V/WG2_FinalReport_091416.docx [Accessed May 24, 2018]
- Freedman, D. A. 2009. Statistical Models: Theory and Practice. Cambridge: Cambridge University Press.
- Goodfellow, I., Y. Bengio, A. Courville, and Y. Bengio. 2016. Deep Learning. Vol. 1. Cambridge: MIT press.
- Graves, A., 2013. Generating sequences with recurrent neural networks. arXiv preprint arXiv:1308.0850.
- Hinton, G., N. Srivastava, and K. Swersky. 2012. “Rmsprop: Divide the Gradient by a Running Average of its Recent Magnitude.” Neural Networks for Machine Learning, Coursera lecture 6e.
- Hotho, A., A. Nürnberger, and G. Paaß. 2005. “A Brief Survey of Text Mining.” Journal for Computational Linguistics and Language Technology 20 (1): 19–62.
- Huang, Q., and Y. Xiao. 2015. “Geographic Situational Awareness: Mining Tweets for Disaster Preparedness, Emergency Response, Impact, and Recovery.” ISPRS International Journal of Geo-Information 4 (3): 1549–1568. doi: 10.3390/ijgi4031549
- Imran, M., and C. Castillo. 2015. “Towards a Data-Driven Approach to Identify Crisis-Related Topics in Social Media Streams.” In Proceedings of the 24th International Conference on World Wide Web, May 13–17, 2013, Rio de Janeiro, Brazil, 1205–1210. New York, NY: ACM.
- Imran, M., S. Elbassuoni, C. Castillo, F. Diaz, and P. Meier. 2013. “Practical Extraction of Disaster-Relevant Information From Social Media.” In Proceedings of the 22nd International Conference on World Wide Web, May 13–17, 2013, Rio de Janeiro, Brazil, 1021–1024. New York, NY: ACM.
- Kim, Y., 2014. Convolutional neural networks for sentence classification. arXiv preprint arXiv:1408.5882.
- Kumar, S., G. Barbier, M. A. Abbasi, and H. Liu. 2011. “TweetTracker: An Analysis Tool for Humanitarian and Disaster Relief.” In Fifth International AAAI Conference on Weblogs and Social Media, July 17–21, 2011, Barcelona, Spain, 661–662. Palo Alto, CA: AAAI Press.
- Lai, S., L. Xu, K. Liu, and J. Zhao. 2015. “Recurrent Convolutional Neural Networks for Text Classification.” In Proceedings of the Twenty-Ninth AAAI Conference on Artificial Intelligence, January 25–30, 2015, Austin, TX, USA, 2267–2273. Palo Alto, CA: AAAI Press.
- Lazreg, M.B., Goodwin, M. and Granmo, O.C., 2016. “ Deep learning for social media analysis in crises situations.” The 29th Annual Workshop of the Swedish Artificial Intelligence Society (SAIS) 2–3 June 2016, Malmö, Sweden, 31.
- LeCun, Y., Y. Bengio, and G. Hinton. 2015. “Deep Learning.” Nature 521 (7553): 436. doi: 10.1038/nature14539
- LeCun, Y., L. Bottou, Y. Bengio, and P. Haffner. 1998. “Gradient-based Learning Applied to Document Recognition.” Proceedings of the IEEE 86 (11): 2278–2324. doi: 10.1109/5.726791
- Li, H., Guevara, N., Herndon, N., Caragea, D., Neppalli, K., Caragea, C., Squicciarini, A.C. and Tapia, A.H., 2015. Twitter Mining for Disaster Response: A Domain Adaptation Approach. In ISCRAM, May.
- Lin, M., Q. Chen, and S. Yan. 2013. Network in network. arXiv preprint arXiv:1312.4400.
- Liu, P., X. Qiu, X. Chen, S. Wu, and X. Huang. 2015. “Multi-timescale Long Short-Term Memory Neural Network for Modelling Sentences and Documents.” In Proceedings of the 2015 Conference on Empirical Methods in Natural Language Processing, September 17–21, 2015, Lisbon, Portugal, 2326–2335. Stroudsburg, PA: Association for Computational Linguistics.
- MacEachren, A. M., A. Jaiswal, A. C. Robinson, S. Pezanowski, A. Savelyev, P. Mitra, X. Zhang, and J. Blanford. 2011. “Senseplace2: Geotwitter Analytics Support for Situational Awareness.” In 2011 IEEE Conference on Visual Analytics Science and Technology (VAST), October 23–28, 2011, Providence, RI, USA, 181–190. New York, NY: IEEE.
- Mikolov, T., K. Chen, G. Corrado, and J. Dean. 2013. Efficient Estimation of Word Representations in Vector Space. arXiv preprint arXiv:1301.3781.
- Nair, V., and G. E. Hinton. 2010. “Rectified Linear Units Improve Restricted Boltzmann Machines.” In Proceedings of the 27th International Conference on Machine Learning, June 21–24, 2010, Haifa, Israel, 807–814. Madison, WI: Omnipress.
- Nguyen, D. T., K. Al-Mannai, S. R. Joty, H. Sajjad, M. Imran, and P. Mitra. 2017, May. “Robust Classification of Crisis-Related Data on Social Networks Using Convolutional Neural Networks.” ICWSM, 632–635.
- Purohit, H., C. Castillo, F. Diaz, A. Sheth, and P. Meier. 2014. “Emergency-relief Coordination on Social Media: Automatically Matching Resource Requests and Offers.” First Monday 19 (1). https://uncommonculture.org/ojs/index.php/fm/article/view/4848/3809.
- Roche, S., E. Propeck-Zimmermann, and B. Mericskay. 2013. “GeoWeb and Crisis Management: Issues and Perspectives of Volunteered Geographic Information.” GeoJournal 78 (1): 21–40. doi: 10.1007/s10708-011-9423-9
- Sakaki, T., M. Okazaki, and Y. Matsuo. 2010. “Earthquake Shakes Twitter Users: Real-Time Event Detection by Social Sensors.” In Proceedings of the 19th International Conference on World Wide Web, April 26–30, 2010, Raleigh, NC, USA, 851–860. New York, NY: ACM.
- Severyn, A., and A. Moschitti. 2015. “Twitter Sentiment Analysis with Deep Convolutional Neural Networks.” In Proceedings of the 38th International ACM SIGIR Conference on Research and Development in Information Retrieval, August 9–13, 2015, Santiago, Chile, 959–962. New York, NY: ACM.
- Srivastava, N., G. Hinton, A. Krizhevsky, I. Sutskever, and R. Salakhutdinov. 2014. “Dropout: A Simple way to Prevent Neural Networks From Overfitting.” The Journal of Machine Learning Research 15 (1): 1929–1958.
- Vieweg, S. E. 2012. “ Situational awareness in mass emergency: A behavioral and linguistic analysis of microblogged communications.” Doctoral dissertation, University of Colorado at Boulder.
- Vieweg, S., A. L. Hughes, K. Starbird, and L. Palen. 2010. “Microblogging During two Natural Hazards Events: What Twitter may Contribute to Situational Awareness.” In Proceedings of the SIGCHI Conference on Human Factors in Computing Systems, April 10–15, 2010, Atlanta, GA, USA, 1079–1088. New York, NY: ACM.
- Wang, H., B. Raj, and E. P. Xing. 2017. On the origin of deep learning. arXiv preprint arXiv:1702.07800.
- Yu, L., K. M. Hermann, P. Blunsom, and S. Pulman. 2014. Deep learning for answer sentence selection. arXiv preprint arXiv:1412.1632.
- Zhang, X., and Y. LeCun. 2015. Text understanding from scratch. arXiv preprint arXiv:1502.01710.
- Zhang, X., J. Zhao, and Y. LeCun. 2015. “Character-level Convolutional Networks for Text Classification.” In Advances in Neural Information Processing Systems, December 7–12, 2015, Montréal, Canada, 649–657. Red Hook, NY: Curran Associates, Inc.