
 ?Mathematical formulae have been encoded as MathML and are displayed in this HTML version using MathJax in order to improve their display. Uncheck the box to turn MathJax off. This feature requires Javascript. Click on a formula to zoom.
ABSTRACT
Many factors are involved in urban heat island development, such as lack of green spaces, improper choice of building materials, densification, and other human activities. The aim of this research was to quantify the effects of land-use/land-cover (LU/LC) changes on urban land surface temperature (LST) during a 25-year period (1993–2018) for the semiarid Shiraz City in southern Iran using Landsat data (TM, ETM+, and OLI/TIRS) and machine learning algorithms. Five main LU/LC classes, such as orchard, vegetation, bare surface, asphalt cover, and built-up areas, were identified using a support vector machine algorithm. Landsat images were used to retrieve normalized difference vegetation index (NDVI) and normalized difference built-up index (NDBI). The results showed that the mean LST over the entire study domain increased considerably between 1993 and 2018, due to urbanization, decrease of green areas, and increasing industrial areas. Built-up areas increased considerably by 25.8% from 80 to 100.6 km2 between 1993 and 2018, while vegetation cover decreased dramatically by 69.3%. Mean LST increased from 38.4 to 40.2°C during the 25-year period with a significant increase of 3.9°C between 2013 and 2018. In addition, the Urban heat island Ratio Index (URI) displayed a substantial upward trend during the 25-year period.
1. Introduction
The global urban population represented 54.5% in 2016 (Rousta et al. Citation2018). It is expected that 2/3 of the global population will be concentrated on urban areas by the mid-twentieth century (Jaber Citation2018; Hosseini, Pourahmad, and Pajoohan Citation2016). This means that 2/3 of the global population will not only experience increased temperature from global warming but also increased temperature due to Urban Heat Island (UHI) effects. In this regard, land-use and land-cover (LU/LC) changes are two main factors for urban planning, environmental monitoring, and land management (Chaudhuri and Mishra Citation2016).
One of the main environmental consequences of urbanization is the UHI effect, a phenomenon that significantly increases the temperature in urban areas as compared to surrounding rural areas (Ranagalage, Estoque, Handayani et al. Citation2018; Wang, Derdouri, and Murayama Citation2018). Some of the negative impacts of the UHI include increased energy consumption, air pollutant emissions, and greenhouse gases causing negative environmental effects for human health and comfortability (Simwanda et al. Citation2019).
The effects of UHI are probably more significant for arid and semiarid regions. These regions are already experiencing extreme summer temperatures combined with the absence of rainfall that could clean the air and reduce the temperature. Iran is a typical country in this respect with fast urbanization. The largest city in southern Iran is Shiraz with an increasing population and densification of the urban area as well as the growing industry. The growing urban areas and UHI effects are deemed to lead to negative consequences for the inhabitants.
In general, UHI can be divided into atmospheric and surface UHIs. The atmospheric UHI is calculated based on air temperature while the surface UHI is calculated based on land surface temperature (LST) (Mathew, Khandelwal, and Kaul Citation2016; Ranagalage, Estoque, and Murayama Citation2017; Ranagalage, Estoque, Handayani et al. Citation2018). The main contributor to surface UHI in metropolitan cities is land surface warming due to heat exchange effects from building materials involved in the urbanization (Hansen Citation2010). The surface UHIs are as well affected by the geographical location and local weather conditions as influenced by changes in the thermal properties of the urban infrastructure (Karakuş Citation2019).
A key element in challenges associated with surface UHI is the land-use/land-cover (LU/LC) changes over a period of time (Chaudhuri and Mishra Citation2016). The LU/LC change is the interface between human activities and surrounding environment that can impact the urban climate (Silva, da Silva, and Santos Citation2018). Observations of LU/LC change at various temporal and spatial scales are important for predicting changes in the urban environment (Gashu and Gebre-Egziabher Citation2018). Generally, LU/LC change is a function of urbanization defining changes in surface use (Amiri et al. Citation2009). For instance, orchard and vegetation cover can be replaced by impervious surfaces and buildings. This may lead to increased surface temperature (Steeneveld et al. Citation2014). Rise in surface temperature has the potential to expose inhabitants to heat-related stress (Guha et al. Citation2018; Guha Citation2017; Mushore et al. Citation2017).
To quantify surface UHI and LU/LC changes, the use of geographical information systems (GIS) and remote sensing (RS) techniques is becoming increasingly crucial. These techniques are economical to monitor magnitude and, spatial and temporal variation of UHI (Karakuş Citation2019). The most common indices to estimate the spatial and temporal variation of LST are the normalized difference vegetation index (NDVI) and the normalized difference built-up index (NDBI), which are derived from remote sensing data (Kumar and Shekhar Citation2015). Both of these are used as indicators of LU/LC changes (Yuan and Bauer Citation2007).
Many studies have investigated relationships between LU/LC and LST using RS imagery and GIS at regional and global scales (Bokaie et al. Citation2016; Chen et al. Citation2017; Dissanayake et al. Citation2019; Sultana and Satyanarayana Citation2020). However, very few studies have focused on arid and semiarid urban regions where extreme surface UHIs may be expected. Shiraz city, which is one of the biggest cities of Iran, is located in the arid and semiarid area and under the pressure of rapid urbanization and population increase. As Shiraz has developed rapidly, impermeable surfaces have continuously replaced the green area. Impermeable surfaces for living, industrial, and commercial uses, produce a high amount of heat especially in the newly developed districts in the city center. To efficiently reduce UHI in Shiraz, it is necessary to investigate the LU/LC changes and their impacts on LST. Hence, the main objective of the current study was to investigate the relationships between LU/LC changes with surface UHI using RS and GIS techniques. To enhance our analysis, the Gram-Schmidt method was used to increase the resolution of Landsat data (from 30*30 cell size to 15*15) that, in turn, enhances the accuracy of the LU/LC classification. Mean LST of each LU/LC class was extracted to assess the distributed LST changes. The urban heat island ratio index (URI) was used to compare the UHIs intensity for the study period (1993–2018). The analysis provides a framework to investigate the impact of urbanization on surface UHI. The results are useful for urban planners and decision makers to manage the negative temperature effects of urbanization in semiarid regions.
2. Materials and methods
2.1. Study area
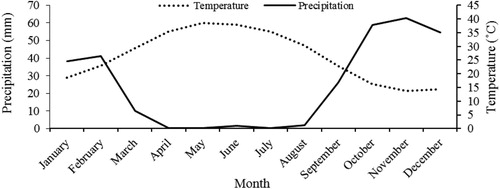
Shiraz is the fifth most populous city in Iran and the capital of Fars Province with over 1.5 million inhabitants. It is located in southern Iran with an area of 145 km2 between longitude 52° 25′ 45″ and 52° 37′ 60″ E and latitude 29° 32′ 16″ and 29° 42′ 42″ N (). It is known as one of the Iranian cities with the fastest-growing urban population (Sabet Sarvestani, Ibrahim, and Kanaroglou Citation2011). The average surface elevation of the city is about 1500 m above mean sea level. Shiraz is divided into eight districts with different management. The city includes large industrial areas as well as tourist and historical attractions. The annual mean temperature is 23.3°C and mean annual precipitation is about 300 mm. The climate characteristic of the study is shown in (1993–2018). The figure shows that the dry period spans from April to August and most of the rain (255.8 mm; 81%) falls from October to February.
Figure 1. Location of Shiraz City in Fars Province, Iran.
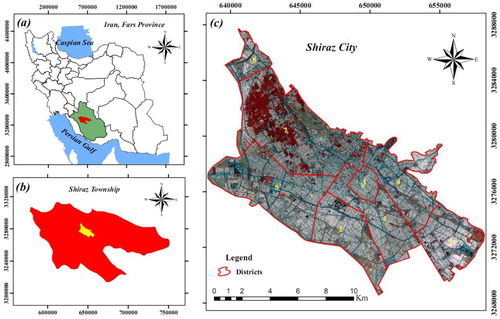
Figure 2. Ambrothermic graph of Shiraz City for the 25-year study period.
2.2. Data availability and pre-processing
To estimate the surface UHI influenced by urbanization, four satellite images of Landsat TM/ETM+ (thermal band 6) and Landsat 8 TIRS (thermal band 10) for 1993, 2003, 2013, and 2018 (May–June period) were acquired from the United States Geological Survey (USGS) (). We focused on daytime images since these are the only available data. The time steps were selected to investigate the LU/LC changes and their impact on UHI over a 25-year period. The QUick Atmospheric Correction module (QUAC) was used to calculate atmospheric correction using the ENVI 5.3 software as a pre-processing step. Multispectral band data for all images were converted into surface reflectance (0–1), while thermal band data were converted into at-sensor brightness temperature, expressed in degrees Celsius.
Table 1. Details of the Landsat images used in this study.
2.3. Land-use/land-cover classification and accuracy assessment
To increase the resolution of the multispectral bands in the Landsat images (ETM+/OLI) from 30 to 15 m resolution, the Gram-Schmidt method was used for pan-sharpening in ENVI 5.3. This was done to increase the lower spatial resolution of the multispectral Landsat imagery based on a higher resolution of panchromatic imagery. To detect and classify the LU/LC changes during the study periods (1993, 2003, 2013, and 2018), multispectral bands of TM/ETM+/OLI images and a support vector machine algorithm (supervised classification) were used (Dissanayake et al. Citation2019). Shiraz City was categorized into five major LU/LC classes encompassing orchard area, vegetation, bare surface, asphalt cover, and built-up area (). Orchard area is defined as tree cover such as pomegranate, pine, etc. while vegetation-covered area is defined as farming land and grass-covered areas. The accuracy of LU/LC classification was evaluated by selecting more than 300 checkpoints (random sampling) on the ground for each LU/LC class compared with the corresponding grid in the satellite images using the overall accuracy, kappa coefficient, user accuracy, and producer accuracy indices. These indices are commonly used for quantitative assessment of the accuracy of LU/LC classification (Sultana and Satyanarayana Citation2020; Dissanayake et al. Citation2019).
Table 2. Definition of land-use/land-cover (LU/LC) classes in Shiraz.
2.4. Retrieval of land surface temperature
To estimate LST, raw thermal band data (band 6 in Landsat 5 (TM) and Landsat 7 (ETM+), and band 10 in Landsat 8 (TIRS)) were converted into spectral radiance using (Shirani-bidabadi et al. Citation2019; Karakuş Citation2019):(1)
(1) where Lϕ is the top of atmospheric spectral radiance W/(m2·sr·μm), ML is the band-specific multiplicative rescaling factor from the metadata, QCal is quantized and calibrated standard product pixel values (DN), and AL is the band-specific additive rescaling factor from the metadata.
In the next step, the at-sensor (brightness) temperature was evaluated by Bokaie et al. (Citation2016, Citation2019), El-Hattab, Amany, and Lamia (Citation2018) and Nurwanda and Honjo (Citation2020):(2)
(2) where TB is the brightness temperature, and K1 and K2 are the thermal conversion constants from the metadata presented in .
To calculate the LST, we firstly evaluated the land surface emissivity (ε) according to Dissanayake et al. (Citation2019) and Simwanda et al. (Citation2019):(3)
(3) where ε is the land surface emissivity, n = 0.004, m = 0.986, and PV is the proportion of vegetation (Sultana and Satyanarayana Citation2020; Shirani-bidabadi et al. Citation2019):
(4)
(4)
NDVI is one of the major indicators to quantify vegetation cover. The range of NDVI is between −1 and +1, where small positive values indicate built-up or bare land, large positive values indicate vegetation (Yuan and Bauer Citation2007), and negative values denote non-vegetated surfaces and water (Silleos et al. Citation2006). NDVI was calculated from the red and near-infrared bands:(5)
(5) where NIR refers to surface reflectance of band 4 (Landsat 5 TM) and band 5 (Landsat 8), and Red refers to surface reflectance of band 3 (Landsat 5 TM) and band 4 (Landsat 8).
Finally, LST in °C was estimated by Sultana and Satyanarayana (Citation2020):(6)
(6) where λ is the wave length of emitted radiance (λ = 11.5 μm for Landsat TM and ETM+ band 6, and λ = 10.8 μm for Landsat OLI band 10), ρ = h × c/σ (1.438 × 10⁻² m K), h = Planck’s constant (6.626 × 10⁻³⁴ Js), c = velocity of light (2.998 × 10⁸ m/s), and σ = Boltzmann constant (1.38 × 10⁻²³ J/K).
2.5. Retrieval of normalized difference built-up index (NDBI)
The NDBI is an index for quantifying built-up areas and impervious surfaces, which were derived from Landsat satellite images using reflectance in the NIR and mid-infrared (MIR) bands (Faqe Ibrahim Citation2017; Ranagalage, Estoque, and Murayama Citation2017). The NDBI was calculated using:(7)
(7) where MIR = band 5 (for Landsat 5 TM and 7 ETM+) and band 6 (for Landsat 8 OLI), and NIR = band 4 (for Landsat 5 TM and7 ETM+) and band 5 (for Landsat 8 OLI).
2.6. Change detection of LST and land-use/land-cover
The primary goal of this study was to determine changes of LU/LC and their impacts on the UHI. To retrieve LU/LC and LST changes, the phase shift of a given pixel over the time was compared using cross-tabulation through gain and loss analysis (Pal and Ziaul Citation2017).
2.7. Retrieval of urban heat island ratio index
Spatiotemporal variation of UHI was evaluated by calculating LST during the 25-year study period. For this, the LST data at different time steps (1993, 2003, 2013, and 2018) were normalized (Shirani-bidabadi et al. Citation2019; Xu and Chen Citation2004):(8)
(8) where NLSTi is the normalized pixel value, LSTi is the LST value of pixel i, and LSTminimum and LSTmaximum are the minimum and maximum LST value of each time step, respectively. The normalized LSTs were then classified using mean standard deviation into five thermodynamic levels including low, sub-medium, medium, sub-high, and high ().
Table 3. Normalized LST classification using mean standard deviation.
Thus, the distribution of LST classes for Shiraz City was established and the area within each class was determined according to . Finally, the URI was calculated to assess the contribution of urbanization to UHI by Qiao et al. (Citation2014), Shirani-bidabadi et al. (Citation2019) and Xu and Chen (Citation2004):(9)
(9) where m is the number of normalized LST classes, i is the class of temperature higher than medium, n is the number of LST levels higher than the medium class, wi is the weighted value using the sub-high and high classes, and p is the per cent of i.
3. Results and discussion
This section focuses on the effect of spatiotemporal land-use and land-cover changes on UHI following the accuracy assessment of LU/LC classification. To achieve this aim, the results are given in four main sub-sections including (і) classification of LU/LC and their spatiotemporal changes; (іі) relationship between LU/LC changes and LST; (ііі) relationship between LST and, NDVI, NDBI, and population; and (іv) calculation of UHI’s intensity over time using URI.
3.1. Accuracy assessment of LU/LC classification
As mentioned above, Shiraz City was classified into five different LU/LC categories including orchard, vegetation, bare land, asphalt surface, and built-up areas at four different time periods using the support vector machine algorithm (1993, 2003, 2013, and 2018). The results of the accuracy assessment are presented in . The table shows that user and producer accuracy indices yielded more than about 90% modeling accuracy for all time periods. However, the overall accuracy index of the 4-year classification using the support vector machine algorithm was about 98%. The kappa coefficient for the four-year classification was 97, 98, 97, and 97, respectively. According to previous research, kappa coefficients greater than 0.75 indicate that classification and reference data are compatible (Nigatu, Dick, and Tveite Citation2014). According to , the overall accuracy of LU/LC classification is well preserved.
Table 4. Accuracy assessment of LU/LC classification for the studied period.
3.2. LU/LC classification and change in patterns between 1993 and 2018
shows the spatial distribution of LU/LC classification for the study area in 1993, 2003, 2013, and 2018, respectively, produced by the support vector machine algorithm. As mentioned before, the entire domain was categorized into five typical land uses. The calculated area and percentage of each land-use class are presented in , and a summary of LU/LC changes for the studied period is shown in . In , a minus (−) sign indicates that a particular land-use class decreased and a plus (+) sign indicates an increase compared to the previous time step. The results show that the built-up areas increased considerably by 24% from 80 km2 to 99.4 km2 between 1993 and 2003, while a more gradual increase was noted from 2003 to 2018 ( and ). However, the total area of bare land decreased dramatically by 64% from 35.9 to 12.9 km2 between 1993 and 2018 (), with a main change in the first time period by 44% reduction (). Moreover, the majority of bare land was converted into built-up areas and asphalt cover by 57% and 10% during the whole study period, respectively. Furthermore, the total orchard area declined slightly by 13.7% during the entire 25-year period ( and ). The vegetation cover decreased three-fold from 1993 to 2018, with a rapid change between 2013 and 2018 by nearly 54% reduction (). However, the results also show that 47% of the vegetation cover was converted into built-up areas from 1993 to 2018. Furthermore, shows that the asphalt cover steadily increased during the period of study. The total area of asphalt cover increased dramatically from 6.7 km2 in 1993 to 17.3 km2 in 2018. Generally, the outcomes of LU/LC change detection reveal that the spatial extent of the urban area of the city increased from 1993 to 2018. However, impervious surfaces such as built-up and asphalt areas expanded to the east, south, and west parts of the city. Green areas, such as orchards and vegetation cover, and bare land were converted into impervious surfaces. Hence, rapid urbanization had detrimental effects on the temperature-stabilizing areas of the city. Therefore, similar results are reported by the researchers in previous studies (Balew and Korme Citation2020; Fatemi and Narangifard Citation2019; El-Hattab, Amany, and Lamia Citation2018; Rousta et al. Citation2018).
Figure 3. Land-Use/Land-Cover classification pattern in 1993, 2003, 2013, and 2018.
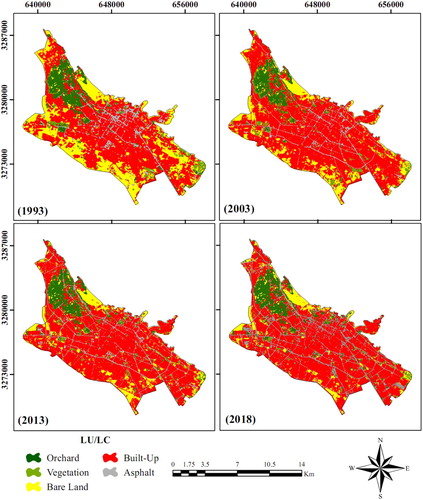
Table 5. Land-use/land-cover areas in 1993, 2003, 2013, and 2018.
Table 6. Land-use/land-cover change statistics of Shiraz City in 1993, 2003, 2013, and 2018.
3.3. Relationship between LST and LU/LC
Much research has been devoted on quantifying general relationships between LU/LC changes and surface thermal signature. The LST distribution of Shiraz for the studied period is depicted in , and the statistical measures of LST are presented in . These findings reveal that the LST changed from 26 to 51°C, 16–57°C, 27–51°C, and 31–55°C during 1993, 2003, 2013, and 2018, respectively. Besides, it can be seen that the mean LST increased from 38.4 to 40.2°C between 1993 and 2018, while in the first decade it decreased by 1.8°C (). Furthermore, the mean LST did not change significantly from 2003 to 2013. However, a significant change with 3.9°C increase occurred between 2013 and 2018. Mean LST for each LU/LC class is summarized in . The results show that the highest and lowest LST are related to the bare land and orchard classes, respectively. The surface temperature for bare land increased by 3.5°C between 1993 and 2018. Moreover, the maximum change in LST was recorded for the orchard class by an increase of 4.8°C. The LST for orchard and vegetation cover in the first decade decreased by 3.4°C and 2.5°C, respectively, while it increased dramatically by 8.2 and 7.0°C from 2003 to 2018, respectively. The LST for built-up areas increased by 4.2°C from 2013 to 2018 but a decrease by 3.4°C was observed between 1993 and 2013. In addition, surface temperature for asphalt cover increased as well especially between 2013 and 2018 by 3.6°C. In principal, the results show that the largest increase occurred during the last five years from 2013 to 2018.
Figure 4. Distribution of LST over Shiraz City in 1993, 2003, 2013, and 2018.
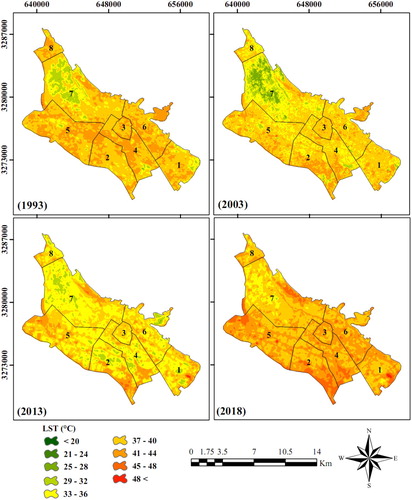
Table 7. Summary of LST (°C) for Shiraz City during May–June (1993–2018).
Table 8. Mean LST for each LU/LC class for Shiraz City (1993–2018).
Generally, the results reveal that the largest increase in LST is related to buildings and urban infrastructure development. The lowest increase in LST is related to orchard and vegetation cover. This is primarily due to high evapotranspiration from vegetation that decreases temperature (Simwanda et al. Citation2019; Priyankara et al. Citation2019; Balew and Korme Citation2020). Research has shown that green cover tends to reduce the temperature by absorption and reflection of radiation and adjustment of latent and sensible heat exchange (Yue et al. Citation2007; Lin et al. Citation2017). As well, impervious surfaces and human-made constructions play a striking role in increasing the temperature (concrete, asphalt, and metal) (Frazer Citation2005; Nakayama and Fujita Citation2010). The LST spatiotemporal variation is associated with urban expansion and the LU/LC variation, and this affects the UHI of the city (Silva, da Silva, and Santos Citation2018; Correia Filho et al. Citation2019; Balew and Korme Citation2020).
3.4. Relationship between NDVI and LST
The NDVI has been extensively used in research to measure vegetation cover. The index has also been used in many UHI studies as the cooling effect of vegetation related to latent heat vaporization and the convective cooling of tree canopies facilitate the air cooling process (Chun and Guldmann Citation2014). Accordingly, the distribution of NDVI for Shiraz City during the 25-year period is shown in , and the related statistical summary is given in . An NDVI between 0.1 and 0.75, in general, denotes vegetation cover, while NDVI more than 0.75 indicates a dense canopy cover. The NDVI for bare land and soil is close to zero, and negative values depict water surface. The calculated mean NDVI was 0.2, 0.17, 0.18, and 0.13 in 1993, 2003, 2013, and 2018, respectively. The lowest values were observed in areas that are composed of bare land and buildings. Hence, the results illustrate that most of the city is covered by impervious surfaces and buildings. Typically, it is difficult to distinguish between the NDVI of bare land relative to buildings (Varshney Citation2013; Ma et al. Citation2019; Khanal et al. Citation2019). On the other hand, the area covered by vegetation will have a lower surface temperature (LST) and higher NDVI as shown in and . Moreover, the highest NDVI was found in the northwest and southeast parts of the city, which is covered by orchard and vegetation, respectively. The results of the NDVI analysis show that this index, in general, decreased during the 25-year period that is a consequence of the LU/LC changes from green to built-up areas (e.g. Karakuş Citation2019; Bokaie et al. Citation2016; Sultana and Satyanarayana Citation2020).
Figure 5. Distribution of NDVI over Shiraz City in 1993, 2003, 2013, and 2018.
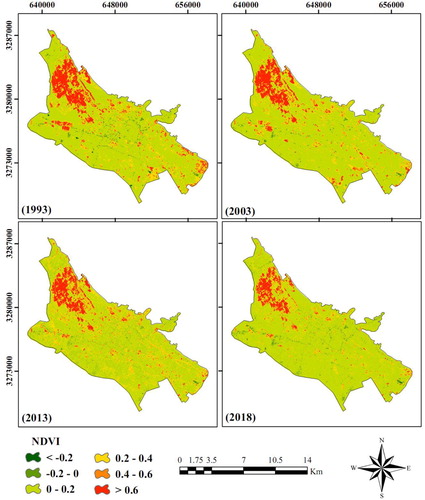
Table 9. Summary statistics for NDVI for Shiraz during the 25-year study period.
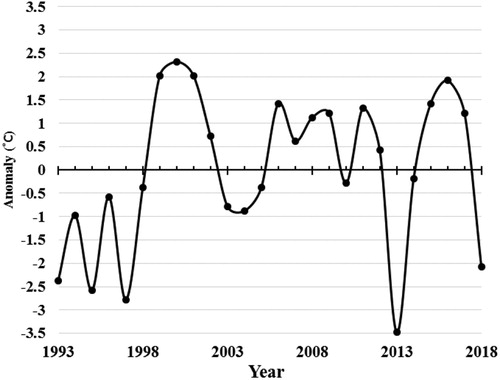
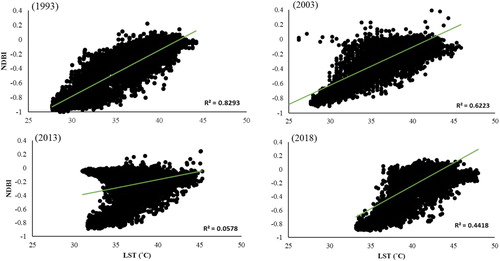
The correlation between LST and NDVI is shown in . The figure shows that there is a negative correlation between LST and NDVI for all time steps with R2 = 0.84, 0.66, 0.07, and 0.52 in 1993, 2003, 2013, and 2018, respectively. Earlier studies for cities in different countries indicate comparable. depicts the average air temperature anomaly in May for the entire study period. According to the figure, the low R2 between LST and NDVI in 2013 could be due to an unusually low temperature in this year (May) as compared to the 25-year average. However, due to the inverse correlation, it can be stated that decreasing vegetation cover results in an increased surface temperature (Alemu Citation2019; Ning, Gao, and Chen Citation2017; Deng et al. Citation2018; Balew and Korme Citation2020).
Figure 6. Correlation between LST and NDVI in 1993, 2003, 2013, and 2018.
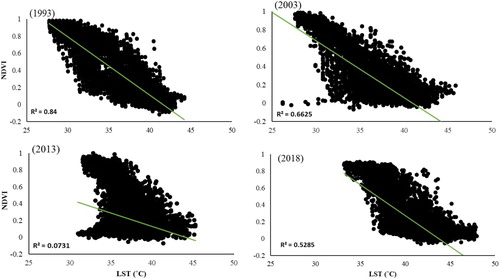
Figure 7. Temperature anomaly for the 25-year period.
3.5. Relationship between NDBI and LST
Spatiotemporal variation of NDBI for the four time steps (1993, 2003, 2013, and 2018) is shown in , and a statistical summary is given in . One of the main indicators for understanding the urban climate is NDBI (Ranagalage, Estoque, and Murayama Citation2017; Rousta et al. Citation2018; Grover and Singh Citation2016). NDBI ranges between −1 and +1, where small positive values denote bare land, large positive values built-up areas, and negative values denote vegetation cover (Ranagalage, Estoque, Zhang et al. Citation2018). Ranagalage, Estoque, Handayani et al. (Citation2018) suggested that an NDBI larger than −0.22 represents built-up areas (Ranagalage, Estoque, Handayani et al. Citation2018). Based on our calculations, mean NDBI decreased from −0.22 in 1993 to −0.26 in 2003, while it increased to −0.12 in 2018. The significant increase in NDBI is due to the reduction of bare land and lower vegetation, as well as increase in the built-up areas. The similar results are reported by the researchers working on cities of different parts of the world (Guha Citation2017; Chen and Zhang Citation2017; Correia Filho et al. Citation2019; Balew and Korme Citation2020).
Figure 8. Distribution of NDBI over Shiraz in 1993, 2003, 2013, and 2018.
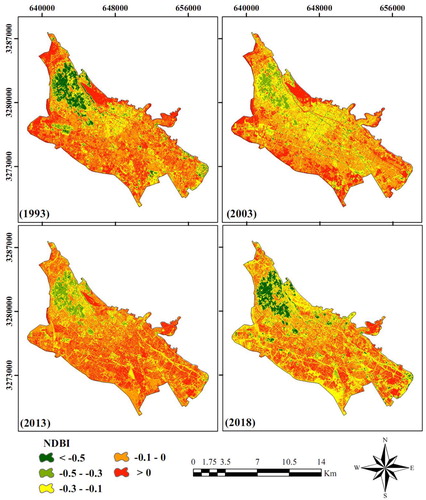
Table 10. Summary statistics of NDBI for Shiraz during the 25-year study period.
The correlation between LST and NDBI is shown in . According to the figure, there is a positive correlation between LST and NDVI for all time steps, where R2 was 0.82, 0.62, 0.05, and 0.44 in 1993, 2003, 2013, and 2018, respectively (for similar results see e.g. Balew and Korme Citation2020; Ranagalage, Estoque, and Murayama Citation2017; Faqe Ibrahim Citation2017; Rousta et al. Citation2018). The insignificant correlation between LST and NDBI in 2013 could be due to considerable lower temperature in that year relative to the long-term average. According to the positive correlation, it can be expected that the increase in built-up areas results in increased land surface temperature (Simwanda et al. Citation2019; Dissanayake et al. Citation2019; Wang, Derdouri, and Murayama Citation2018; Rousta et al. Citation2018; Ranagalage, Estoque, Zhang et al. Citation2018). It is noted that there was no positive correlation between NDVI and NDVI indices during the whole study period.
Figure 9. Correlation between LST and NDBI in 1993, 2003, 2013, and 2018.
3.6. Relationship between population increase and LST
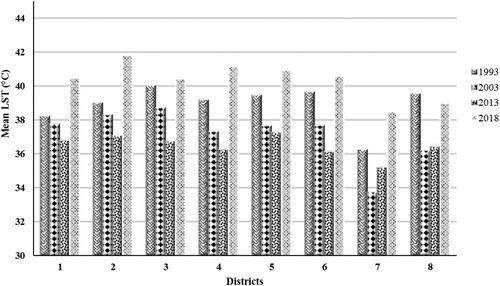
The population of Shiraz City has increased significantly during the four last decades (Sabet Sarvestani, Ibrahim, and Kanaroglou Citation2011). This growth has expanded built-up areas on the expense of bare land and green areas (Li, Zhang, and Kainz Citation2012; Sultana and Satyanarayana Citation2020; Zhou et al. Citation2014; Bokaie et al. Citation2016; Patra et al. Citation2018). However, since the population density for the entire study period was inaccessible, we used the population density of each district for Shiraz in 2016, as shown in . The figure shows that the density of population in district 7 is higher than other districts as it is the commercial center of the city. However, due to the occurrence of orchards and vegetation cover in this district, it had a lower LST than other districts for all time steps (). As can be seen from , district 3 is low-populated while the mean LST was the same as for districts 4, 5, and 6, which are located in the central parts of Shiraz. The LST increased in these districts due to extensive building activities combined with the absence of green areas (Bokaie et al. Citation2019). Population increase has caused the growth of residential structures, at the same time, more energy is trapped in building structures because of high heat capacity. This leads to the need for cooling systems that again increase the anthropogenic heat.
Figure 10. Spatial distribution of population density in Shiraz in 2016.
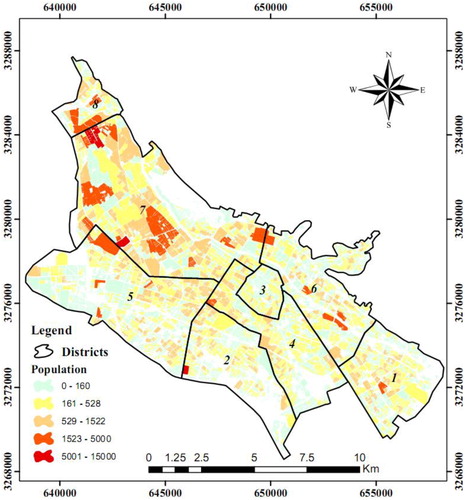
Figure 11. Mean LST for different districts of Shiraz in 1993, 2003, 2013, and 2018.
3.7. Urban heat island ratio index
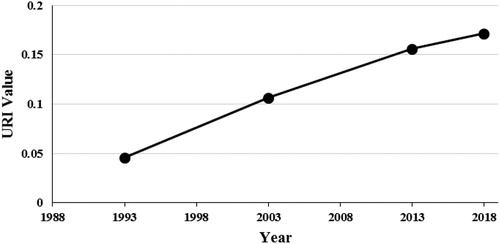
The results of normalized LST classification are shown in . The figure illustrates that the normalized LST classes higher than medium were mostly located in urban areas. This illustrates that the higher classes expanded in the urban areas through the entire study period, especially, in the southern part of Shiraz City, where the LU/LC changed from bare land to built-up areas. Furthermore, the result of urban heat island ratio index (URI) calculations is shown in . The URI graph shows that the intensity of UHI increased continuously during the entire period of study. The intensity rose dramatically from 0.045 in 1993–0.17 in 2018. This can be compared to the URI calculated by (Shirani-bidabadi et al. Citation2019) for Isfahan City in central Iran during a 17-year period. Although the trend of URI in both studies is the same, the magnitude differs. Both studies indicate that the decision makers simply ignored enhancing green spaces and other nature-based cooling measures for these two major cities in Iran.
Figure 12. Normalized LST classification for 1993, 2003, 2013, and 2018.
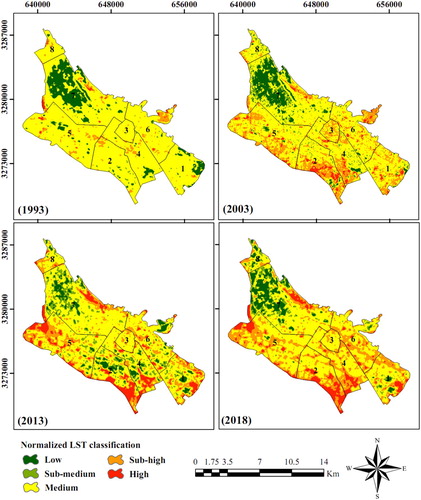
Figure 13. Urban heat island Ratio Index (URI) for 1993, 2003, 2013, and 2018.
4. Conclusions
This study analyzed the effects of LU/LC change on UHI based on LST during a 25-year period (1993–2018) for Shiraz City using Landsat data (TM, ETM+, and OLI/TIRS). The spatiotemporal pattern of LU/LC changes was quantified for four different time steps and five different LU/LC classes including orchard, vegetation, bare surface, asphalt cover, and built-up areas. To achieve the objectives, the spatiotemporal pattern of LST, NDVI, and NDBI, variation of LST following LULU types, and variation of LST within the NDVI and NDBI were examined. Moreover, URI was used to depict the variation of the intensity of UHI in the study area.
The results of LU/LC change illustrate that the built-up areas increased substantially from 80 km2 to 100.6 km2 between 1993 and 2018. The total bare land area decreased dramatically by 64% between 1993 and 2018. Thus, the major part of bare land was converted to built-up areas. Besides, the vegetation cover decreased considerably and 47% of the vegetation cover was converted to built-up areas.
According to the LST analysis, the bare land and orchards were identified as the hottest and the coolest places for all time steps, respectively. The mean LST in 2003 was 36.6°C that increased to 40.2°C in 2018. The results showed that the LST pattern changed with the LU/LC. The maximum change in LST was recorded for the orchard cover by an increase of 4.8°C between 1993 and 2018. The LST for vegetation cover increased by 4.5°C from 1993 to 2018. In addition, the LST for built-up areas increased by 4.2°C from 2013 to 2018. In principal, the results illustrate that the largest increase occurred during the last five years from 2013 to 2018.
Additionally, the results showed a significant negative correlation between mean LST and NDVI, while a positive correlation was found between mean LST and NDBI for all time steps. The results of normalized LST classification revealed that higher classes expanded in the urban areas where the LU/LC changed from bare land to built-up areas. The URI results showed that the intensity of UHI increased dramatically from 0.045 in 1993 to 0.17 in 2018. In addition, areas of high temperature increased for all time steps due to a considerable growth in population and subsequent urbanization.
In general, the results of this study indicate that different types of LU/LC have a substantial impact on temperature. Urbanization played a key role in creating an intensified UHI during the 25-year study period. The emergence and expansion of this phenomenon depend on many factors such as human activities, air pollution, LU/LC types, and weather conditions. For this, measures are needed to reduce their adverse effects on the urban environment. The most efficient measure to reduce these negative effects is green space expansion in the urban and industrial context. Promoting green roof technology with the aim of maximizing the absorption of radiation and establishing urban gardens are other ways to reverse the negative trend of UHIs.
Acknowledgements
The authors are grateful to the United States Geological Survey (USGS) team for providing the Landsat images via https://earthexplorer.usgs.gov/. We also would like to thank the Centre for Middle Eastern Studies at Lund University and Ministry of Science, Research and Technology of the Islamic Republic of Iran. The authors also thank three anonymous reviewers and the journal editor for constructive comments on the manuscript.
Disclosure statement
No potential conflict of interest was reported by the author(s).
References
- Alemu, Melkamu Meseret. 2019. “Analysis of Spatio-Temporal Land Surface Temperature and Normalized Difference Vegetation Index Changes in the Andassa Watershed, Blue Nile Basin, Ethiopia.” Journal of Resources and Ecology 10 (1): 77–85. doi:10.5814/j.issn.1674-764x.2019.01.010.
- Amiri, Reza, Qihao Weng, Abbas Alimohammadi, and Seyed Kazem Alavipanah. 2009. “Spatial–Temporal Dynamics of Land Surface Temperature in Relation to Fractional Vegetation Cover and Land Use/Cover in the Tabriz Urban Area, Iran.” Remote Sensing of Environment 113 (12): 2606–2617. doi:10.1016/j.rse.2009.07.021.
- Balew, Abel, and Tesfaye Korme. 2020. “Monitoring Land Surface Temperature in Bahir Dar City and Its Surrounding Using Landsat Images.” The Egyptian Journal of Remote Sensing and Space Science. doi:10.1016/j.ejrs.2020.02.001.
- Bokaie, Mehdi, Aliakbar Shamsipour, Padideh Khatibi, and Ali Hosseini. 2019. “Seasonal Monitoring of Urban Heat Island Using Multi-Temporal Landsat and MODIS Images in Tehran.” International Journal of Urban Sciences 23 (2): 269–285. doi:10.1080/12265934.2018.1548942.
- Bokaie, Mehdi, Mirmasoud Kheirkhah Zarkesh, Peyman Daneshkar Arasteh, and Ali Hosseini. 2016. “Assessment of Urban Heat Island Based on the Relationship Between Land Surface Temperature and Land Use/ Land Cover in Tehran.” Sustainable Cities and Society 23 (May): 94–104. doi:10.1016/j.scs.2016.03.009.
- Chaudhuri, Gargi, and Niti B. Mishra. 2016. “Spatio-Temporal Dynamics of Land Cover and Land Surface Temperature in Ganges-Brahmaputra Delta: A Comparative Analysis Between India and Bangladesh.” Applied Geography 68 (March): 68–83. doi:10.1016/j.apgeog.2016.01.002.
- Chen, Yen Ching, Hao Wei Chiu, Yuan Fong Su, Yii Chen Wu, and Ke Sheng Cheng. 2017. “Does Urbanization Increase Diurnal Land Surface Temperature Variation? Evidence and Implications.” Landscape and Urban Planning 157: 247–258. doi:10.1016/j.landurbplan.2016.06.014.
- Chen, Xu, and Yaping Zhang. 2017. “Impacts of Urban Surface Characteristics on Spatiotemporal Pattern of Land Surface Temperature in Kunming of China.” Sustainable Cities and Society 32 (July): 87–99. doi:10.1016/j.scs.2017.03.013.
- Chun, B., and J.-M. Guldmann. 2014. “Spatial Statistical Analysis and Simulation of the Urban Heat Island in High-Density Central Cities.” Landscape and Urban Planning 125 (May): 76–88. doi:10.1016/j.landurbplan.2014.01.016.
- Correia Filho, Washington Luiz Félix, Dimas de Barros Santiago, José Francisco de Oliveira-Júnior, and Carlos Antonio da Silva Junior. 2019. “Impact of Urban Decadal Advance on Land Use and Land Cover and Surface Temperature in the City of Maceió, Brazil.” Land Use Policy 87 (September): 104026. doi:10.1016/j.landusepol.2019.104026.
- Deng, Yuanhong, Shijie Wang, Xiaoyong Bai, Yichao Tian, Luhua Wu, Jianyong Xiao, Fei Chen, and Qinghuan Qian. 2018. “Relationship among Land Surface Temperature and LUCC, NDVI in Typical Karst Area.” Scientific Reports 8 (1): 641. doi:10.1038/s41598-017-19088-x.
- Dissanayake, Dmslab, Takehiro Morimoto, Manjula Ranagalage, and Yuji Murayama. 2019. “Land-Use/Land-Cover Changes and Their Impact on Surface Urban Heat Islands: Case Study of Kandy City, Sri Lanka.” Climate 7 (8): 99. doi:10.3390/cli7080099.
- El-Hattab, M., S. M. Amany, and G. E. Lamia. 2018. “Monitoring and Assessment of Urban Heat Islands Over the Southern Region of Cairo Governorate, Egypt.” The Egyptian Journal of Remote Sensing and Space Science 21 (3): 311–323. doi:10.1016/j.ejrs.2017.08.008.
- Faqe Ibrahim, Gaylan. 2017. “Urban Land Use Land Cover Changes and Their Effect on Land Surface Temperature: Case Study Using Dohuk City in the Kurdistan Region of Iraq.” Climate 5 (1): 13. doi:10.3390/cli5010013.
- Fatemi, Mehran, and Mahdi Narangifard. 2019. “Monitoring LULC Changes and Its Impact on the LST and NDVI in District 1 of Shiraz City.” Arabian Journal of Geosciences 12 (4): 127. doi:10.1007/s12517-019-4259-6.
- Frazer, Lance. 2005. “Paving Paradise: The Peril of Impervious Surfaces.” Environmental Health Perspectives 113 (7): A456–A462. doi:10.1289/ehp.113-a456.
- Gashu, Kassahun, and Tegegne Gebre-Egziabher. 2018. “Correction to: Spatiotemporal Trends of Urban Land Use/Land Cover and Green Infrastructure Change in Two Ethiopian Cities: Bahir Dar and Hawassa.” Environmental Systems Research 7 (1): 11. doi:10.1186/s40068-018-0114-0.
- Grover, Aakriti, and R. B. Singh. 2016. “Monitoring Spatial Patterns of Land Surface Temperature and Urban Heat Island for Sustainable Megacity.” Environment and Urbanization ASIA 7 (1): 38–54. doi:10.1177/0975425315619722.
- Guha, Subhanil. 2017. “Dynamic Analysis and Ecological Evaluation of Urban Heat Islands in Raipur City, India.” Journal of Applied Remote Sensing 11 (03): 1. doi:10.1117/1.JRS.11.036020.
- Guha, Subhanil, Himanshu Govil, Anindita Dey, and Neetu Gill. 2018. “Analytical Study of Land Surface Temperature with NDVI and NDBI Using Landsat 8 OLI and TIRS Data in Florence and Naples City, Italy.” European Journal of Remote Sensing 51 (1): 667–678. doi:10.1080/22797254.2018.1474494.
- Hansen, Henning Sten. 2010. “Modelling the Future Coastal Zone Urban Development as Implied by the IPCC SRES and Assessing the Impact From Sea Level Rise.” Landscape and Urban Planning 98 (3–4): 141–149. doi:10.1016/j.landurbplan.2010.08.018.
- Hosseini, Ali, Ahmad Pourahmad, and Musa Pajoohan. 2016. “Assessment of Institutions in Sustainable Urban-Management Effects on Sustainable Development of Tehran: Learning From a Developing Country.” Journal of Urban Planning and Development 142 (2): 05015009. doi:10.1061/(ASCE)UP.1943-5444.0000301.
- Jaber, Salahuddin M. 2018. “Landsat-Based Vegetation Abundance and Surface Temperature for Surface Urban Heat Island Studies: The Tale of Greater Amman Municipality.” Annals of GIS 24 (3): 195–208. doi:10.1080/19475683.2018.1471519.
- Karakuş, Can Bülent. 2019. “The Impact of Land Use/Land Cover (LULC) Changes on Land Surface Temperature in Sivas City Center and Its Surroundings and Assessment of Urban Heat Island.” Asia-Pacific Journal of Atmospheric Sciences 55 (4): 669–684. doi:10.1007/s13143-019-00109-w.
- Khanal, Nishanta, Kabir Uddin, Mir Matin, and Karis Tenneson. 2019. “Automatic Detection of Spatiotemporal Urban Expansion Patterns by Fusing OSM and Landsat Data in Kathmandu.” Remote Sensing 11 (19): 2296. doi:10.3390/rs11192296.
- Kumar, Deepak, and Sulochana Shekhar. 2015. “Statistical Analysis of Land Surface Temperature–Vegetation Indexes Relationship Through Thermal Remote Sensing.” Ecotoxicology and Environmental Safety 121 (November): 39–44. doi:10.1016/j.ecoenv.2015.07.004.
- Li, Ying-ying, Hao Zhang, and Wolfgang Kainz. 2012. “Monitoring Patterns of Urban Heat Islands of the Fast-Growing Shanghai Metropolis, China: Using Time-Series of Landsat TM/ETM+ Data.” International Journal of Applied Earth Observation and Geoinformation 19 (October): 127–138. doi:10.1016/j.jag.2012.05.001.
- Lin, Pingying, Zhonghua Gou, Stephen Lau, and Hao Qin. 2017. “The Impact of Urban Design Descriptors on Outdoor Thermal Environment: A Literature Review.” Energies 10 (12): 2151. doi:10.3390/en10122151.
- Ma, Xiaolong, Chengming Li, Xiaohua Tong, and Sicong Liu. 2019. “A New Fusion Approach for Extracting Urban Built-up Areas From Multisource Remotely Sensed Data.” Remote Sensing 11 (21): 2516. doi:10.3390/rs11212516.
- Mathew, Aneesh, Sumit Khandelwal, and Nivedita Kaul. 2016. “Spatial and Temporal Variations of Urban Heat Island Effect and the Effect of Percentage Impervious Surface Area and Elevation on Land Surface Temperature: Study of Chandigarh City, India.” Sustainable Cities and Society 26 (October): 264–277. doi:10.1016/j.scs.2016.06.018.
- Mushore, Terence Darlington, John Odindi, Timothy Dube, Trylee Nyasha Matongera, and Onisimo Mutanga. 2017. “Remote Sensing Applications in Monitoring Urban Growth Impacts on In-and-out Door Thermal Conditions: A Review.” Remote Sensing Applications: Society and Environment 8 (November): 83–93. doi:10.1016/j.rsase.2017.08.001.
- Nakayama, Tadanobu, and Tsuyoshi Fujita. 2010. “Cooling Effect of Water-Holding Pavements Made of New Materials on Water and Heat Budgets in Urban Areas.” Landscape and Urban Planning 96 (2): 57–67. doi:10.1016/j.landurbplan.2010.02.003.
- Nigatu, Wondrade, Øystein B. Dick, and Havard Tveite. 2014. “GIS Based Mapping of Land Cover Changes Utilizing Multi-Temporal Remotely Sensed Image Data in Lake Hawassa Watershed, Ethiopia.” Environmental Monitoring and Assessment 186 (3): 1765–1780. doi:10.1007/s10661-013-3491-x.
- Ning, Jicai, Zhiqiang Gao, and Maosi Chen. 2017. “Analysis of Relationships Between NDVI and Land Surface Temperature in Coastal Area.” In Remote Sensing and Modeling of Ecosystems for Sustainability XIV, edited by Wei Gao, Ni-Bin Chang, and Jinnian Wang, 18. SPIE. doi:10.1117/12.2271589.
- Nurwanda, Atik, and Tsuyoshi Honjo. 2020. “The Prediction of City Expansion and Land Surface Temperature in Bogor City, Indonesia.” Sustainable Cities and Society 52 (January): 101772. doi:10.1016/j.scs.2019.101772.
- Pal, Swades, and Sk Ziaul. 2017. “Detection of Land Use and Land Cover Change and Land Surface Temperature in English Bazar Urban Centre.” The Egyptian Journal of Remote Sensing and Space Science 20 (1): 125–145. doi:10.1016/j.ejrs.2016.11.003.
- Patra, Suman, Satiprasad Sahoo, Pulak Mishra, and Subhash Chandra Mahapatra. 2018. “Impacts of Urbanization on Land Use /Cover Changes and Its Probable Implications on Local Climate and Groundwater Level.” Journal of Urban Management 7 (2): 70–84. doi:10.1016/j.jum.2018.04.006.
- Priyankara, Prabath, Manjula Ranagalage, D. M. S. L. B. Dissanayake, Takehiro Morimoto, and Yuji Murayama. 2019. “Spatial Process of Surface Urban Heat Island in Rapidly Growing Seoul Metropolitan Area for Sustainable Urban Planning Using Landsat Data (1996–2017).” Climate 7 (9): 110. doi:10.3390/cli7090110.
- Qiao, Zhi, Guangjin Tian, Lixiao Zhang, and Xinliang Xu. 2014. “Influences of Urban Expansion on Urban Heat Island in Beijing During 1989–2010.” Advances in Meteorology 2014: 1–11. doi:10.1155/2014/187169.
- Ranagalage, Manjula, Ronald Estoque, Hepi Handayani, Xinmin Zhang, Takehiro Morimoto, Takeo Tadono, and Yuji Murayama. 2018. “Relation Between Urban Volume and Land Surface Temperature: A Comparative Study of Planned and Traditional Cities in Japan.” Sustainability 10 (7): 2366. doi:10.3390/su10072366.
- Ranagalage, Manjula, Ronald C Estoque, and Yuji Murayama. 2017. “An Urban Heat Island Study of the Colombo Metropolitan Area, Sri Lanka, Based on Landsat Data (1997–2017).” ISPRS International Journal of Geo-Information 6 (7): 189. doi:10.3390/ijgi6070189.
- Ranagalage, Manjula, Ronald Estoque, Xinmin Zhang, and Yuji Murayama. 2018. “Spatial Changes of Urban Heat Island Formation in the Colombo District, Sri Lanka: Implications for Sustainability Planning.” Sustainability 10 (5): 1367. doi:10.3390/su10051367.
- Rousta, Iman, Md Sarif, Rajan Gupta, Haraldur Olafsson, Manjula Ranagalage, Yuji Murayama, Hao Zhang, and Terence Mushore. 2018. “Spatiotemporal Analysis of Land Use/Land Cover and Its Effects on Surface Urban Heat Island Using Landsat Data: A Case Study of Metropolitan City Tehran (1988–2018).” Sustainability 10 (12): 4433. doi:10.3390/su10124433.
- Sabet Sarvestani, Mahdi, Ab Latif Ibrahim, and Pavlos Kanaroglou. 2011. “Three Decades of Urban Growth in the City of Shiraz, Iran: A Remote Sensing and Geographic Information Systems Application.” Cities 28 (4): 320–329. doi:10.1016/j.cities.2011.03.002.
- Shirani-bidabadi, Niloufar, Touraj Nasrabadi, Shahrzad Faryadi, Adnan Larijani, and Majid Shadman Roodposhti. 2019. “Evaluating the Spatial Distribution and the Intensity of Urban Heat Island Using Remote Sensing, Case Study of Isfahan City in Iran.” Sustainable Cities and Society 45 (February): 686–692. doi:10.1016/j.scs.2018.12.005.
- Silleos, Nikolaos G., Thomas K. Alexandridis, Ioannis Z. Gitas, and Konstantinos Perakis. 2006. “Vegetation Indices: Advances Made in Biomass Estimation and Vegetation Monitoring in the Last 30 Years.” Geocarto International 21 (4): 21–28. doi:10.1080/10106040608542399.
- Silva, Janilci Serra, Richarde Marques da Silva, and Celso Augusto Guimarães Santos. 2018. “Spatiotemporal Impact of Land Use/Land Cover Changes on Urban Heat Islands: A Case Study of Paço Do Lumiar, Brazil.” Building and Environment 136 (May): 279–292. doi:10.1016/j.buildenv.2018.03.041.
- Simwanda, Matamyo, Manjula Ranagalage, Ronald C Estoque, and Yuji Murayama. 2019. “Spatial Analysis of Surface Urban Heat Islands in Four Rapidly Growing African Cities.” Remote Sensing 11 (14): 1645. doi:10.3390/rs11141645.
- Steeneveld, G. J., S. Koopmans, B. G. Heusinkveld, and N. E. Theeuwes. 2014. “Refreshing the Role of Open Water Surfaces on Mitigating the Maximum Urban Heat Island Effect.” Landscape and Urban Planning 121 (January): 92–96. doi:10.1016/j.landurbplan.2013.09.001.
- Sultana, Sabiha, and A. N. V. Satyanarayana. 2020. “Assessment of Urbanisation and Urban Heat Island Intensities Using Landsat Imageries During 2000–2018 Over a Sub-Tropical Indian City.” Sustainable Cities and Society 52 (January): 101846. doi:10.1016/j.scs.2019.101846.
- Varshney, Avnish. 2013. “Improved NDBI Differencing Algorithm for Built-up Regions Change Detection From Remote-Sensing Data: An Automated Approach.” Remote Sensing Letters 4 (5): 504–512. doi:10.1080/2150704X.2013.763297.
- Wang, Ruci, Ahmed Derdouri, and Yuji Murayama. 2018. “Spatiotemporal Simulation of Future Land Use/Cover Change Scenarios in the Tokyo Metropolitan Area.” Sustainability 10 (6): 2056. doi:10.3390/su10062056.
- Xu, Han Qiu, and Ben Qing Chen. 2004. “Remote Sensing of the Urban Heat Island and Its Changes in Xiamen City of SE China.” Journal of Environmental Sciences 16 (2): 276–281.
- Yuan, Fei, and Marvin E Bauer. 2007. “Comparison of Impervious Surface Area and Normalized Difference Vegetation Index as Indicators of Surface Urban Heat Island Effects in Landsat Imagery.” Remote Sensing of Environment 106 (3): 375–386. doi:10.1016/j.rse.2006.09.003.
- Yue, W., J. Xu, W. Tan, and L. Xu. 2007. “The Relationship Between Land Surface Temperature and NDVI with Remote Sensing: Application to Shanghai Landsat 7 ETM+ Data.” International Journal of Remote Sensing 28 (15): 3205–3226. doi:10.1080/01431160500306906.
- Zhou, Yi, Guang Yang, Shixin Wang, Litao Wang, Futao Wang, and Xiongfei Liu. 2014. “A New Index for Mapping Built-up and Bare Land Areas From Landsat-8 OLI Data.” Remote Sensing Letters 5 (10): 862–871. doi:10.1080/2150704X.2014.973996.