
ABSTRACT
This paper discusses the possibility to use mobile phone network data to monitor spatial policies in land use and transport planning. Monitoring requires robust time series and reproducible concepts linking spatial policies to monitoring outcomes, a requirement differing from current literature where mobile phone data analysis is exemplified in selected areas with privileged data access. Concepts need to serve the evaluation of policy objectives, for example in regional or local area plans. In this study, we, therefore, extend the application of mobile phone network data to monitoring applications comparing urban settlement types and their characteristic mobility patterns. To accomplish this, we link mobile phone records with urban classifications and transport network data, using both visual and computational approaches to mine the data. The article presents comparisons of travel patterns for selected monocentric and polycentric city regions in Germany, testing hypotheses of transit-oriented regional development, as well as testing for congestion risks in the transport network. The results help us to gain a more detailed understanding of spatial and temporal patterns in mobility for different urban types and assess future potentials for monitoring spatial policies with mobile phone network data.
1. Introduction: mobile phone network data and big data analytics
The advent of the mobile phone has revolutionized many aspects of modern life in an unprecedented way. In Germany, the number of registered mobile phone numbers has increased from just under one million in 1992 to almost 137 million in 2018 (Statista Citation2020). This means that in a country of over 83 million people most people have at least one mobile phone at their disposal, with the vast majority likely to carry it with them for most of the day. The idea to use phone location data for monitoring purposes is not new. Scholars and engineers in the automotive sector have conducted so-called mobile phone travel surveys for quite some time. Initially, such studies focused on enhancing in-car navigation devices with real-time traffic data. Nowadays, real-time traffic information is used in many advanced routing and navigation applications on a range of devices. Other disciplines have picked up on these new possibilities to learn more about individual travel behaviour. For instance, spatial planners now conduct travel surveys for all transport modes, including public transport and active forms of mobility (walking, cycling). However, there are two main requirements needing to be met for the data to be used efficiently: (1) data can only be used if it conforms to data protection laws, i.e. it must be anonymized and aggregated to numbers so that no personal information can be revealed, (2) the amount of data to be processable in a cost-efficient manner by the hardware and software available. These requirements have been significant obstacles in the past. To date, only early adopters of new technologies are experimenting with these new datasets in areas with privileged data access. Area-wide spatial monitoring concepts have not yet taken up the possibilities deriving from mobile phone network data to track fulfilment of spatial policy objectives. In the case of Germany, studies mostly rely on the analysis of archived land use statistics, topographic geodata and mobility surveys (Nobis and Kuhnimhof Citation2018). These are usually some three years old before they can be made available in combination. Analysis options are subject to limitations that come along with the data. Examples are inconsistent land use classifications over time, limited or non-matching spatial resolutions, or missing information on commuters not belonging to the state social security system that the statistics cover (e.g. self-employed people, government employees, Friedrich et al. Citation2017). Such shortcomings can now be overcome through the use of more up-to-date mobile phone network data. With legal questions relating to data protection now resolved, concepts integrating mobile phone network data for long-term monitoring purposes are now feasible.
Against this background, we demonstrate in this article how mobile phone network data can enhance analytical applications for monitoring spatial policies related to land use and transport planning in Germany. Based on the available body of literature, we identify opportunities and challenges for the use of such data encountered by other researchers. This knowledge is then used to develop concepts for a longitudinal analysis of the whole country.
The concepts serve to evaluate fulfilment of policy objectives in existing set-ups and are therefore framed by software and manpower capacities typically available to spatial planning authorities. The mobile phone network dataset was extracted from the German database of Telefónica, one of the leading integrated telecommunications providers in Germany. The sample of Telefónica users is large enough to provide robust estimates for all transport users based on extrapolation algorithms (Telefónica NEXT Citation2018). The aggregated data covered all origins and destinations among Germany’s 8230 household postcodes. The resulting matrix was segmented for each hour of the day, giving the trip start and end time and its origin and destination postcode. The transport mode was not available in the dataset so that data records could not be attributed to driving, walking, cycling, or public transport usage. Nevertheless, the dataset for a typical one-week period in March 2017 was useful for developing and testing the spatial monitoring concepts reported in this paper.
Following a literature review, we explain how we analysed the data using free and commercial software, how we added spatial knowledge by classifying postcodes by spatial type, and carried out analyses using data exploration tools (for example, R Shiny) and GIS-based visualization techniques. Finally, we discuss the usability of such analysis routines for planning practice in a concluding section.
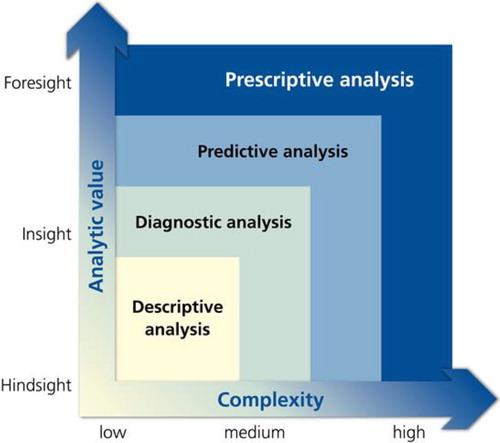
In order to systematically interpret analysis potentials, this paper leans on the classification of big data analytics according to Erl, Khattak, and Buhler (Citation2016) for its structure.
Their approach covers four levels of analysis, as presented in , with increasing complexity but also increasing analytic value from the bottom to the top: Accordingly, while descriptive analysis approaches are of low complexity, their analytic value helps understand processes that happened in the past. Diagnostic and predictive analyses are of medium complexity, providing further analytical insight into current processes based on trends of the past. Erl, Khattak, and Buhler (Citation2016) cite as typical use cases the descriptive visualization of mobile phone users, the analysis of air pollution in a comparison between stop-and-go and free-flow traffic (diagnostic), or forecasts on future air pollution in smart traffic management (predictive). At the top (with a grey background since we do not cover such analysis in this paper), prescriptive analysis is of high complexity but helps to model and predict processes for the future (‘foresight’) and is therefore of the highest analytical value. One example would be smart in-car navigation that avoids routes with high levels of air pollution.
Figure 1. Levels of big data analytics (adapted from Erl, Khattak, and Buhler Citation2016).
Using this line of thinking, the following sections present potential spatial and urban planning applications based on mobile phone network data.
2. Background: monitoring mobility patterns
In order to plan transport infrastructure, planners require not only supply information on physical transport networks, their capacities and usage patterns, but also demand information in terms of the mobility requirements of local populations and economies. The collection and management of such information have evolved over the last decades: once the sole domain of transport engineering and planning disciplines, a more interdisciplinary approach is now used, encompassing spatial planning disciplines and the social sciences. In this context, the paradigm of sustainable transport planning has led to a focus on travel behaviour studies. Planning practice now combines new insights into mobility requirements with strategies of travel demand management. In order to support such an enhanced perspective on sustainable transport, modern information systems need to integrate data on a range of topics, for example, land use, transport infrastructure, population statistics and projections. In the past, such information was collected from a variety of sources, sometimes involving cost-intensive and time-consuming manual labour (e.g. traffic counts, household surveys, service level assessments).
The so-called datafication of society sees new data-driven applications generating a wealth of new information (Big Data) on a range of topics. In our case, this data can be mined in terms of its usability for the aforementioned transport planning purposes (Kitchin Citation2014). The expectation is that such new data can reduce or eliminate the need to conduct costly and time-intensive travel surveys. An important question is whether information previously collected manually can be replaced by automatically generated data at the same or even higher frequency, quality and depth of information, for instance, mobile phone network data. This would allow the geographical scope of transport planning studies to be greatly expanded, removing the past limitations of scope in transport analysis and related monitoring activities due to the cost and time required for data collection.
Using vehicles and persons as mobile sensors and data collectors opens up new possibilities in spatial analysis and traffic control. Examples are assessments of transport network performance, strategic recommendations for a modified infrastructure, or the compilation of an origin-destination matrix for traffic demand modelling. In addition, high political and social expectations are placed on innovative technologies and their possible positive effects on the future design of cities and mobility systems. Authors like Wang, He and Zung have provided a literature overview in this context, looking at how mobile phone network data can be used in travel behaviour research (Wang, He, and Leung Citation2018). They identify three types of applications where such data has shown promising analytical potential: the identification of travel patterns, the exploration of influencing factors, and the modelling and prediction of travel behaviour (Wang, He, and Leung Citation2018, 2). Other authors agree that the use of such data is a proven alternative to conventional travel surveys, censuses or other existing data collection techniques (De Meersman et al. Citation2016). Mobile phone records provide a sufficiently large sample size. The rapid increase in mobile phone usage has made mobile phone data relatively easy to collect and to frequently update. The scope of its usage varies. In particular, it is being extensively used to monitor urban mobility in relation to origins and destinations in a study area. For example, spatial structure and commuting dynamics have been studied on the basis of hotspot clustering derived from mobile phone network data (Louail et al. Citation2014). One article authored by Yang et al. (Citation2018) proposes a workflow for characterizing communities according to commuting patterns using mobile phone location data collected by a telecommunications company. Having ascertained the work and home locations of the mobile phone users from the location records, they constructed a directed and weighted commuting flow network, using it to identify thirteen communities (functional regions) within the study area of Shenzhen, China. Methods for dynamic accessibility analysis using mobile phone records and online route planners are presented by García-Albertos et al. (Citation2018). These compute on changes in the attractiveness and travel time for transport zones within the Municipality of Madrid for a day, using anonymized call details records and the Google Map Directions Application Programmers Interface (API) respectively. Ahas et al. (Citation2015) propose a methodology to detect spatial and temporal differences in everyday activities using the call detail records (CDR) of three cities, namely Harbin city (China), Tallinn (Estonia) and Paris (France). The study measures the temporal differences in activities for the three test cities using four temporal indicators: night minimum, morning rush-hour, midday and the whole of an active day. It also proposes a quartile-based approach to analysing spatial differences in the cities to reduce the effect of the uneven spatial distribution of antennas. Chen et al. (Citation2016) introduce datasets, concepts, methods and issues common in studies of human mobility. In particular, they discuss the problems associated with using big data like mobile phone network data. Dividing the study of mobility into three areas, namely behavioural factors, model development and human mobility patterns, the overall aim of the paper is to synergize the work of two groups – one consisting of transport planners/researchers working with small data and the other including computer/data scientists working with big data. Several studies have focused on a visual analytics approach for urban mobility analyses using mobile phone network data (Sobral, Dias, and Borges Citation2019; Senaratne et al. Citation2017; Andrienko et al. Citation2017; Chen, Guo, and Wang Citation2015; Sagl, Loidl, and Beinat Citation2012). Toole et al. (Citation2015) used call data records in conjunction with census and road network data with the aim of gaining a better understanding of road usage patterns in five metro regions: Boston, San Francisco, Lisbon, Porto and Rio de Janeiro. Based on bipartite road usage graphs, the authors managed to identify congested road segments and sources (census tract) of congestion. In a recent article, Gregersen and Lunke (Citation2018) provided an additional review of literature on the use of mobile phone network data for travel behaviour research. Most of the empirical work covered in these studies underlines the innovation potential of such data for transport analysis. At the same time, this empirical work is so far restricted to specific urban regions and spatial types. We posit that the use of mobile phone network data has much greater potential, allowing transport and travel patterns between different urban environments to be analysed, for instance between different settlement types (metropolis, large cities, small and medium-sized cities etc.), urban cores and catchment areas, as well as daytime/night-time activity patterns in certain cities. The potential of such area-wide monitoring could provide new insights into understanding interdependencies between different urban types and recent mobility trends. Furthermore, the efficiency of a settlement structure to service future mobility needs can be assessed in greater detail, for example between monocentric and polycentric urban development paradigms. Such analysis requires data with a larger spatial scope, in our case for the whole of Germany.
In a previous study, Tolouei, Álvarez, and Duduta (Citation2015) also used Telefonica data to verify the accuracy of identified trip origins and destinations extracted from mobile phone network data. They compared the data processed by Telefónica with roadside interview data (RSIs) obtained for the region of Leicester, UK. They conclude that the processed mobile phone network data is not biased or less accurate than conventional RSI data. They further highlight the strength of mobile phone network data in providing valuable insights into macro population movements and its potential for highway matrix development. In the following sections, we expand on the aforementioned research studies, aiming to test the analysis potentials of mobile phone network data for transport planning and related analyses such as transport models, spatial monitoring applications and their interpretation in transport planning policy targets.
3. The data and methodology section
3.1. Data sources and data fusion
Aggregated and anonymized mobile phone network data was provided by Telefónica Next as an origin-destination-matrix based on nearly 45 million registered mobile phone numbers, 21 million customers and 8 billion network events. This database is populated with records when mobile devices communicate with mobile phone cells, for example, when surfing the Internet or making phone calls. Mobile device activities are recorded, anonymized and processed to identify movements and trips. In a further work step, movements are typified by recurring patterns, identifying places of residence and work or paths to other destinations. In order to implement statistical analyses of such mobility data responsibly, Telefónica Next has developed a specific anonymization routine conforming to data protection regulations. The spatial extent of mobile network traffic covers the whole of Germany, with postcodes used as the spatial unit of traffic data. The temporal range of this data is one typical week in March 2017. The huge spatial extent of the data provides an opportunity to explore movement patterns between different urban settlement types, for example in terms of traffic flows. gives a brief summary of the mobile phone network dataset.
Table 1. Brief summary of the Telefónica mobile phone network dataset used in this study (one week in March 2017).
Trips were provided as a Comma Separated Value (CSV) file for a time series with 1-hour intervals. The data essentially has five attributes, namely startzone, endzone, day, hour and number of trips. The terms (used hereinafter) startzone and endzone represent the postcodes where the trip originated and terminated. This data structure allows queries aggregated by day, hour and postcode, meaning that mobility patterns can be analysed by morning and evening peaks or at specific hours and filtered for start- and endzones of interest, for weekdays and weekends (Telefónica NEXT Citation2018). To detect spatial mobility pattern in data with postcodes as the spatial unit and thus answer research questions interested in functional relationships between origins and destinations, additional information on the character and function of origins and destinations needs to be added. One useful representational unit for this purpose is the so-called RegioStaR classification (in German: ‘Regionalstatistische Raumtypen’, English translation: ‘regional statistics spatial types’) defined by the German Federal Ministry of Transport (BMVI Citation2018) which was used as an auxiliary data source for this study. The objective of this new classification, published in mid-2018, is to delineate functionally homogeneous municipalities into spatial types, especially for research into transport and mobility planning. Another requirement was to establish spatial types that are robust over time and can be updated and complemented with newer datasets designed for monitoring purposes (BMVI Citation2018).
On this basis we aggregated trip volumes by the RegioStaR categories (1) rural areas and their subtypes (peripheral rural areas and rural areas within the catchment areas of city regions), (2) small and medium-sized cities and their commuter catchment areas (in German: ‘Regiopolitane Stadtregionen’) and (3) larger metropolitan areas (in German: ‘Metropolitane Stadtregionen’). This allowed us to detect typical mobility patterns between these spatial types (for example the morning rush-hour for commuters working in inner-city locations) or to identify cases where deviations from theoretical assumptions on mobility patterns were observed and needed to be explained. To this end, we linked the original mobile phone network data with the RegioStaR classification of the approx. 11,000 municipalities in Germany. Note that the phone data lacked information on the mode of transport, an important attribute for any comprehensive travel behaviour analysis. This is a weakness in the current state of development for mobile phone network data in general. In theory, it should be possible to detect transport modes by using phone location data to ascertain speeds, i.e. the time needed to move from one location to the next, and thus the mode of transport. Accuracy, however, varies between areas and transport modes; the differentiation of transport modes in dense inner cities with many transport options is still an open research issue (Huang, Cheng, and Weibel Citation2019).
The aggregated and anonymized mobile data was stored as a table in a PostgreSQL database. Based on the details of a query execution plan, indexes were created on the table to speed up queries. Computationally intensive geoprocessing tasks such as a so-called Spatial Join were also executed in PostgreSQL using functions provided by its spatial database extender PostGIS.
Besides classification data from BMVI, another important source of auxiliary data was the road network data from OpenStreetMap (OSM) for Germany. Obtained from Geofabrik GmbH, OSM data are pre-processed as a routable shapefile for use in graph processing e.g. routing or reachability analyses with ArcGIS Network Analyst (Ramm Citation2019). The OSM data were used to compute trip length, the distance between origin and destination. Trip length and trip frequency are the two measures of mobility analysed in this study. Trip frequency between pairs of startzone and endzone was obtained from the mobile data records, while trip length was calculated using the Network Analyst Extension in ArcMap 10.5.1, a commercial desktop GIS software package developed by ESRI Inc. This software package is frequently used by transport planning authorities and therefore seen as the most accessible routine available to practitioners.
3.2. Data preparation and classification
As part of data preparation, we applied basic data quality checks and aggregation routines. The main purpose was to convert data from postcode units to spatial units relevant for the policy level. In Germany, the most important policy levels using spatial designations are regional plans and district/local area plans. The most important base unit for monitoring spatial policies in related plans and objectives in text formulations are municipalities (LAU 2 level according to the nomenclature of the European Union). Data conversion, therefore, entailed converting postcode data to municipalities, for the most part without overlaps. To overcome any eventual overlaps, we drew up rules to reassign data based on area proportions of overlapping units.
Of the total 8222 postcodes, 1363 were found to cover more than one municipality. However, of these only 211 spanned municipalities belonging to different region classifications. These postcodes were assigned to the region classification of the municipality with the largest overlap area, thereby minimizing ambiguity. shows the number of postcodes assigned to each classification. The resulting spatial typology by postcode was then linked to the table with mobile traffic data in a spatially enabled PostgreSQL database. Performance considerations required that indexes be used to improve query performance.
Table 2. BMVI classification of regions and the number of postcodes assigned to each category.
3.3. GIS-based network analysis
Frequency and spatial range constitute two key dimensions of mobility (Williams et al. Citation2015). In this sense, we first measured frequency as the number of trips between two zones, a pattern varying at different times of the day and on different days of the week. Spatial and temporal frequency patterns have several uses in urban studies, for example, to determine a zone’s attractiveness (sometimes called ‘gravity’ from a modelling perspective). In order to model distances between start- and endzones, we created travel routes in a street network provided by OSM, enabling us to calculate the approximate length of each trip between the geometric centroids of start- and endzones.
Computing routes between 8222 (German postcodes) datapoints requires intensive processing. Even if not all possible combinations are practical (it is unlikely that people travel long distances on a daily basis and remote places are less frequently travelled to), route calculation nonetheless dictated significant performance considerations. Parallelization helped improve processing performance. The program code snippet featured in Appendix A.1 documents the procedure used to compute the network distances between startzone and endzone. The function GetDistances given in Appendix A.2 was used to calculate network distance between the features in the origin and destination layers. This function uses a network dataset built from the OSM street network and methods available in the ArcPy network analyst module (ESRI Citation2019).
4. Descriptive analysis options: methods, tools, examples
4.1. Interactive visualization tool with R shiny
To investigate human mobility patterns and compare different urban environments with a dataset as the one used in this study, a visual analytics tool was needed, as such tools have interactive parameter options useful for filtering, exploring and aggregating the data for criteria like spatial types or time of the day (Sagl, Loidl, and Beinat Citation2012; Zheng et al. Citation2016; Keim et al. Citation2010). We developed such a tool using the open-source R software in conjunction with various R packages. We chose the R Shiny package to build the application interface and implement reactive functions. The RPostgreSQL package was used to query the PostgreSQL database table (Conway et al. Citation2017). Query results in the form of graphs were generated using the packages plotly and ggplot2. The design of these tools addresses two main analysis objectives:
Analysis of traffic flows to and from major urban centres/city cores in Germany
o in terms of trip frequency aggregated by day or hour
o in terms of total distance travelled aggregated by day or hour
Analysis of traffic flow between zones with different BMVI classifications
o in terms of trip frequency aggregated by day or hour
o in terms of total distance travelled aggregated by day or hour
Results are visualized in interactive graphs. Below are examples of the results produced with the tool. Three directions of traffic flow can be analysed: (1) Incoming traffic to the postcodes in the urban centres (Incoming) from all other postcodes in Germany, (2) outgoing traffic from postcodes in the urban centres (Outgoing) to all other postcodes in Germany, and (3) net traffic defined as the difference between incoming and outgoing traffic (Incoming – Outgoing).
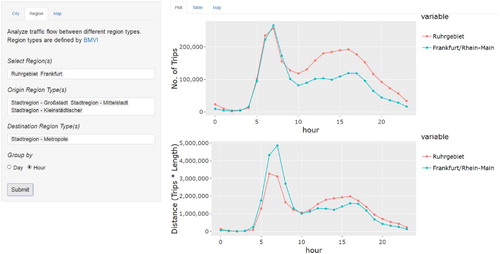
The two graphs in show the computed traffic flows to and from the three largest urban centres in Germany (Berlin, Hamburg, Munich, see results section for interpretation) in terms of frequency and distance. uses another set of options to query the dataset, examining traffic flow patterns within city regions and their sub-centre or suburban origins and destinations under the RegioStaR classification. This method helps to better understand functional linkages within a polycentric urban system with different city sizes, for example the Ruhrgebiet and Frankfurt am Main metropolitan regions.
Figure 2. Example of traffic flows to and from the three largest urban centres in Germany using an interactive data visualization tool.
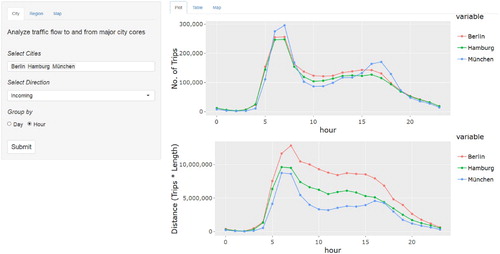
Figure 3. Example of traffic flows between different spatial types within defined urban regions in Germany using an interactive data visualization tool.
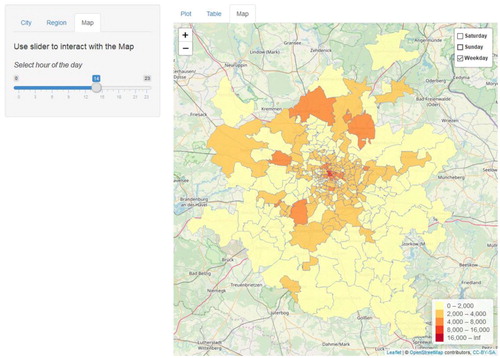
The tool also allows data to be viewed on a map. The Javascript library Leaflet together with the R packages rgeos, sp and maptools were used to read and visualize the spatial data. shows a choropleth map representing quantities of trips made to the zones of Berlin for selected hours of the day. Furthermore, it allows a comparison of the number of trips made on different days of the week (for example weekdays, Saturdays or Sundays), in this case for a weekday at 2 PM.
Figure 4. Map showing the quantities of trips into the zones of the Berlin region for a selected hour of the day.
4.2. Spider map visualization
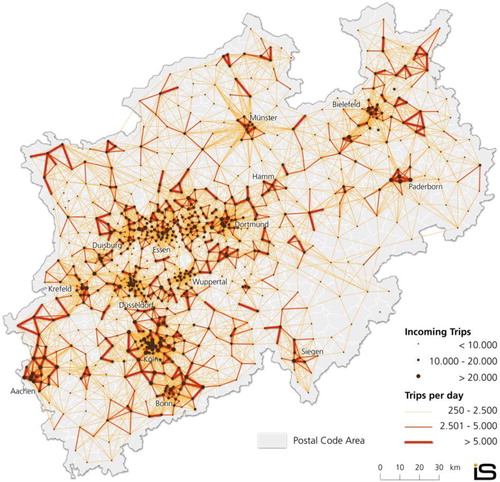
Methods for understanding road usage patterns in urban areas with the help of mobile phone network data can be found in Toole et al. Citation2015. They explain the use of bipartite usage graphs to identify road segments at risk of becoming congested due to heavy traffic flows and the census tracts from where the traffic originates. Our study enabled a similar usage pattern to be visualized, as shown in . The method used can help infer the attractiveness of postcodes, representing the incoming traffic with graduated point symbols. It is also helpful in visualizing the volume of traffic between zones displayed with graduated line symbols. Together they provide a good estimate of links with heavy traffic flows and postcodes contributing to the traffic, regardless of the transport mode. A similar visual heuristic approach was tested for the definition of commuter catchment areas in the United States by Dash Nelson and Rae (Citation2016). The authors point out that, although the visual approach aids in exploratory analysis, it is not sufficient to support practical decision-making. In addition, a computational approach determining traffic volumes for specific road segments in the network would significantly augment visualizations of traffic patterns. To arrive at a reasonable estimate of traffic volumes and subsequent congestion potentials in the network, we tested the technique explained in the following section.
Figure 5. Traffic density map visualizing the volume of traffic between postcodes and the incoming traffic volumes for each postcode in the region of North Rhein-Westphalia for a typical weekday.
5. Diagnostic analysis options: are mobility patterns determined by urban spatial structure?
In this section, we present and interpret some of the results obtained using the methods discussed in the previous section for the mobile phone network data supplied by Telefónica. We chose study areas providing the possibility to reflect on the accuracy of our results in the light of widely studied mobility patterns – usually the case for the main metropolitan areas of Germany. , which we used to demonstrate the method, shows the number of trips and trip lengths for incoming trips for the cities of Berlin, Hamburg, and Munich. Note that the two graphs do not show the same pattern: despite the fact that the urban centre of Munich registers a greater number of incoming trips during morning and evening peak hours, total travelled distances to the Munich centre are less than those for the urban centres of Berlin and Hamburg. , also shown in the previous section, depicts trips within a region from suburbs and suburban centres to the main city for the polycentric regions of Ruhrgebiet and Frankfurt/Rhein/Main. In an initial interpretation, we see that the two regions have similar morning peaks in terms of traffic volume. However, volumes in the afternoon and evening differ, being much higher in the Ruhrgebiet. Interestingly, traffic in the Frankfurt/Rhein-Main area attracts trips from farther away.
The following examples demonstrate applications of mobile phone network data and how it can help develop a better understanding of human travel behaviour in different urban environments.
5.1. Trip patterns characteristic for monocentric city regions
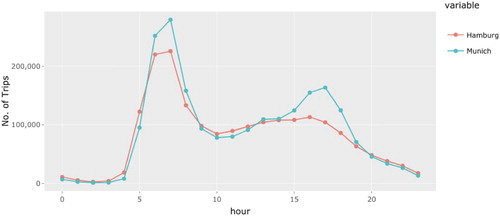
We start by looking at trip patterns in two well-known monocentric city regions in Germany – Hamburg and Munich. Monocentric in this application means that we expect a dominant inner-city core to act as a magnet for traffic flows from suburban locations. Though subcentres exist, they are far outweighed in their importance as centres of activities by the inner-city core, as is the case with Hamburg and Munich – in contrast to most other city regions in Germany (Böltken and Stiens Citation2002). The two cities have a very similar number of inhabitants- meaning that we do not have to control for population size in the results. shows changes by hour in the traffic coming into Hamburg and Munich from the rest of Germany. For both urban centres, we observe a morning peak between 7am and 9am. There is another much smaller afternoon peak between 4pm and 5pm. The peaks for the two urban centres differ in magnitude. Munich records a slightly higher number of trips into the urban centre during the morning peak than Hamburg, while its afternoon peak is significantly higher. The graph largely resembles the typical trip pattern we would expect in a monocentric city region with a dominant core. Commuters from the outskirts exert pressure on the transport system in a clearly visible morning peak that levels off after typical business hours start (6–9am). The late afternoon peak is less pronounced since end-of-the-day business hours are more spread out (3–8pm).
Figure 6. Graph comparing aggregated incoming traffic in two monocentric regions – Hamburg and Munich.
The value of such analysis for transport planning will only become obvious once time series for monitoring become available. From other studies on commuting patterns we know that trip volumes and trip lengths in economically successful cities like Munich and Hamburg have increased significantly over the last decades (Fina, Rusche, and Gerten Citation2018). The liberalization of the labour market, improvements to the transport system, but also residential suburbanization have led to a significant increase of long-distance commuting across the city regions of Hamburg and Munich, resulting in unprecedented congestion problems and traffic delays on the road network, overcrowded public transport and environmental and psychosocial stress for commuters at peak times. Spatial planners are considering changes to the opening or operating hours of institutions where they can theoretically intervene, especially those engendering peak traffic like schools and kindergartens, or coordinated efforts to regulate shift work to spread traffic more evenly across the day. None of these proposals have so far been put into practice, as there are many legal and societal obstacles that are difficult to resolve. Nevertheless, monitoring the magnitude of peak traffic could help assess the potential of such initiatives.
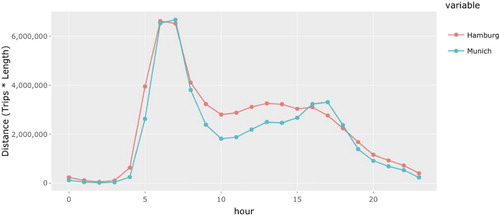
It is also useful to know the distances travelled to urban centres. shows by hour the total distance (calculated as trip length multiplied with the number of trips) travelled to the urban centres. Unlike trip frequency (higher in Munich), the graph in shows that the total distance travelled to the Hamburg urban is higher, i.e. the catchment area is larger.
Figure 7. Graph comparing total distance travelled to urban centres of two monocentric regions – Hamburg and Munich.
Such information, once available in time series and possibly also by transport mode, could provide transport planners with assessment results for transport strategies and objectives. One example is the mixed-use development of subcentres with the aim of reducing the need for commuters to travel in large numbers to jobs in the inner city. This expectation is certainly offset by general trends, for instance, higher mobility needs in a highly diversified labour market. This trend has been researched under the term ‘wasteful commuting’ in the past, with high-skilled employees willing to travel large distances to workplaces that offer lucrative jobs in line with their skills (Hamilton and Röell Citation1982). However, suburban locations with mixed land use functions (residential, business, shopping, entertainment, recreation, etc.) are nevertheless more likely to produce fewer trips than segregated land uses where people need to travel over longer distances for daily activities. Any evaluation of the expected outcome of such developments could profit from accurate data and the monitoring of trip patterns like the one shown in .
5.2. Comparing trip patterns between monocentric and polycentric city regions
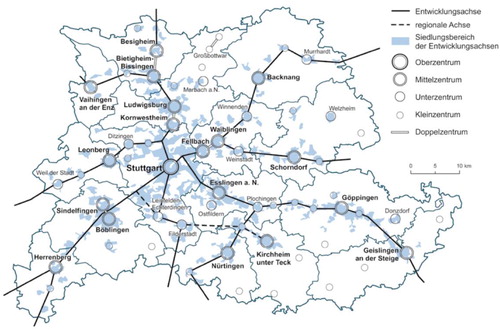
Having compared two monocentric regions, we now compare traffic flows within polycentric and monocentric regions. As examples of polycentric regions in Germany, we consider the Stuttgart and Frankfurt regions. Both have a significantly less dominant inner city core with a population in 2016 of approx. 628,000 (Stuttgart) and 736,000 (Frankfurt am Main) and a hierarchy of important to less important sub-centres in their commuter catchment areas, compared to Munich and Hamburg which we retain as typical monocentric regions for this exercise (City of Hamburg: approx. 1.81 mio. inhabitants; City of Munich: approx. 1.45 mio. inhabitants). Spatial planners frequently claim that public transport is more cost-efficient in polycentric settlement structures with sub-centres that serve as nodes or public transport hubs in a network of development axes connecting sub-centres. The assumption is that transit-oriented development, a term coined by Peter Calthorpe and William Fulton in the early 2000s, can be established through high-speed train connections between the most important (sub-) centres in radial and circular connections, supplemented by local transit options like tramways, park-and-ride facilities and active modes to the transport hub (Calthorpe and Fulton Citation2001). Now a paradigm in regional planning, this concept has been adopted for example in the Stuttgart Region through definitions of development axes and high-speed train connections between the inner city and the main suburban centres Böblingen/Sindelfingen, Esslingen, Ludwigsburg, Vaihingen/Enz and incrementally with newer connections to formerly more self-contained cities on the outskirts of the region (for example Kirchheim/Teck, Heilbronn, Herrenberg, Waiblingen, see Verband Region Stuttgart Citation2010 and ). Spatial planners in Stuttgart have promoted new housing developments along these axes over the last 20 years, while at the same time trying to restrict development outside these axes.
Figure 8. Regional plan of the Stuttgart region with transit-oriented state-planned development axes (in German ‘Entwicklungsachse’), regional development axes (in German: ‘regionale Achse’), settlement areas along the development axes (in German: ‘Siedlungsbereich der Entwicklungsachsen’) and a city/town hierarchy from high to low (in German: ‘Oberzentrum’, ‘Mittelzentrum’, ‘Unterzentrum’ and ‘Kleinzentrum’). Some cities/towns are ranked together (a ‘Doppelzentrum’).
One would expect these efforts to result in a high number of trips between these subcentres and the core city of Stuttgart. In its basic structure, the Frankfurt region is similar, with the difference that two different German states (‘Länder’) are involved: Hesse and Rhineland-Palatinate. Two important centres in the Frankfurt region have the status of state capitals (Wiesbaden for Hesse, Mainz for Rhineland-Palatinate), while Darmstadt is a further important city. These centres have important administrative functions and therefore attract traffic flows to related workplaces and educational institutions. However, the dominant labour market with the status of a so-called global city is Frankfurt am Main, the city analysed in the graph below.
With this as background, we can now test whether the regional planning paradigm mentioned above holds true for the selected cities, comparing traffic flows between a region’s subcentres and core city in the respective two polycentric and monocentric regions. (a) shows the resulting statistics for traffic flows in the case study regions in absolute number of trips. The first thing we observe is the lack of significant morning and evening peaks in the two polycentric regions, leading to the conclusion that commuter traffic is not so dominant in medium-sized cities as in core cities with their larger numbers of workplaces. On the one hand, it is clear that the number of trips between medium-sized cities in polycentric regions like Frankfurt and Stuttgart is far higher than in monocentric regions like Hamburg and Munich, populous cities attracting more traffic (see ). (b) complements the visualization with a standardized graph representation showing trips per capita. We interpret the higher number of trips in the Stuttgart and Frankfurt regions as indicative of the relative economic importance of their subcentres in comparison to Munich and Hamburg. On the other hand, we find that there are more trips in absolute terms between small-sized cities in monocentric regions than in polycentric regions, as seen in (a) (number of trips), but not in relative terms ((b), trips per capita). There are two conclusions to be drawn from this observation: apart from trips going into the urban core, traffic between medium-sized cities dominates in polycentric regions. From a transport planning point of view, we, therefore, expect a higher cost-efficiency and related investments in transit-oriented developments in polycentric regions. For monocentric regions we expect a higher reliance on private vehicles to travel from small towns to non-central destinations. This is not to say that mobility in polycentric regions is more sustainable in every case. However, the results suggest that polycentric regions have structural advantages over monocentric ones in their cost-efficient provision of public transport.
Figure 9. Graphs comparing traffic flows between medium-sized cities within polycentric (Stuttgart, Frankfurt) and monocentric (Hamburg, Munich) regions; (a) total trips made between medium-sized cities at different hours of the day; (b) standardized plot showing trips per capita between medium-sized cities at different hours of the day.
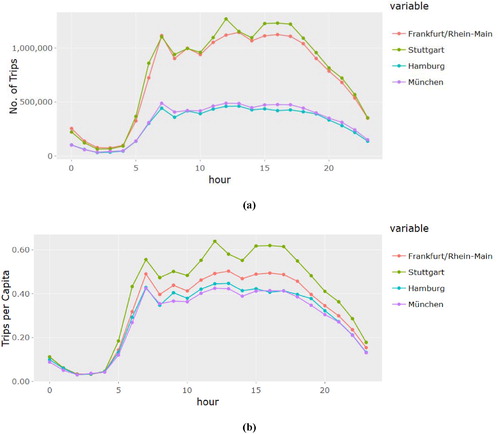
Figure 10. Graphs comparing traffic flows between small-sized cities within polycentric (Stuttgart, Frankfurt) and monocentric (Hamburg, Munich) regions; (a) total trips made between small-sized cities at different hours of the day; (b) standardized plot showing trips per capita between small-sized cities at different hours of the day.
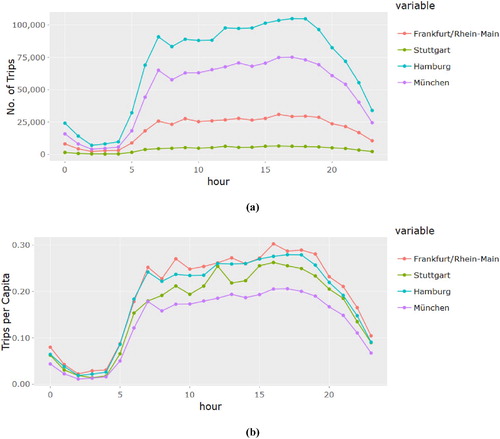
Table 3. Statistics on small and medium-sized cities for the case study regions.
6. Predictive analysis options: traffic volume and future congestion risks
The final use case presented here aims to identify potential bottlenecks in the road system. It is predictive in nature because it applies a set of assumptions based on empirical knowledge to a modelled use case in the future.
6.1. Traffic volume estimates
The identification of road segments in the network with heavy traffic volumes would require a spatial analysis including routes along the street network rather than OD links. The routes between a set of origin and destination nodes in a road network can be generated using the Closest Facility tool in ArcGIS. The workflow to compute routes is basically the same as described in Section 3.3 except that the OD cost matrix is replaced by the closest facility solver in the function GetDistances. Once the routes are generated, an overlay analysis such as spatial join can be carried out to quantitatively determine traffic volumes on a given road segment. Below we briefly illustrate and explain the steps carried out in this study to estimate traffic volumes in the network.
The process is essentially two-step. In the first step, the routes are computed for a set of origin and destination nodes. Here again, the centroid of a trip’s startzone and endzone is considered as origin and destination node. For the sake of example in (a), we show 6 origin points, O = {1, 2, 3, 4, 5, 6} and one destination point D. The same can be applied to n number of origin and destination points. This generates six routes to which we can assign the desired attributes like number of trips for each hour, day etc. with a table join.
Figure 11. Diagrams explaining the steps used to compute traffic volumes from mobile phone network data and street network using GIS: (a) routes between given origin and destination points, (b) aggregated route attributes for each segment in the network.
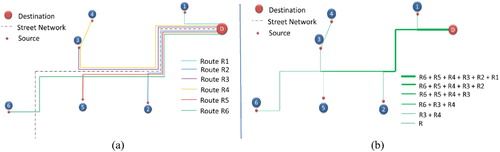
Once the required attributes are joined, in the second step the routes are spatially joined to aggregate the number of trips for the road segments. The thickness of the lines in (b) is indicative of the increasing number of trips or traffic volume. Traffic volume along with type, capacity or average speed can help ascertain whether a given road segment is susceptible to congestion. One major caveat here is the lack of transport mode information, currently not available. Another limitation is the assumption that all users use the same route. In practice, where multiple options are available, users can make route choices. Consequently, the traffic flow along the routes may be divided. The ArcGIS Network analyst returns the best route by shortest distance or travel time between two points. In theory, it is possible to model alternative routes by introducing line barriers. Once the shortest path is solved, it could be loaded as a line barrier with an appropriate scale factor for the subsequent solutions to find alternative routes. However, this was not implemented in the current study since we consider such an approach as inferior to the functionalities of a state-of-the-art transport model. Such models, especially in the form of four-stage transport models, are specifically designed to solve such questions much more comprehensively than GIS network analysis can do.
6.2. Congestion modelling
This method was used to estimate the traffic volume of each road segment in the transport network, taking into account the number of trips registered in the mobile phone network data and assigning them to the nearest road network features. Comparing the traffic volume with the known road capacities can give a good estimate of congestion. It should, however, be noted that the method assumes all trips are made by car due to lack of information about the mode of transport used. In practice, a certain percentage of trips are made with modes of transport other than by car. This percentage, however, is small if we consider only longer trips that are not likely to be made on foot or by bicycle. The remaining portion of trips could have been undertaken on public transport where such options exist. This is unknown in this study design and potentially distorts the results. Using generic figures given by the panel study ‘Mobilität in Deutschland 2017’, we estimate the modal share of public transport to be around 5% for small towns and up to 20% for metropolitan areas, according to the settlement type of the trip origin (Bundesministerium für Verkehr und digitale Infrastruktur Citation2017). Road capacity was estimated based on OpenStreetMap (OSM) road classes and associated capacity values for the OSM fclass attribute (Zilske, Neumann, and Nagel Citation2015). Intended to be used for inner cities, these numbers have been rolled out for all road segments in the state of North Rhine-Westphalia. This is a critical caveat; the estimates need to be replaced as soon as valid estimates for road segments become available. lists the tags in OSM data used for identifying different kinds of roads, streets or paths. The capacities (vehicles per hour) for each tag used to determine congestion potentials in the network are also listed. These were extracted from the article by Zilske, Neumann, and Nagel (Citation2015) on the use of OpenStreetMap for traffic simulation. The table also gives the length of the network in the study area for different road type as well as for each class as derived from congestion analysis. Though positing that this approach is useful in theory, we have no way of verifying the correctness of the results without further reference data. Results will become more robust, once information on modes of transport and more accurate values of road capacity for different OSM road types become available. The method can however help detect congestion potentials in the road network in a timelier and more frequent manner for future transport analysis applications. We applied the method to the whole of North Rhine-Westphalia (NRW), Germany’s most populous and most densely populated state and a classic polycentric region containing four of Germany’s 10 largest cities: Düsseldorf, Cologne, Dortmund and Essen. Indeed, the Rhein-Ruhr metropolitan area is the largest in Germany (Wikipedia Citation2019). As many as 93,000 routes were computed for trips that either originated or terminated in the NRW postcodes for a typical weekday (see ). The line features representing the routes were linked with the trip count for each hour of the day from mobile data records based on the common attributes (startzone and endzone). The routes were then spatially linked with the layer containing road network to aggregate the traffic volume for road segments in the network. The capacity (vehicles per hour) of each road segment in the network was assigned based on the characteristics of the road types.
Figure 12. Map showing congestion potentials in the transport network for the state of North Rhein-Westphalia in Germany during the morning peak hour.
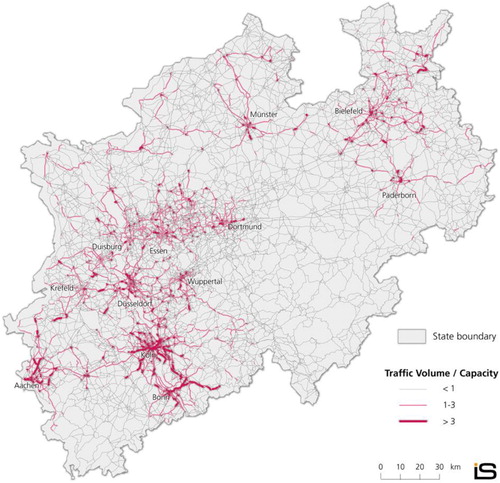
Table 4. Road type, capacity and length of road network.
With traffic volume (V) and capacity (C) for each road segment now available, we were able to map segments with congestion potential using the ratio of traffic volume / capacity. highlights road segments prone to congestion i.e. the ratio (traffic volume at morning peak hour/ capacity) is greater than 1 but less than 3 (in blue) and those highly prone to congestion with a ratio greater than 3 (in red).
7. Discussion and future work
This article demonstrates the potential of using mobile phone network data in transport planning and monitoring applications in Germany. Based on a brief literature review we agree with many scholars that the time-consuming and expensive organization and conduct of dedicated travel surveys can be largely replaced and complemented by analysing mobile phone network data. Users set to benefit from such data are transport planners and transport engineers who rely heavily on traffic counts to apply best practice infrastructure planning and evaluation procedures. In addition, the data is also useful to academia in transport and spatial planning-related disciplines, in transport economics, to scholars and planning practitioners working on local and regional policy as well as to policymakers concerned with the much discussed mobility transition as a key to decarbonize the transport sector. Some studies come to the conclusion that mobile phone network data captures mobility trends much better than any dedicated travel survey can do. The data is automatically collected by mobile phone network providers and therefore readily available, at least for the spatial activities of a company’s customer base. Location-specific projections can be used to derive the absolute number of trips based on the available sample, provided that the sample size is large enough. In this respect, the Telefónica data used in this study covers a considerable market share, thereby allowing robust projections. In addition, it covers the whole country of Germany in a data format that can easily serve as a longitudinal data source for continuous monitoring. In contrast to existing studies that focus on metropolitan areas with privileged data access, our study shows concepts that serve the purpose of such continuous monitoring on the national, state or regional levels of spatial planning.
Data protection issues are usually covered by customer consent provisions allowing the use of anonymous data as part of the contract. However, general data protection regulations (GDPR) protecting the anonymity of individuals prevent the gathering of information on household structure and demographics, a ‘nice to have’ from an analytical point of view. Detailed information on mobility behaviour that can be linked to social characteristics at an individual level is therefore likely to remain the domain of panel studies and micro-census reporting. For example, Germany and Switzerland have been reporting on the mobility behaviour of their respective populations at regular intervals since the 1970s (Bundesamt für Statistik Schweiz Citation2017; Nobis and Kuhnimhof Citation2018). Data collection is time-consuming and expensive, and this is where mobile phone network data comes in: it can complement micro-census data with much bigger sample sizes and in a frequent and timely manner. Currently, there are still weaknesses, for example in identifying the mode of transport used for a trip. We expect algorithms to become available in the near future to improve the identification of transport modes, possibly by integrating additional transport infrastructure data and the information collected by built-in sensors like accelerators or magnetometers in smartphones (Wang, He, and Leung Citation2018). The mobile phone network data as used in this study provides only limited opportunities to understand travel patterns and support transport planning and policymaking.
Our primary aim was to highlight the potential of this data for spatial analysis, making its value clearer to the transport planning community. Data-handling procedures require skills in database management, for example in the handling of large datasets in a PostgreSQL database with spatial analysis functionalities (PostGIS). We describe in this paper how such analysis paths can be set up and finetuned to perform with acceptable processing times. This technical backbone will naturally require data analysts trained in such techniques. Having this data ready for analysis, however, is just one step. The other is to come up with analysis concepts of use in spatial monitoring and allowing planners to identify for example mobility patterns in detail. In this context, we show examples requiring the data to be aggregated to spatial typologies relevant for policy formulations in the transport sector. We chose a typology recently developed by the Federal Ministry of Transport for this purpose, aggregating the data in SQL queries for selected spatial types, for example, metropolitan areas and their commuter catchment areas, medium-sized or small towns. By doing so, we can produce traffic flow graphs and test the results against normative planning objectives, for example, transit-oriented regional planning paradigms. We show for example that traffic volumes in monocentric city regions are structurally different to those in polycentric regions. The latter have advantages in terms of public transport provision, and in this respect planning can help reduce a population’s travel needs. It is clear that such reductions can be offset by other changes and new policies aimed to support the mobility transition from the private motor car to more sustainable forms of transportation. Examples currently under discussion include road tolls, restrictions on driving older diesel vehicles into inner cities, but also general societal changes to car usage such as carsharing.
We posit that the monitoring is of crucial importance for evaluating the efficacy of such policies. From an analytical point of view, the new methods promise to raise monitoring applications to a new level in this respect. From an organizational point of view, however, datasets for such applications are currently only available from commercial providers. Potential users will have to rely on their continuous availability in terms of data structure and pricing. In comparison to official datasets provided by governments (census data, regional statistics, geotopography), this risk has to be assessed in the light of the added value the datasets provide for monitoring purposes. At the same time, there are some problems that need to be resolved: in order for mobile network data to become a standard for transport monitoring the mode of transport needs to be provided. Moreover, data availability and consistency need to be such that time series are robust and comparable over many years. There is ample evidence that these issues will be resolved in the near future, meaning that the concepts and applications shown in this article can be further developed and picked up by the community.
Supplementary_Material
Download MS Word (16.9 KB)Acknowledgements
We thank Alexander Lange, Practice Lead Transport Analytics at Telefónica Germany NEXT GmbH, for providing the aggregated and anonymized sample of mobile phone network data and his support in conducting this study.
Disclosure statement
No potential conflict of interest was reported by the author(s).
References
- Ahas, R., A. Aasa, Y. Yuan, M. Raubal, Z. Smoreda, Y. Liu, C. Ziemlicki, M. Tiru, and M. Zook. 2015. “Everyday Space–Time Geographies: Using Mobile Phone-Based Sensor Data to Monitor Urban Activity in Harbin, Paris, and Tallinn.” International Journal of Geographical Information Science 29 (11): 2017–2039. doi: 10.1080/13658816.2015.1063151
- Andrienko, G., N. Andrienko, W. Chen, R. Maciejewski, and Y. Zhao. 2017. “Visual Analytics of Mobility and Transportation: State of the Art and Further Research Directions.” IEEE Transactions on Intelligent Transportation Systems 18 (8): 2232–2249. doi: 10.1109/TITS.2017.2683539
- BMVI (Bundesministerium für Verkehr, und digitale Infrastruktur). 2018. RegioStaR Regionalstatistische Raumtypologie für die Mobilitäts-und Verkehrsforschung. July. Accessed May 2, 2019. https://www.bmvi.de/SharedDocs/DE/Artikel/G/regionalstatistische-raumtypologie.html.
- Böltken, F., and G. Stiens. 2002. “Siedlungsstruktur und Gebietskategorien.” In Nationalatlas Bundesrepublik Deutschland. Dörfer und Städte, edited by Institut für Länderkunde Leipzig, 30. Berlin: Verlag.
- Bundesamt für Statistik Schweiz. 2017. Verkehrsverhalten der Bevölkerung. Ergebnisse des Mikrozensus Mobilität und Verkehr 2015. Neuchatel. Accessed August, 29, 2019. https://www.bfs.admin.ch/bfs/de/home/statistiken/mobilitaet-verkehr/personenverkehr/verkehrsverhalten.assetdetail.1840477.html.
- Bundesministerium für Verkehr und digitale Infrastruktur. 2017. Regionalstatistische Raumtypologie. Accessed May 22, 2019. https://www.bmvi.de/SharedDocs/DE/Artikel/G/regionalstatistische-raumtypologie.html?nn=12830.
- Calthorpe, P., and W. Fulton. 2001. The Regional City. Planning for the End of Sprawl. Washington, DC: Island Press.
- Chen, W., F. Guo, and F. Y. Wang. 2015. “A Survey of Traffic Data Visualization.” IEEE Transactions on Intelligent Transportation Systems 16 (6): 2970–2984. doi: 10.1109/TITS.2015.2436897
- Chen, C., J. Ma, Y. Susilo, Y. Liu, and M. Wang. 2016. “The Promises of Big Data and Small Data for Travel Behavior (aka Human Mobility) Analysis.” Transportation Research Part C: Emerging Technologies 68: 285–299. doi: 10.1016/j.trc.2016.04.005
- Conway, J., D. Eddelbuettel, T. Nishiyama, S. K. Prayaga, and N. Tiffin. 2017. RPostgreSQL: R Interface to the ‘PostgreSQL’ Database System. R package Version 0.6-2. Accessed May 29, 2019. https://CRAN.R-project.org/package=RPostgreSQL.
- Dash Nelson, G., and A. Rae. 2016. “An Economic Geography of the United States: From Commutes to Megaregions.” PLoS ONE 11 (11): e0166083. doi:10.1371/journal.pone.0166083.
- De Meersman, F., G. Seynaeve, M. Debusschere, P. Lusyne, P. Dewitte, Y. Baeyens, and H. I. Reuter. 2016. “Assessing the Quality of Mobile Phone Data as a Source of Statistics.” In Conference Paper Presented at the European Conference on Quality in Official Statistics, Madrid (Vol. 31).
- Erl, T., W. Khattak, and P. Buhler. 2016. Big Data Fundamentals: Concepts, Drivers & Techniques. Upper Saddle River: Prentice Hall Press.
- ESRI (Environmental Systems Research Institute). 2019. ArcGIS Desktop Help 10.5, Network Analyst (OD Cost Matrix Analysis. Accessed August 20, 2019. http://desktop.arcgis.com/en/arcmap/10.3/tools/network-analyst-toolbox/make-od-cost-matrix-layer.htm.
- Fina, S., K. Rusche, and C. Gerten. 2018. “Indikatoren zur Abbildung der Gleichwertigkeit der Lebensverhältnisse in deutschen Stadtregionen.” In Gleichwertige Lebensverhältnisse im Spiegel demografischer Indikatoren. Welche Indikatoren sind relevant und welche Ausprägungen/Schwellen zeigen die Verletzung gleichwertiger Lebensverhältnisse an? DGD/BBSR-Dezembertagung 2017, edited by S. Maretzke, 14–31. Bonn.
- Friedrich, M., J. Birkmann, S. Fina, S. Rönsch, D. Feldmeyer, D. Vallée, and G. Janssen. 2017. Überprüfung und Weiterentwicklung des Instrumentariums zur Koordination von Siedlungs- und Verkehrsentwicklung vor dem Hintergrund erforderlicher CO2-Reduktion und der demografischen Entwicklung für die Region Stuttgart. Stuttgart: Verband Region Stuttgart.
- García-Albertos, P., M. Picornell, M. H. Salas-Olmedo, and J. Gutiérrez. 2018. “Exploring the Potential of Mobile Phone Records and Online Route Planners for Dynamic Accessibility Analysis.” Transportation Research Part A: Policy and Practice. doi:10.1016/j.tra.2018.02.008.
- Gregersen, F. A., and E. B. Lunke. 2018. The Application of Cellular Network Data for Travel Behavior Research (No. 1657/2018).
- Hamilton, Bruce W., and Ailsa Röell. 1982. “Wasteful Commuting.” Journal of Political Economy 90 (5): 1035–1053. doi: 10.1086/261107
- Huang, Haosheng, Yi Cheng, and Robert Weibel. 2019. “Transport Mode Detection Based on Mobile Phone Network Data. A Systematic Review.” Transportation Research Part C: Emerging Technologies 101: 297–312. doi: 10.1016/j.trc.2019.02.008
- Keim, D. A., J. Kohlhammer, G. Ellis, and F. Mansmann. 2010. Mastering the Information Age-Solving Problems with Visual Analytics. Konstanz: Florian Mansmann.
- Kitchin, R. 2014. The Data Revolution. Big Data, Open Data, Data Infrastructures and Their Consequences. London: Sage.
- Louail, T., M. Lenormand, O. G. C. Ros, M. Picornell, R. Herranz, E. Frias-Martinez, J. J. Ramasco, and M. Barthelemy. 2014. From Mobile Phone Data to the Spatial Structure of Cities.” Scientific Reports 4. Accessed October 20, 2020. https://www.nature.com/articles/srep05276.
- Nobis, C., and T. Kuhnimhof. 2018. Mobilität in Deutschland - MiD Ergebnisbericht. Studie von infas, DLR, IVT und infas 360 im Auftrag des Bundesministers für Verkehr und digitale Infrastruktur (FE-Nr. 70.904/15). Bonn. Accessed August 29, 2019. www.mobilitaet-in-deutschland.de.
- Ramm, F. 2019. OpenStreetMap in Layered GIS Format (Version 0.7.7-2019-05-13). Accessed August 20, 2019. https://www.geofabrik.de/data/geofabrik-osm-gis-standard-0.7.pdf.
- Sagl, G., M. Loidl, and E. Beinat. 2012. “A Visual Analytics Approach for Extracting Spatio-Temporal Urban Mobility Information from Mobile Network Traffic.” ISPRS International Journal of Geo-Information 1 (3): 256–271. doi: 10.3390/ijgi1030256
- Senaratne, H., Mobasheri, A., Loai, A., Capineri C., and H. Mordechai. 2017. “A Review of Volunteered Geographic Information Quality Assessment Methods.” International Journal of Geographical Information Science 31 (1): 139–167. doi:10.1080/13658816.2016.1189556.
- Sobral, T., T. Dias, and J. Borges. 2019. “Visualization of Urban Mobility Data from Intelligent Transportation Systems.” Sensors 19: 332. doi:10.3390/s19020332.
- Statista. 2020. Anzahl der Mobilfunkanschlüsse in Deutschland von 1992 bis 2019. Accessed October 20, 2020. https://de.statista.com/statistik/daten/studie/3907/umfrage/mobilfunkanschluesse-in-deutschland/#professional.
- Telefónica NEXT. 2018.Telefónica NEXT brings data analysis to life: How Germany moves. Accessed May 29, 2019. https://next.Telefónica.de/loesungen/transport-analytics.
- Tolouei, R., P. Álvarez, and N. Duduta. 2015. “Developing and Verifying Origin-Destination Matrices Using Mobile Phone Data: The Llitm Case". Proceedings of the European Transport Conference 2015. Frankfurt am Main.
- Toole, J. L., S. Colak, B. Sturt, L. P. Alexander, A. Evsukoff, and M. C. González. 2015. “The Path Most Traveled: Travel Demand Estimation Using Big Data Resources.” Transportation Research Part C: Emerging Technologies 58: 162–177. doi: 10.1016/j.trc.2015.04.022
- Verband Region Stuttgart. 2010. Regionalplan. Stuttgart: Verband Region Stuttgart.
- Wang, Z., S. He, and Y. Leung. 2018. “Applying Mobile Phone Data to Travel Behaviour Research. A Literature Review.” Travel Behaviour and Society 11: 141–155. doi: 10.1016/j.tbs.2017.02.005
- Wikipedia Contributors. 2019. “North Rhine-Westphalia.” In Wikipedia, The Free Encyclopedia, May 1. Accessed May 2, 2019. https://en.wikipedia.org/w/index.php?title=North_Rhine-Westphalia&oldid=895023003.
- Williams, N. E., T. A. Thomas, M. Dunbar, N. Eagle, and A. Dobra. 2015. “Measures of Human Mobility Using Mobile Phone Records Enhanced with GIS Data.” PloS one 10 (7): e0133630. doi: 10.1371/journal.pone.0133630
- Yang, X., Z. Fang, L. Yin, J. Li, Y. Zhou, and S. Lu. 2018. “Understanding the Spatial Structure of Urban Commuting Using Mobile Phone Location Data: A Case Study of Shenzhen, China.” Sustainability 10 (5): 1435. doi: 10.3390/su10051435
- Zheng, Y., W. Wu, Y. Chen, H. Qu, and L. M. Ni. 2016. “Visual Analytics in Urban Computing: An Overview.” IEEE Transactions on Big Data 2 (3): 276–296. doi: 10.1109/TBDATA.2016.2586447
- Zilske, M., A. Neumann, and K. Nagel. 2015. “OpenStreetMap for Traffic Simulation.” In Proceedings of the 1st European State of the Map: OpenStreetMap Conference, 126–134. Wien: OpenStreetMap Austria u.a.