
 ?Mathematical formulae have been encoded as MathML and are displayed in this HTML version using MathJax in order to improve their display. Uncheck the box to turn MathJax off. This feature requires Javascript. Click on a formula to zoom.
ABSTRACT
Updating an authoritative Land Use and Land Cover (LULC) database requires many resources. Volunteered geographic information (VGI) involves citizens in the collection of data about their spatial environment. There is a growing interest in using existing VGI to update authoritative databases. This paper presents a framework aimed at integrating multi-source VGI based on a data fusion technique, in order to update an authoritative land use database. Each VGI data source is considered to be an independent source of information, which is fused together using Dempster-Shafer Theory (DST). The framework is tested in the updating of the authoritative land use data produced by the French National Mapping Agency. Four data sets were collected from several in-situ and remote campaigns run between 2018 and 2020 by contributors with varying profiles. The data fusion approach achieved an overall accuracy of 85.6% for the 144 features having at least two contributions when the confidence threshold was set to 0.05. Despite the heterogeneity and limited amount of VGI used, the results are promising, with 99% of the LU polygons updated or enriched. These results show the potential of using multi-source VGI to update or enrich authoritative LU data and potentially LULC data more generally.
1. Introduction
In Europe, many efforts have been made to provide new, open sources of Earth Observation data (e.g. from the Sentinel satellites) and to use remote sensing to produce authoritative Land Use and Land Cover (LULC) data sets. At the pan-European level, common initiatives that span EU countries include the CORINE Land Cover (CLC) inventory (EEA Citation2006) and the Urban Atlas (UA) (EEA Citation2011), which are produced as part of the Copernicus land monitoring service. Within European countries, many efforts have been made to produce national LULC maps by authoritative bodies, in particular by National Mapping Agencies (NMAs). The increasing demand for data on LULC at fine spatial and temporal resolutions has become challenging for NMAs as their resources for collecting, processing and updating information have remained constant or even decreased over time. There is, therefore, considerable interest in using Volunteered Geographic Information (VGI) (Goodchild Citation2007) as an alternative source of data. At present, more and more NMAs are engaging with VGI. However, it has been observed that most of the NMAs that use VGI prefer not to rely too much on this information, but would rather keep organizing and collecting information with their own specifications (Olteanu-Raimond et al. Citation2017a; Olteanu-Raimond et al. Citation2017b). The review undertaken by Olteanu-Raimond et al. (Citation2017a) showed that most of the VGI used by NMAs concerned topographic database objects such as buildings, roads and names.
In general, there are numerous challenges in the use of VGI in producing or updating LULC data. First, even if some definitions exist for land cover (i.e. the biophysical surface cover of the Earth) and land use (i.e. the way in which the land is used by humans), there is still confusion between the allocation of land cover and land use values in existing LULC databases (Comber Citation2008). For example, in the CLC data, there are mixed classes such as the land cover classes 1.2-Industrial, commercial and transport units and 1.1 Urban fabric, where the first is land use whereas the second is land cover because it indicates that the area is a built-up area. Secondly, different nomenclatures exist for LULC such as CLC (EEA Citation2006), UA (EEA Citation2011), LUCAS (EEA Citation2011), INSPIRE (Infrastructure for Spatial Information in the European Community) (EEA Citation2011) and CNIG (National Council of Geographic Information) (CNIG Citation2014). These nomenclatures are often a compromise between an ideal set of classes and the classes that can reasonably be mapped. Although some recent efforts have focused on establishing links between different nomenclatures (Arnold et al. Citation2020; Fonte et al. Citation2017b; Schultz et al. Citation2017), choosing the most appropriate LU or LC class using one of the existing nomenclatures for an area of land and defining the best overall classification to use remain complex tasks. These tasks depend on both the desired thematic level of detail of the nomenclature and on the minimum mapping unit (MMU). Third, LULC data are often made available as vector data sets in which the space is divided into non-overlapping polygons that are associated with a class label describing the corresponding LULC. For some LULC databases, land use labels are well distinguished from land cover values (e.g. LUCAS; UA), whereas for others (e.g. CLC), land cover and some land use elements are mixed (e.g. the LULC class of dense urban area), but such an issue is also related to the generalization level of the database and to its cartographic scale. The fourth challenge concerns the temporal resolution, since authoritative LULC data are generally updated at regular time intervals (e.g. every six years for CLC and UA). This temporal resolution does not always meet the needs of the users. The automatic production of LULC products from remote sensing data (e.g. using Sentinel time series) has been proposed to fill this need, but the quality of automated products is not necessarily suitable for authoritative purposes. Having up-to-date data is, indeed, the second need expressed by end users after spatial accuracy (Olteanu-Raimond et al. Citation2017a). Annual updated data are necessary to compute annual or multi-year indicators, for instance, to monitor increases in soil sealing, housing supply and agricultural land use. While VGI has already been used for map validation (Foody and Boyd Citation2013; Fonte et al. Citation2015; Fritz et al. Citation2015) and to produce LULC data (Fonte et al. Citation2017b; Schultz et al. Citation2017), using VGI to update authoritative LULC data is a new area of investigation.
Thus, the goal of this paper is to demonstrate the potential of VGI for improving authoritative LU data. This research introduces a data fusion-based framework to update an authoritative land use database by integrating multi-source VGI. The paper is structured as follows. Section 2 focuses on the state of the art in LULC updating, VGI initiatives and data-fusion techniques. Section 3 presents both the authoritative LULC data and different types of VGI used in this paper. Section 4 summarizes the principles of the Dempster-Shafer Theory (DST) followed by the proposed workflow in section 5. Section 6 presents the results while the conclusions and future work are synthesized in Section 7.
2. State of the art
How to keep LULC products up-to-date and to derive information about LULC change are important areas of research interest. The regular production of measures of change are required to monitor anthropogenic and natural phenomena, providing key information for public policies. Hence, there is a growing need to enhance the update cycle frequency, e.g. to reach the goal of yearly updates, now theoretically possible thanks to the advent of unprecedented Earth Observation satellite capabilities.
However, authoritative LULC products are generally updated through manual change detection and photo-interpretation to ensure that their quality meets the required specifications. This is an expensive and time-consuming process, which is, hence, not suitable for high frequency (i.e. yearly) updates. Some mapping agencies have established partnerships with other authoritative institutes to obtain information about changes, but such approaches have limitations. For instance, in France, these processes are well-tailored for certain themes such as roads, but they can be inadequate for others such as buildings and natural themes. As a consequence, a more automatic means of change detection is required, exploiting auxiliary databases and remote sensing data. Such (semi-)automatic processes would launch ‘alerts’ (where change hypotheses have been detected) and send these to an operator to be checked. They must be very exhaustive and as correct as possible (i.e. to minimize the number of false detections).
It should also be noted that remote sensing is generally more suitable to land cover analysis than to the automatic classification of land use. For instance, one can easily identify a woody area from remote sensing, but it is more difficult to decide whether it is dedicated to leisure activities or used for timber harvesting.
2.1. Remote sensing change detection
Traditional ways of updating the authoritative LULC data by NMAs rely heavily on field surveys and remotely sensed data. In the case of field surveys, they are generally carried out based on new information derived from local authorities (e.g. the official publication of the construction of a new subdivision) and remotely detected changes (e.g. from images). Remote sensing has the potential to distinguish between different land features by taking advantage of the spectral, spatial and temporal characteristics of the data. It provides a cost-effective way to map and monitor LULC change (Rogan and Chen Citation2004). Many remote sensing-based change detection approaches have been proposed (Singh Citation1989; Lu, Li, and Moran Citation2014). The ones dedicated to very high-resolution databases are often applied only to specific topographic objects (e.g. roads, buildings) in the specific context of updating topographic databases, i.e. they generally require very high spatial resolution (aerial or satellite) remote sensing data. Other change detection approaches are more generic (i.e. they are unsupervised approaches that automatically identify different kinds of behaviours across time in the remote sensing data, and detect some of them as changes) but have generally been applied to remote sensing at a lower spatial resolution, which has other types of spectral and/or temporal characteristics of interest.
When updating LULC using multi-temporal data, two types of approaches are used: (1) a post-classification comparison; and (2) change detection algorithms applied to raw remote sensing data (after atmospheric and other corrections). The post-classification comparison is a popular approach for updating an existing LULC map: remote sensing data are classified to obtain a LULC map for a given year or time period, which is then compared to the LULC map classified with remote sensing data from another time period or year, often more recent in time. This approach has been widely used (e.g. Domenech and Mallet Citation2014; Du et al. Citation2013; Gladstone, Gardiner, and Holland Citation2012; Gressin et al. Citation2014; Keinan et al. Citation2016; Le Bris and Chehata Citation2011; Matikainen et al. Citation2010; Poulain et al. Citation2009; Rottensteiner et al. Citation2007). When focusing on urban areas, such a process is often applied to very high resolution satellite or aerial optical images and digital surface models (DSMs) to detect changes in buildings and to update the topographic database. However, this strategy has also been applied to other themes (e.g. roads, vegetation). In this database updating context, the existing LULC map can be used as a training data set as long as the proportion of change remains small. Indeed, tremendous research efforts have been made in developing automatic LULC classification methods including Independent Component Analysis, K-Nearest Neighbour, Support Vector Machines, Decision Trees and Random Forests (Inglada et al. Citation2017; Halmy et al. Citation2015; Ohki and Shimada Citation2018; Tehrany, Pradhan, and Jebuv Citation2014; Namdar et al. Citation2014). Ancillary data including climatic and topographic information are often considered to better distinguish between different land features (Saadat et al. Citation2011; Halmy et al. Citation2015). An automatic classification chain has been proposed to classify multi-spectral and multi-temporal remote sensing imagery from different sensor types (Huth et al. Citation2012), which allows for both pixel and object-based classification. With rapid developments in deep learning, a Joint Deep Learning (JDL) framework incorporating a multilayer perceptron (MLP) and a convolutional neural network (CNN) has been demonstrated to perform well in classifying LC and LU in a unified framework by jointly learning hierarchical representations (Zhang et al. Citation2019).
Alternatives to post-classification change detection are methods based on the comparison of raw remote sensing data (i.e. optical, DSMs, radar) at two epochs to detect changes where they exhibit important differences. Image differencing is a simple and easy-to-use technique by directly comparing pixel values on imagery obtained from different dates (Muttitanon and Tripathi Citation2005). However, image radiometry comparison at pixel level often leads to noisy results. Therefore, other raw image comparison methods use texture information instead, e.g. by computing mutual information between images at two epochs over wider windows (Gueguen, Soille, and Pesaresi Citation2011; Molina et al. Citation2016). DSM comparison is a specific case among these raw data comparison approaches: it is easier to use in operational situations due to the physical meaning of height differences, and then to define realistic and stable thresholds or to derive change probabilities (Chaabouni-Chouayakh et al. Citation2010; Guerin, Binet, and Pierrot-Deseilligny Citation2014; Champion et al. Citation2010). In addition, the shape of change alerts can be considered.
Previous raw data comparison approaches have generated change indices that can be quite difficult to exploit efficiently. Other raw data comparison approaches aim to characterize different kinds of transitions, including changes. Most of them rely on the change vector analysis (CVA) paradigm that can be applied to image time series containing more than two epochs (Liu et al. Citation2015; Bovolo, Bruzzone, and Marconcini Citation2007; Liu et al. Citation2014). This approach consists of calculating differences between (multispectral) image values at different epochs to obtain the change vectors between them (Singh Citation1989). A more in-depth analysis of these vectors is then done in another space, clustering them into different categories to identify different characteristic temporal behaviours, i.e. different transition types. It is then possible to identify the transitions corresponding to interesting changes between them. Several variants of the original approach have been proposed (Liu et al. Citation2015; Bruzzone and Serpico Citation1997; Bovolo, Bruzzone, and Marconcini Citation2007). Thus, CVA and post-classification comparison are conventionally adopted to identify changes (Liu and Zhou Citation2004; Olteanu-Raimond et al. Citation2020a).
More recently, deep learning has been proposed for change detection (Lebedev et al. Citation2018). For example, end-to-end deep learning CNNs have been trained to generate change maps. In contrast to previous approaches, only training examples of the changes to be detected are required, with no need to provide all possible transitions. Generic change detection architectures have been proposed, such as ChangeNet based on a Siamese architecture (Varghese et al. Citation2018). Many deep learning-based architectures dedicated to remote sensing data have been proposed in the last two years (Papadomanolaki et al. Citation2019; Daudt et al. Citation2019; Daudt et al. Citation2018; Peng, Zhang, and Guan Citation2019; Lebedev et al. Citation2018). Some of them are specifically dedicated to detecting change from Sentinel-2 images (Papadomanolaki et al. Citation2019; Peng, Zhang, and Guan Citation2019). Accurately updating LULC vector databases is not an easy task, as the aforementioned automatic methods will inevitably generate false changes. Detected uncertainty features could be further visually inspected and approved using expert knowledge. In producing the database with 23 LULC classes in the Mexican state of Michoacan, a density function was adopted to calculate the probability that each segment belonged to a certain LULC class, enabling the photo-interpreter to focus on the areas likely to have changed (Mas et al. Citation2017).
2.2. VGI to update LULC databases
In recent years, VGI has emerged as a new source of data for mapping (Arsanjani et al. Citation2013; Estima and Painho Citation2013; Fonte et al. Citation2017b), enriching (Fonte et al. Citation2017a; Schultz et al. Citation2017) or validating (Zhao et al. Citation2017; Fonte and Martinho Citation2017) LULC data. Although many VGI studies related to LULC have been based on data from OpenStreetMap (OSM), other types of VGI such as Flick’r photographs and tags (Sitthi et al. Citation2016; Yan, Schultz, and Zipf Citation2019) or collected through different collaborative platforms (Foody and Boyd Citation2013; Zhao et al. Citation2017; See et al. Citation2015) have also been used.
Pioneering work in deriving LULC object-based maps was undertaken by Estima and Painho (Citation2013), who proposed a method to derive LU maps from OSM data by using a hierarchical decision tree approach. Similar research was then proposed by Fonte et al. (Citation2017b) and Arsanjani et al. (Citation2013) to derive LULC vector data and LU vector data from OSM data, respectively. Although much progress has been made, the LU classification used was coarse, for instance, industrial, commercial, public, military, private and transport were aggregated into one LU class (corresponding to level 2 of the Urban Atlas nomenclature). Moreover, using OSM data to produce multi-date LULC and to measure the evolution of two snapshots is a challenge since OSM features can change over time but it is not possible to identify if a feature was edited because of an actual change or was simply an improvement to the spatial or thematic quality of the map.
Fonte et al. (Citation2017a) investigated the potential of OSM data to update and enhance the authoritative GlobeLand30 LULC data set. Based on the approaches described above, they rasterized the LULC data derived from OSM using the same pixel resolution as the authoritative data. GlobeLand30 was then updated by identifying the homologous pixels between GlobeLand30 and the OSM LULC map and transferring to each GlobeLand30 pixel, the LULC class from the OSM LULC map, where available. The nomenclature of GlobeLand30 was enhanced due to the more detailed nomenclature of the OSM LULC map, particularly in urban areas. Where no OSM LULC class was available, GlobeLand30 was not updated. An accuracy assessment showed improvements in the final fused OSM/GlobeLand30 LULC map.
In the VGI field, when many volunteers are involved, the same feature can be edited or visited several times and by different people, resulting in more confident or complementary information (e.g. Haklay et al. Citation2010) but also in potentially conflicting information since the volunteers may not be familiar with concepts such as LULC or the difference between LU and LC as already found in a study by Comber, Richard Wadsworth, and Fisher (Citation2008). However, there is much interest in combining VGI to take advantage of this complementary information, e.g. through data fusion, which takes these sorts of problems into account and provides a balanced solution. Methods such as geographically weighted regression (See et al. Citation2015) and Dempster-Shafer Theory (Comber, Law, and Lishman Citation2004; Comber, Wadsworth, and Fisher Citation2006; Ran et al. Citation2012) have been used in the literature. Comber et al. (Citation2016) compared Dempster-Shafer, Bayes, Fuzzy Sets and Possibility with the geographically weighted average to derive cropland classes. They concluded that the approaches that were based on a combination of evidence produced a better classification when there was ambiguity over the class conceptualization and/or where few VGI were available.
The main research questions of this paper are:
Is it possible to use VGI to improve the process of monitoring change? Monitoring change is a time-consuming and expensive task. Hence, detecting changes with automatic processes may be a relevant solution for reducing costs and increasing the frequency of updating.
How can we deal with improving mixed LU classifications that are currently inadequate for built-up areas? Can VGI enhance the LU classification by unmixing the LU classes with finer information?
How can we distinguish between meaningful and less meaningful changes in LULC mapping (e.g. a new house is built in an agricultural area but it may not change the LU or LC class depending on the spatial resolution of the LULC map)?
How can heterogeneous VGI sources be combined to enhance and update authoritative LULC data?
Similar to the work undertaken by Fonte and Martinho (Citation2017), our aim is to update and enhance the LU classification of IGN’s authoritative data set. Concerning the enrichment of the LU classification, our work is focused on built-up areas so that we can distinguish between residential, commercial, and industrial areas. Moreover, given the characteristics of the authoritative LULC data considered here, our approach is entirely feature-based.
In this research, we use Dempster-Shafer Theory (DST) to combine heterogenous VGI sources. One of the motivations is that the DST allows incompleteness, uncertainty and imprecision to be taken into account (Olteanu-Raimond, Mustiere, and Ruas Citation2015), and it can manage different types of values to make a final decision, generating confidence related to each value. In addition to studies involving LULC data, in the field of geographic information, DST has already been successfully applied in different applications such as data matching (Olteanu-Raimond, Mustiere, and Ruas Citation2015; Touya et al. Citation2017), image classification, and map matching (Nassreddine, Abdallah, and Denœux Citation2008; Royère, Gruyer, and Cherfaoui Citation2000).
3. Data sources
This section describes both the authoritative LULC data and the VGI collected during the different campaigns that was then used to update the authoritative LULC data.
3.1. OCS-GE, an authoritative LULC database and the challenge of updating
Recently, IGN (French National Mapping Agency) has started to produce an authoritative LULC feature-based data set at a regional scale called the Occupation du Sol à Grande Échelle (OCS-GE). This is an on-demand product. This means that there is no objective to cover the whole French territory, in contrast to the other databases produced by IGN, which have national coverage. OCS-GE is produced only when a local administrative entity needs these types of data. It relies on a common nomenclature (see Annex A) of distinct LU and LC classes, based on the CNIG (French National Committee of Geographic Information) specifications and is INSPIRE-compliant (INSPIRE Citation2013). For each interested region, the nomenclature can be adapted by taking the user needs of different stakeholders into account through a consultation process.
The land is divided into non-overlapping polygons, where each polygon feature is described by both LU and LC. The mapping is then made with respect to the data specifications (IGN Citation2015) including the nomenclature, rules, and thresholds of assignment. The mapping process is carried out in three steps. First, a backbone is generated from the network of main roads and railways. These cover the whole country and so provide a valid regional structure for the landscape that is relatively long-lasting and ensures the geometric consistency of the data over time. Secondly, polygons with distinct LU and LC values are computed using a semi-automated process by integrating several authoritative databases (e.g. topographic layers such as buildings, the secondary road network, etc., a forest layer, and a cadastral layer). Finally, a manual step based on photo-interpretation is undertaken to correct errors and fill in the gaps in terms of LU and LC values.
The OCS-GE data are updated on a three-year cycle corresponding to the time interval of the aerial orthophoto production. It was first generated in 2013, and then again in 2016. The next release is planned for the end of 2020. In the following, we refer to this data set as the authoritative LULC data.
Our study area is located in the city of Toulouse and its surroundings in the south of France (see ). This study area (1181 km²) contains 171621 LULC polygons. Three hierarchical levels are proposed for LC classes and four hierarchical levels for LU classes (IGN Citation2015). In total, the proposed nomenclature contains 17 LU classes and 14 LC classes (see Annex A). However, not every combination between LU and LC classes, i.e. 17 × 14, is possible. Two LULC data releases were made available and accessible on a free and open access basis under the terms of the open license Etalab 2.0: a 2013 snapshot (i.e. LULC data produced with respect to the orthophoto taken in 2013) and a 2016 snapshot shown in (i.e. LULC data produced with respect to the orthophoto taken in 2016).
Figure 1. Study area: Urban and peri-urban environment in Toulouse and its surroundings with a 2016 snapshot of the LULC.
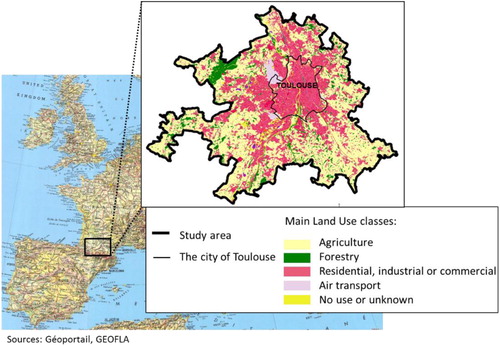
A certain number of challenges, especially related to LU classes, can be highlighted when mapping the authoritative LULC data. Indeed, due to the fact that LU values are mainly assigned to polygons using photo-interpretation, it is not always easy to determine the correct LU. Three main issues were identified and specified based on the needs of the end users:
The lack of information about the main building function in built-up areas, which means that in the existing topographic databases, the LU classes Industrial (LU2), Commercial and Services (LU3) and Residential (LU5) are grouped into one LU class: LU235, for both the 2013 and 2016 releases.
The assignment of the correct LU related to quarry and agricultural activities. Quarries mainly correspond to LC class LC1.1.2.1 (Areas with mineral materials). The LU class, which can be LU1.3 (Mining and quarrying), LU6 (Not currently used) or LU6.2 (Abandoned areas), may be difficult to assign without information about the current state of the quarry, i.e. is it active, closed or abandoned. Agricultural activities can be difficult to distinguish from other LU types. For example, in large farming areas containing cropland and unused vegetation or bare ground and several types of buildings, the LU class can be difficult to assess using photo-interpretation since it depends on the function of the buildings and the ground (e.g. is it residential, agricultural, touristic, etc.).
The time spent in monitoring changes. This task is mostly done manually in the field or by remote techniques and is very time-consuming.
3.2. Multi-source VGI
The VGI used in this research was collected within an H2020-funded project and is available on the Zenodo platform (Olteanu-Raimond et al. Citation2020b). It was collected through different data collection campaigns organized from 2018 to 2020. These campaigns were run to obtain in-situ data or to collect visual interpretations of remotely-sensed images regarding the current LU for the study site. Two protocols were proposed for these campaigns: one for data collection in the field, named the in-situ data collection campaigns, and the second on the desktop, called the online mapping campaigns. The tools that were used, i.e. the PAYSAGES mobile app (available in the Apple Appstore and the Google Playstore) and the Paysages web application (https://paysages.ign.fr/) as well as the design of the Toulouse pilot campaigns have been described in detail in Olteanu-Raimond et al. (Citation2018).
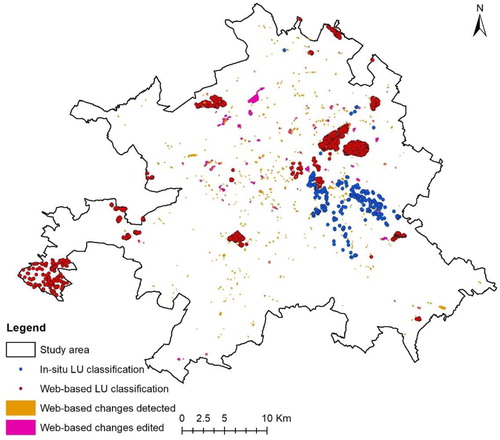
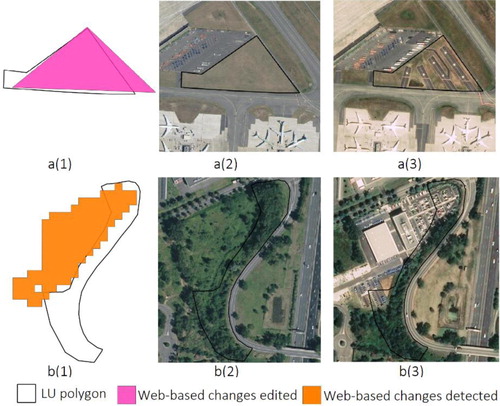
Four types of data were collected: (1) Multiple observations of LULC change detected via the web-based application (Web-based changes detected); (2) Single observations of change edited by the users via the web-based application (Web-based changes edited); (3) Single observations of LU classification obtained from the web-based application (Web-based LU classification); and (4) Multiple observations of LU classifications obtained from the mobile application (In-situ LU classification). shows the spatial distribution of the four types of VGI collected in the study area.
Figure 2. The spatial distribution of multi-source VGI collected in the study area
3.2.1. Web-based changes detected
A change detection (CD) algorithm based on Sentinel-2 time series was applied to the study area for the time interval 2016–2019 (Olteanu-Raimond et al. Citation2020a). The algorithm detects new construction sites represented by polygons. More details about how the polygons are obtained from Sentinel time series data and the accuracy of the algorithm can be found in Olteanu-Raimond et al. (Citation2020a).
All the 650 change polygons were validated by different profiles of contributors (i.e. students, citizens, staff from local authorities, researchers) during the organized mapathons in 2019. High resolution (20-50 cm) orthophotos captured in 2016 and 2019 were provided as base maps to help in the validation task. Contributors were asked to label each change by choosing one label among the list of values: Residential, Industrial, Infrastructure, Construction in progress, Other, No change (i.e. invalidate the change), and I do not know (i.e. allow the location to be skipped if the contributors are not able to assess the correct label or had any uncertainties).
Overall, 105 contributors were involved in the mapathons, producing a total of 2778 observations. An observation is defined here as a piece of information provided by a contributor about a location (e.g. a change polygon). Each change was labeled by between 3 and 6 contributors during the mapathons, with most sites labelled by 4 contributors.
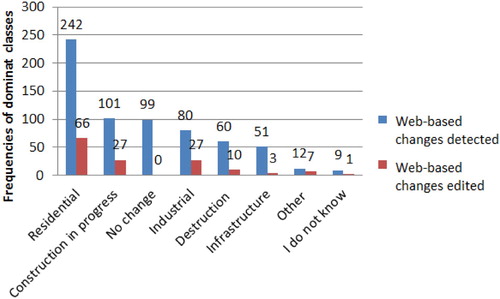
The multiple observations were then used to define the final change classification. More precisely, the most commonly chosen label (i.e. the dominant one) was assigned to each detected change. If there was a tie, the label for the detected change was randomly allocated to one of the labels involved in the tie. (blue bins) illustrates the distribution of these dominant labels per detected change. One can observe that most of the labels (n=555) are real changes and n=99 are commissions (i.e. detected changes assigned to the label No change, which means that no change occurred in the real world at that location). Note that locations where the dominant label is No change or I do not know, are not used in this research. Thus, after filtering these two classes, the framework used 633 labelled changes.
Figure 3. Classification of change detection observations: dominant label from contributors for web-based changes detected (blue bins) and web-based changes edited (red bins)
3.2.2. Web-based changes edited
Another category of change was captured in the polygons edited by five experts in LULC data from the Urban Planning Agency from Toulouse during a mapathon using the Paysages web-based application. Using the automatically detected changes from the CD algorithm, orthophotos from 2016 to 2019, and their local knowledge, the experts were able to edit 142 polygons (2.85 km2) representing changes that were not detected by the CD algorithm. Orthophotos from 2019 were used to edit the boundaries of these changes.
The classification of changes was done manually by the same experts using the same list of labels as described in Section 3.2.1. As shown in (red bins), most of the edited changes are classified as Residential (n=66), Industrial (n=27), and Construction in progress (n=27). Construction in progress was used for the automatically detected changes to capture changes that are occurring over a long period of time and hence their final nature may not be apparent until the end of the construction period.
As stated above, for this type of VGI, there are no multiple observations.
3.2.3. Web-based LU classification
As described in Section 3.1, one of the issues with the authoritative LULC data is the combined classification of Residential, Commercial and Industrial LU classes into a single class. To deal with this issue, an online mapping campaign was organized in August 2019. The campaign involved staff from public authorities. In the study area, all features with the LU235 class were selected and imported in the Paysages application. High resolution (20–50 cm) orthophotos from 2016 and 2019, as well as a relevant Points of Interest layer from IGN, were provided as base maps to help with the validation task. During the campaigns, the contributors used their local knowledge and Google Street View in case of confusion. They were asked to label each feature by choosing one LU class among the list of values: Industrial (LU2), Commercial (LU3), Industrial or Commercial (LU23), Residential (LU5), Industrial, Commercial, or Residential (LU235), Other, and Unknown.
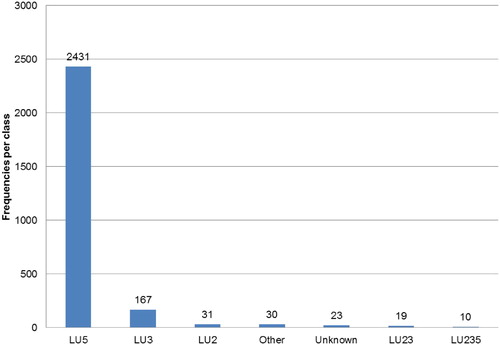
In total, 2711 features were classified by 5 contributors, resulting in 2711 observations, so only one observation per feature was available for this type of VGI. As one can see from , most of the features were classified as Residential (2431 features with LU5), followed by Industrial areas (167 features). Among the classified features, ten of them were still classified as LU235, showing that in some mixed areas, the contributors were not able to make a finer LU classification from the sources of information available to them.
Figure 4. Distribution of LU classification chosen by contributors during the online mapping campaign
3.2.4. In-situ LU classification
The in-situ campaign was carried out using the PAYSAGES mobile application. The contributors were asked to visit highlighted locations (points) corresponding to features in the authoritative LULC data set and to provide feedback with respect to four aims:
Update the status of the LU corresponding to quarries by indicating the status of a quarry as active, closed or abandoned. This status allows the mining activity (LU1.3) to be confirmed or to update the LU of the polygons to LU6.3 (Not currently used) or LU6.2 (Abandoned area).
Update the construction area LU polygons. This task concerned LU classes containing Construction in progress. If the construction work was finished, the contributors were asked to update the LU class as well as the LC class if this had changed. The LU and LC labels were chosen from a list of predefined values that are consistent with the authoritative LULC nomenclature.
Improve the information about the agricultural LU polygons. This task dealt with locations classified as agricultural for the LU and woodland or herbaceous for LC. The goal was to indicate if the polygon belonged to an Agricultural (LU1.1), Residential (LU5) or mixed (Residential and Agricultural) LU type.
Change detection validation. For the locations where a change was detected, contributors were asked to confirm if a change had really occurred at the given location, and if so, to fill in the new LU type from a predefined list of labels.
In total, 304 locations were visited in the field and 369 observations were collected by 36 contributors having different backgrounds (i.e. students and staff from local authorities). Note that this type of VGI is represented by points and contains multiple observations. Each point is linked to a polygon in the authoritative LULC data set.
A synthesis of the different types of data used in this research is presented in . It summarizes the authoritative LU data to be updated and the various pieces of information used to update it: CD data and the four campaigns for VGI collection.
Table 1. A synthesis of data used in the present study.
4. Theoretical concepts of the Dempster-Shafer Theory
This section describes the theoretical concepts of the Dempster-Shafer Theory (DST) that are necessary for understanding the data fusion approach used in this paper.
The solutions to a given problem are defined in the framework of the DST as a finite set of N singleton hypotheses, called the frame of discernment, as defined in Equation (1):
(1)
(1) where
represents a singleton hypothesis.
Starting from the frame of discernment, the power set of , denoted
, represents the set of all possible combinations of the singleton hypotheses and is defined by the following:
(2)
(2) where
is an example of a subset representing the proposition
. This can be interpreted as an uncertainty of the solution (i.e. the solution to the problem is either
or
).
A relevant concept in the DST framework is the basic belief assignment (bba), which is a function that assigns to each propositiona mass of belief, denoted as
. The mass of belief represents how much belief there is in a given source of information.
A basic belief assignment is a function such that:
(3)
(3)
Another key point in the DST is the source of information. The source of information is based on a set of data, and it models the knowledge regarding the problem being solved with respect to the input data. Many sources of information can be considered in the decision process. For example, in remote sensing, different sensors can be considered as different sources of information (Lefevre, Colot, and Vannoorenberghe Citation2002) while in GIS, each of the thematic attributes of a spatial feature can be considered as a source of information (Olteanu-Raimond, Mustiere, and Ruas Citation2015). The DST can also cope with partly missing data.
One of the tools that allows for the fusion of different sources of information is the conjunctive Dempster’s rule (Dempster Citation1967), defined in Equation (4). Let us consider and
as two sources of information. Each source supports the propositions
with a mass of belief,
and
, respectively. The mass of belief resulting from the combination of the two sources by the Dempster’s rule that supports the same proposition
is denoted by
:
(4)
(4)
The conjunctive rule determines a new mass of belief expressing the combination of beliefs coming from two sources of information. It is important to mention that the combination of different masses of belief can generate conflict, represented by the denominator of Equation (4). In the Dempster-Shafer operator, the conflict (i.e. the mass of belief assigned to the empty set) is distributed among all combined masses of belief by dividing the combined masses of belief by the conflict.
Once the sources of information are merged, a decision among propositions is made. Different decision rules are proposed in the literature such as the maximum plausibility, credibility or the pignistic probability (PP). More details about the decision rules can be found in Smets and Kennes (Citation1994). Here, only the pignistic probability is defined (since it was chosen in our approach to favor single hypotheses) as:
(5)
(5) where
represents the number of singleton hypotheses contained in proposition B.
5. The framework for integrating multi-source VGI into an authoritative database
The goal is to define a framework to update an existing LU database (at time ) to an updated version of this LU database (at time
) by using VGI that contains changes that occurred during the period
. Our core hypothesis is that if information exists about the change of a feature, then the updating process should be able to decide whether an update should be made and how (i.e. which LU class). In contrast, if there is no information available, then the feature is not updated, even though this does not mean that change has not occurred in the real world. The VGI collected here corresponds to different types of geometry (points and polygons) and with different ways of capturing change information. To integrate the different data sets and hence potentially different pieces of information about LU, a data fusion approach using DST is proposed.
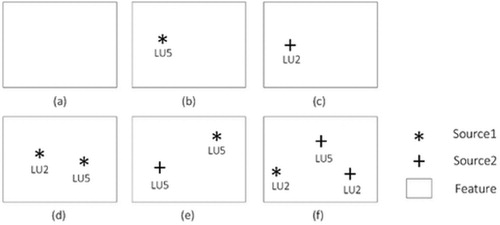
For each feature (e.g. LU polygon) from the authoritative LU data, the first step is to determine whether there are changes highlighted by different data sources that represent validated VGI. In the present case study, there are 4 data sources listed in Section 3. Thus, each feature is characterized by zero, one or more observations coming from data sources as illustrated in . For example, a feature in (f) is characterized by three observations from two data sources: Source 1 and Source 2. Source 1 contributes with one observation having the LU2 (Industrial use) label. Source 2 contributes with another two observations having two different LU labels: LU2-Industrial use and LU5-Residential use.
Figure 5. Illustration of six LU features characterized by (a) zero, (b) (c) one, (d) (e) two or (f) more observations coming from two data sources: Source 1 and Source 2. LU2 and LU5 refer to industrial use and residential use, respectively.
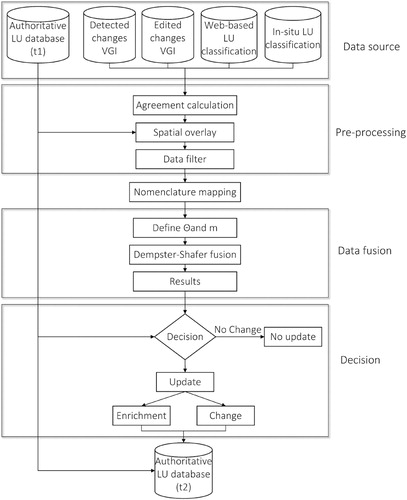
The proposed workflow for updating authoritative LULC data is illustrated in . It is composed of four main steps: pre-processing, nomenclature mapping, data fusion and final decision. The input data are first analyzed and enriched during the pre-processing step, which includes the calculation of agreement between spatially close data including observations about the same feature, the characterization of spatial overlap, and data filtering. Secondly, the mapping between the nomenclature of VGI data sources and authoritative LU data is defined. Then, the different inputs coming from the multi-source VGI are fused under the framework of DST. Finally, the update decision is made by comparing the DST-derived results with the 2016 authoritative LU data.
Figure 6. The workflow for updating authoritative LU data based on a multiple-source information fusion approach.
5.1. Data pre-processing
This step comprises three computations: agreement, spatial overlap, and data filtering. These operations are applied to the VGI data corresponding to the web-based observations presented in sections 3.2.1 and 3.2.2 (but not the enrichment data presented in section 3.2.3 or the in-situ data presented in 3.2.4, where each point location corresponds to the centroid of the initial LULC authoritative polygon).
For a single data source, there are potentially several observations corresponding to a feature. For each detected LU polygon, the most frequently observed label in the answers provided by the contributors is allocated to that polygon. In the case of a tie, such as having four contributors when two say LU1 and two say LU2, the label is decided randomly. Contributor agreement is calculated for the most frequently observed label. To clarify, the agreement here is a simple measure to describe how strongly contributors agree with the single label aggregated by multiple observations. The contributor agreement is computed for each change that has multiple validations by using the Fleiss Kappa (Fleiss Citation1971). The value is between 0 and 1. More details about the change detection validation and the computation of the contributor agreement are described in Olteanu-Raimond et al. (Citation2020b).
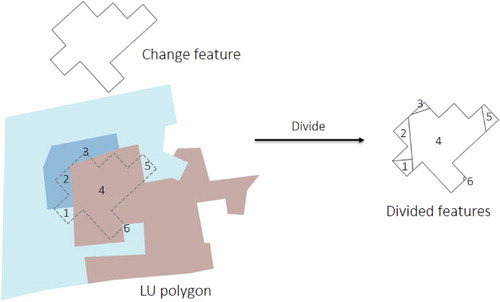
The next step, i.e. the spatial overlay, solves issues due to overlaps between features representing changes and LU polygons. For example, cases where a change feature overlaps several LU polygons may occur. To solve this issue, each polygon intersecting several LU polygons is split into several parts with respect to the boundaries of the LU polygon. This process is illustrated in , where the dashed polygon represents the initial geometry and location of the change feature and intersects three different LU polygons represented respectively in red, light blue and dark blue colors. The output corresponds to six divided features as indicated in (on the right). The agreement value is then transferred from the original change feature to the divided features. In this process, we ensure that one divided feature representing change is associated to only one single LU polygon. If several divided change features have the same label within the same LU polygon, for example, divided polygons 1, 5, and 6 in , these change polygons will be viewed as one object having the same change information, and then the agreement values are averaged. Thus, there are no duplicate change labels for updating within the same LU polygon.
Figure 7. Example of managing overlaps between LU polygons and polygons derived from the change detection (CD) algorithm.
The third step is data filtering. Three filters are defined as: geometry-, agreement- and label-based. First, we observed that the geometry of most detected changes is inaccurate, the limits of the change are underestimated, and only one part of the change has been detected. Thus, small divided CD polygons may contain misleading change information. As shown in (a), a new residential building (in green) is detected by the CD algorithm. However, the CD polygon does not represent the shape of the building very well and a part of it overlaps the neighboring road. After the splitting step, there are two small polygons representing residential change for the road, which is obviously incorrect (shown with small polygons highlighted by red circles). An area threshold is used to exclude such small polygons. In the current study, if the area is less than 10 m² or the ratio of the areas of the CD polygon and the corresponding LU polygon is lower than 0.001, the CD polygon will not be considered for further processing.
Figure 8. Examples of data filtering. (a) Geometry filtering (e.g. small divided CD polygons that overlap a road and contain potentially misleading change information); (b) Agreement filtering (e.g. CD polygon with an agreement value equal to 0); (c) Label-based filtering (e.g. a CD polygon with the label equal to ‘No change’)
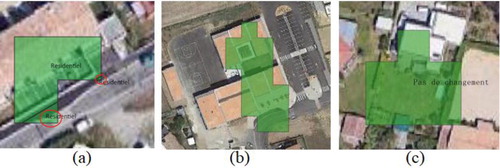
Secondly, the agreement value assigned to each change feature is also used to filter the data. If the agreement is lower than a threshold, the features are not considered further. In the present workflow, the agreement threshold was empirically set to 0.33. Such a case is illustrated in (b), where the CD polygon will be filtered since its agreement is 0 (i.e. the three contributors disagree), choosing different labels: Other, No change and Industrial, respectively. Finally, the label value is considered. If the change label does not match the classes in the authoritative LU nomenclature, such as, No change and ‘I don’t know’ labels, the corresponding features will also be filtered. This case is illustrated in (c), where the label of the feature is No change.
5.2. Nomenclature mapping
The goal of this step is to update the LULC authoritative data; thus, labels assigned by the contributors should be translated to be comparable with the authoritative data. For the web-based LU classification and the in-situ LU classification, users choose values of LU that correspond to the correct nomenclature so no further nomenclature mapping is required. For change features, the values are mapped as indicated in .
Table 2. Mapping labels of change features into the OCS-GE LU nomenclature.
5.3. Data fusion via Dempster-Shafer Theory
After data pre-processing, DST is employed to fuse the multi-source VGI for each LU polygon and to decide on the final value to be assigned to it. In this framework, four data sources are used for fusion: Web-based changes detected, Web-based changes edited, Web-based LU classification and In-situ LU classification. It should be noted that these data sources are independent, which makes it possible to use DST. Data fusion becomes particularly interesting in those cases where there are multiple contributions from VGI within the same LU polygon.
Definition of the frame of discernment. To implement the DST, it is first necessary to define the frame of discernment and then to calculate the mass of belief for each hypothesis with respect to each source of information. In the present workflow,
is defined as all possible LU codes in the authoritative LULC nomenclature as shown in Equation (6):
(6)
(6)
After the pre-processing steps, each label of the change feature or in-situ location corresponds to a singleton hypothesis. In some cases, the contributions correspond to merged LU classes, for instance {LU4.1}, whereas in the authoritative LULC nomenclature, the most detailed classes are {LU4.1.1, LU4.1.2, LU4.1.3}. For the combined hypothesis, such as {LU4.1}, it should be replaced by the set of corresponding singleton hypotheses before applying the combination rule, as shown in . The {LU235} is the most detailed LU class in the current authoritative LULC nomenclature, although the goal is to be able to update it to the finest level of detail, corresponding to {LU2, LU3, LU5}.
Table 3. Mapping between the combined hypothesis and the singleton hypothesis.
Mass of belief assignment. The mass of belief is assigned to each source of information, which takes the four VGI data sources described in Section 3 into account.
The mass of belief for Source 1 (Web-based changes detected), which represents polygon detected changes with multiple observations, is defined based on the agreement value. For each detected change, the mass of belief for each proposition (P) is a function of the agreement and the ratio between the area of change and the LU feature area, as represented in Equation (7):
(7)
(7)
For Source 2 (Web-based changes edited), which represents single, edited manual polygon changes, Equation (7) is also applied except that the agreement value is not computed but assigned a value of 0.9, since these polygons were visually checked by LULC experts.
For Source 3 (web-based LU classification) and 4 (In-situ LU classification), the masses of belief are assigned with respect to Equation (8):
(8)
(8)
Since the VGI concerns the whole LU polygon, the mass of belief equates to the agreement value. For Sources 3 and 4, the agreement value is 0.9 since Source 3 is checked by staff from public authorities and Source 4 is visited personally by citizens. Hence, a high agreement value is assigned to these data.
Then for each affected authoritative LU polygon, masses of belief for the specific type of VGI are assigned to all possible hypotheses denoted as . This also takes ignorance into account, i.e. when a specific source of information cannot determine which proposition is the best solution. The mass of belief for
(all possible LU classes) is calculated from Equation (9):
(9)
(9)
Once the masses of belief have been calculated, information from different sources are combined for each LU polygon under consideration using Dempster’s rule. The decision is made using the criteria of the maximum pignistic probability (see Equation 5). An example of calculating the pignistic probability was appended as Annex B. By choosing the pignistic probability, the decision is made only among the singleton hypotheses. The hypothesis with the highest mass of belief is chosen in the present workflow. In the next step, this decision, i.e. the DST-derived solution, is implemented in the authoritative LULC data.
5.4. Decision step
To determine if the land use class for a given LU polygon should be updated for the new epoch, i.e. here for the year 2019, the DST-derived solutions are compared to the initial LU class in the 2016 release. If the DST-derived solution is the same as the initial OCS-GE class, there is no need to update the corresponding polygon in the database. Otherwise, the land use class for the corresponding LU polygon will be replaced by the class from the DST-derived solution. If the DST-derived solution is equal to LU2, LU3, or LU5 and the original class is LU235, this means that the LU polygon will be corrected by replacing the LU235 value with the more specific LU class. In this particular case, the update does not represent a change in the real world but rather an enrichment of the LULC data.
6. Results and discussion
6.1. Data fusion results
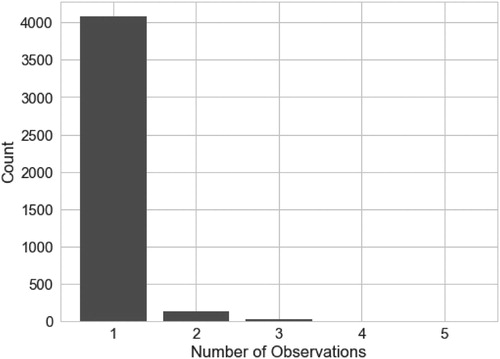
In this paper, the OCS-GE authoritative LULC data are updated using independent, external data sources of VGI coming from the campaigns covering the Toulouse study area. In total, there were 4229 authoritative LU features originally flagged as potentially needing updating or enriching by these contributions. The distribution of the number of contributions within the feature after the pre-processing steps is shown in . The majority, 4081, only have one source of information. There are 144 LU features containing two or more inputs from multi-source VGI.
Figure 9. The distribution of the number of contributions of the LU features collected. The number of LU features decreases as the number of observations increases (respectively, n=4081, 124, 19, 3 and 2). 96% have one contribution and 4% have between 2 and 5 contributions.
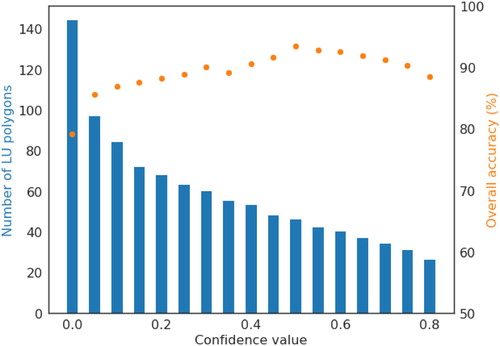
To evaluate the results derived by the proposed data-fusion framework, the 144 features corresponding to two or more contributions were manually labeled by comparing satellite imagery from 2016 to 2019, which are considered to be the ground truth data. For the features where the land use is difficult to derive, Google Street View imagery was additionally used. A benefit of using DST in the proposed framework is to be able to calculate a confidence measure for the fusion results. The confidence measure is the difference between the maximum pignistic probability and the second maximum pignistic probability. When there is a conflict between different data sources, the confidence value is low. Thus, it is useful to set a confidence threshold to exclude those features having low confidence values. The relationship between the overall accuracy and the confidence threshold is shown in . The confidence threshold was first set equal to 0, meaning that all the LU features were updated. In this situation, the overall accuracy was 77.7%. When increasing the confidence threshold, the overall accuracy starts to improve and then decreases slightly. The highest accuracy of 93.5% was achieved when the confidence threshold was set to 0.5. However, it only includes 46 LU features among the 144 features, representing 31.9% of the total LU features considered. To make the best use of all the collected multi-source VGI while maintaining a relatively high accuracy, the confidence threshold was set to 0.05, corresponding to an overall accuracy equal to 85.6%.
Figure 10. The overall accuracy and the number of LU polygons considered by confidence threshold values for features having two or more contributions.
Note that the validation is not applied to the locations having a single contribution. One way to complete the validation could be to organize a campaign to collect at least a second contribution for locations having, at the moment, a single contribution.
When the confidence threshold was set to 0.05, the confusion matrix is provided in . As a result, there are only four LU classes present in the validation data set, which includes LU2, LU5, LU6.1, LU6.3. The best F1-score (0.94) corresponds to LU2 (Industrial), followed by LU5 (Residential) and LU6.1 with F1-scores equal to 0.88 and 0.78, respectively. There is only one LU polygon that was validated as LU6.3 but the DST-derived class was LU5. The error would be in altering the polygon of residential usage by the change features identified, representing LU6.1 (Construction in progress). However, these change features only occupied a small fraction of the whole polygon and were, therefore, not sufficient to change the LU class of the polygon.
Table 4. Confusion matrix for features having two or more contributions with a confidence threshold greater than 0.05.
6.2. Updating the authoritative land use database
The DST-derived solutions for the LU polygons were compared with the initial LU labels in the 2016 authoritative data set. For features having only one contribution, e.g. the in-situ data in the case study, the contribution is considered to be the final assignment. After applying the 0.05 confidence threshold, there were 3409 LU polygons under consideration. Their spatial distribution is shown in based on the final LU assignment. The majority is LU5 (Residential). Residential use polygons have small areas and are spread over the study area but mainly within the city center. This is followed by LU6.1, which represents buildings under construction and LU2 (Industrial), where the 185 polygons are mainly located in the suburbs. Finally, there were a few polygons in classes LU4.1.1, LU4.1.4 and LU6.3.
Figure 11. The LU polygons updated with the corresponding new LU labels. (LU2-Industrial, LU3-Commercial; LU4.1.1-Road transport; LU4.1.4-Water transport; LU5-Residential; LU6.1-Construction zones; LU6.3-Not currently used)
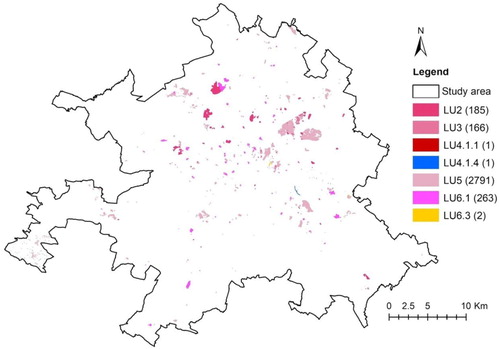
The decision can be classified into three cases: no update, enrichment, and change. According to this classification, 25 LU polygons (0.1 km2) were classified as no-update, 409 LU polygons (7.36 km2) were classified as change and 2975 (5.75 km2) as enrichment. In total, 87.3% of the detected polygons were enriched from LU235 to LU2, LU3 or LU5.
Examples are shown in . The VGI data sources from the Web-based changes detected and the Web-based changes edited are represented in orange and pink, respectively. Blue dots represent in-situ visited locations and red dots represent LU classification data. Images from Pleiades in 2019 and a 2016 orthophoto from the French Geoportal (https://www.geoportail.gouv.fr) were used to make a visual comparison.
Figure 12. Examples of multi-source VGI collected for LU polygons. (a1-c1) LU polygons and associated multi-source VGI; (a2-c2) aerial imagery in 2016; (a3-c3) Pléiades imagery in 2019.
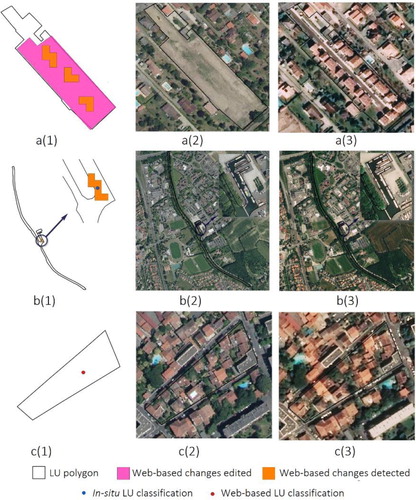
(a) illustrates an example of where an initial LU polygon has the class LU6.3 (Not currently used). There are two detected change features (LU5-Residential) indicating new residential buildings, one detected change feature (LU4.1-Transportation network) representing infrastructure use and one edited change feature denoting residential usage. The DST-solution is LU5 (Residential). The LU for this polygon will then change from LU6.3 (Not currently used) to LU5 (Residential). For the second example (see b), there is an in-situ LU classification (labelled as LU4.1.4 – Water transport) and a detected change feature (marked as No change) within the LU polygon. The land use label for the LU polygon in the 2016 database is LU4.1.4 (Water transport) and the DST-derived solution is also LU4.1.4. Thus, the corresponding land use label in the database will not be updated. In (c), the contribution from the in-situ data for this polygon is LU5 (Residential) while the original attribute is LU235 (Industrial, Commercial and Services, and Residential). Thus, the corresponding land use label is enriched to become LU5.
6.3. Error analysis
There were several challenges encountered when using VGI to update the authoritative database. First is the knowledge gap of the volunteers regarding the authoritative land use nomenclatures. For example, infrastructure is normally classified as LU2, which contains industrial and manufacturing activities. Storage and transportation areas directly related to the activities of manufacturing are also included. However, areas used for air transport, airports and related services (i.e. tracks, infrastructure, etc.) are defined as LU4.1.3 in the OCS-GE nomenclature. Volunteers misclassified the area in (a) as LU2.
Figure 13. Examples of errors in the LU polygons from the multi-source VGI collected. The figures labelled (a) indicate a misclassification of new LU by the volunteers and those labelled (b) refer to a change that only covers part of the initial polygon. (a1-b1) LU polygons and associated data; (a2-b2) aerial imagery in 2016; (a3-b3) Pléiades imagery in 2019.
Another source of error is the partial change caused by inaccurate or modified polygon geometry. There are some changes within a LU polygon, but the area is not sufficient to alter its land use class. For the example shown in (b), there are six divided change features (LU2-Industrial) representing industrial use within the LU polygon with LU classified as LU6.3 (Not currently used). The DST-solution is LU2 (Industrial). By comparing the imagery in 2016 and 2019, it can be seen that only part of the area has changed, and the majority part is still a tree-covered area. However, LU2 (Industrial) will be incorrectly assigned to this LU polygon according to the current framework. This case shows that sometimes it is not sufficient to take only the thematic information into account but also the geometry. In this specific case, two solutions are possible. One is to modify the geometry of the LU having LU6.3 (Not currently used). The LU polygon should be divided into two polygons representing LU6.3 and LU2. The second is to compute the proportion of different land uses (here LU2-Industrial and LU6.3-not currently used) and decide the value with respect to the maximum coverage.
6.4. Advantages and disadvantages
The proposed DST-based framework has several advantages with respect to updating LULC. One benefit is the management of time stamped data sets as inputs to the framework. Data sets can have different acquisition dates. In the Toulouse study case, we focused on the authoritative LULC database, which is updated every 3 years. The proposed framework can be adapted to enhance the temporal resolution of the data set, for instance, updating every year. The input data sets to the workflow would require a temporal selection of multi-source VGI.
A second benefit of the framework is the ability to take information coming from different sources as well as heterogeneous data into account, which may potentially disagree at a given location or be incomplete. One might automatically assume that in-situ observations are more likely to be reliable given the ability to see directly in the field and with no influence from other information such as GIS layers that are available in the web app. However, this must be balanced with a visibility mask due to some features potentially being obscured by the topography or large objects such as buildings, trees, etc. or with the difficulty of interpretation of some land use types that match the database mapping specifications. The automatic change detection service based on satellite imagery is efficient in terms of processing and to provide alerts of potential changes. Nevertheless, some errors can occur, and these potential changes need to be validated. Collaborative and multiple validations using photo-interpretation, even if this is far from the field, are useful for determining both the veracity of the change and the associated type.
A third benefit is the scalability of the framework. The framework is applied to LULC data produced by IGN-France and uses four VGI data sets with observations about changes in the study area. This framework could be easily extended by adding other sources of information such as topographic information and changes coming from image processing; the only requirement is that the sources must be independent. Moreover, the framework can be easily adapted to update other authoritative vector LULC data by tailoring the pre-processing and filtering steps to better fit the characteristics of the data.
There are also some limitations to the proposed framework, which are related to the input data and the process. First, concerning the multi-source VGI, there are limitations in terms of the volume and their spatial distribution. The detected changes (although small in number) were distributed over the whole study site, and validation was made for all of these using the web-based application. However, the in-situ data are distributed in spatial clusters as citizens tend to stay within a limited area, especially when they visit locations by foot. In-situ observation also takes time, because of the need to travel between targeted locations and to interpret the land use and land cover in the field. This spatial bias is common in VGI, i.e. the uneven distribution of observations across space (Girres and Touya Citation2010; Haklay Citation2010; Kádár and Gede Citation2013). Moreover, it happens that some real changes are not detected by the CDS or that some locations have changed but they have not been visited by any contributor. It is difficult to assess the omission without having ground truth data. However, the VGI is meant to complement the traditional process of updating authoritative LULC maps and not replace it. In our assessment, locations without information do not mean that there is no update to make, and these locations need to be checked by using the traditional process of updating authoritative LULC data. Hence, surveying of areas not covered by VGI will still need to be undertaken. Another bias which can be raised is the heterogeneous quality of the data. The number of contributors per location was taken into account when computing the contributor agreement. The latter is used as a measure of quality in the fusion process by weighting the mass of belief assigned to each location. It is true that, in our case, we have many locations having only one contribution. In this case, the contributor agreement is equal to one. This can introduce a bias, because it indicates that the quality is good but, in fact, it is about a lack of redundant information. This issue can be addressed by adding information about the number of contributors for each location.
The quality of the VGI would also need to be taken into account in the framework, not only by the type of data using belief functions as in the current workflow, but also for each observation and, if possible, for each contributor. Indeed, the quality of VGI can be assessed using intrinsic or extrinsic indicators. For intrinsic indicators, some observations correspond to the same targeted LU polygon, so it is possible to give a confidence value depending on the contributor’s agreement. For extrinsic data quality assessment, authoritative (e.g. the quarry data set produced by local authorities) or other VGI sources (e.g. OSM) are not yet included in the framework but could be used. In addition, administrative processes are already in place to obtain information from other authoritative institutes about changes in specific topographic objects (e.g. roads, buildings). Even though these changes mostly concern LC, they can reflect a LU change and can be considered. Secondly, for the fusion process between pieces of information in the workflow, challenges mainly concern the mass of belief assessment so sensitivity tests could be undertaken. Finally, another limitation in the current framework is the fact that the geometry of the LULC polygons is not modified, only the label. Achieving this additional functionality would require further research as well as more polygon data representing change.
7. Conclusions
Timely, high quality land use information is critical for urban planners and decision-makers. However, it is still a great challenge to build and update a LU database using multi-source VGI. The proposed framework integrates authoritative LU data with heterogeneous multi-source VGI based on Dempster-Shafer theory. The multi-source VGI must be independent so that the belief can be modelled according to their accuracy and confidence. We applied our framework to update the authoritative database OCS-GE. Four VGI data sets were obtained through online and in-situ campaigns and have been collected over the city of Toulouse and its surroundings. The results showed the potential of multi-source VGI to update the authoritative LU database with an overall accuracy of 85.6% (confidence≥0.05). The scalability is one of the advantages of the proposed framework. By taking advantage of it, potential or existing data sources could be designed or directly added as inputs to the fusion process. This would further improve the accuracy and the confidence of the updating results. With the currently available data, there are still many built-up areas having the mixed land use label (LU235). We plan to use data from OSM and the Urban Atlas data to better distinguish the function of buildings so as to distinguish between Residential (LU5), Commercial (LU3) and Industrial (LU2) land use types by following the approach proposed by Fonte et al. (Citation2018).
The current framework focuses on updating the semantic information of the LU polygons flagged as potentially changing in the authoritative database. Another use of the framework could be to use the results as hints and leave the final check for surveyors in order to obtain an updated LU database. Then, the framework could be improved by adding functionality related to editing the geometry of the LU polygons. The boundaries of a land parcel corresponding to a specific LU and the polygon geometry can change during the updating period. The adjustment of geometry is related to complex GIS tasks and decision processes and will be considered in future studies.
Disclosure statement
No potential conflict of interest was reported by the author(s).
Additional information
Funding
References
- Arnold, Stephan, Barbara Kosztra, Gebhard Banko, Geoff Smith, Gerard Hazeu, Michael Bock, and N. Valcarcel Sanz. 2020. “The EAGLE Concept—A Vision of a Future European Land Monitoring Framework.” In Proceedings 33th EARSeL Symposium Towards Horizon, edited by M. Lasaponara, L. Masini, and N. Biscione, 551–568. Matera: University of Basilicata.
- Bovolo, Francesca, Lorenzo Bruzzone, and Mattia Marconcini. 2007.. “An Unsupervised Change Detection Technique Based on Bayesian Initialization and Semisupervised SVM.” In 2007 IEEE International Geoscience and Remote Sensing Symposium, 2370–2373.
- Bruzzone, L., and S. B. Serpico. 1997. “Detection of Changes in Remotely-Sensed Images by the Selective Use of Multi-Spectral Information.” International Journal of Remote Sensing 18 (18): 3883–3888.
- Chaabouni-Chouayakh, Houda, Thomas Krauss, Pablo d’Angelo, and Peter Reinartz. 2010. “3D Change Detection Inside Urban Areas Using Different Digital Surface Models.” International Archives of Photogrammetry, Remote Sensing and Spatial Information Sciences 38: 86–91.
- Champion, Nicolas, Didier Boldo, Marc Pierrot-Deseilligny, and Georges Stamon. 2010. “2D Building Change Detection from High Resolution Satelliteimagery: A Two-Step Hierarchical Method Based on 3D Invariant Primitives.” Pattern Recognition Letters 31 (10): 1138–1147.
- CNIG. 2014. Prescriptions Nationales Pour La Production d’une Base de Données d’occupation Du Sol à Grande Échelle.
- Comber, A. J. 2008. “The Separation of Land Cover from Land Use Using Data Primitives.” Journal of Land Use Science 3 (4): 215–229. doi:10.1080/17474230802465173.
- Comber, Alexis, Cidália Fonte, Giles Foody, Steffen Fritz, Paul Harris, Ana-Maria Olteanu-Raimond, and Linda See. 2016. “Geographically Weighted Evidence Combination Approaches for Combining Discordant and Inconsistent Volunteered Geographical Information.” GeoInformatica 20 (3): 503–527.
- Comber, Alexis, Alistair N R Law, and J Rowland Lishman. 2004. “A Comparison of Bayes’, Dempster–Shafer and Endorsement Theories for Managing Knowledge Uncertainty in the Context of Land Cover Monitoring.” Computers, Environment and Urban Systems 28 (4): 311–327.
- Comber, Alexis, R. Richard Wadsworth, and Peter Fisher. 2008. “Using Semantics to Clarify the Conceptual Confusion Between Land Cover and Land use: the Example of ‘Forest’.” Journal of Land Use Science 3 (2-3): 185–198.
- Comber, Alexis, Richard Wadsworth, and Peter Fisher. 2006. “Reasoning Methods for Handling Uncertain Information in Land Cover Mapping.” In Fundamentals of Spatial Data Quality, edited by Rodolphe Devillers and Robert Jeansoulin, 123–139. John Wiley & Sons, Ltd.
- Daudt, Rodrigo Caye, Bertr Le Saux, Alexandre Boulch, and Yann Gousseau. 2018. “Urban Change Detection for Multispectral Earth Observation Using Convolutional Neural Networks.” In IGARSS 2018-2018 IEEE International Geoscience and Remote Sensing Symposium, 2115–2118.
- Daudt, Rodrigo Caye, Bertrand Le Saux, Alexandre Boulch, and Yann Gousseau. 2019. “Multitask Learning for Large-Scale Semantic Change Detection.” Computer Vision and Image Understanding 187: 102783.
- Dempster, Arthur P. 1967. “Upper and Lower Probability Inferences Based on a Sample from a Finite Univariate Population.” Biometrika 54 (3–4): 515–528.
- Domenech, E., and C. Mallet. 2014. “Change Detection in High Resolution Land Use/Land Cover Geodatabases (at Object Level).” EuroSDR Official Publication 64: 9–64.
- Du, Peijun, Sicong Liu, Junshi Xia, and Yindi Zhao. 2013. “Information Fusion Techniques for Change Detection from Multi-Temporal Remote Sensing Images.” Information Fusion 14 (1): 19–27.
- EEA. 2006. The Thematic Accuracy of Corine Land Cover 2000-Assessment Using LUCAS. Copenhagen, Denmark.
- EEA. 2011. Mapping Guide for a European Urban Atlas. http://www.eea.europa.eu/data-and-maps/data/urban-atlas.
- Estima, Jacinto, and Marco Painho. 2013. Exploratory Analysis of OpenStreetMap for Land Use Classification.” In Proceedings of the Second ACM SIGSPATIAL International Workshop on Crowdsourced and Volunteered Geographic Information, 39–46.
- Fleiss, Joseph L. 1971. “Measuring Nominal Scale Agreement among Many Raters.” Psychological Bulletin 76 (5): 378.
- Fonte, C. C., Lucy Bastin, Linda See, Giles Foody, and Flavio Lupia. 2015. “Usability of VGI for Validation of Land Cover Maps.” International Journal of Geographical Information Science. doi:10.1080/13658816.2015.1018266.
- Fonte, C. C., and Nuno Martinho. 2017. “Assessing the Applicability of OpenStreetMap Data to Assist the Validation of Land Use/Land Cover Maps.” International Journal of Geographical Information Science 31 (12): 2382–2400.
- Fonte, C. C., M. Minghini, V. Antoniou, J. Patriarca, L. See, et al. 2018. “Classification of Building Function Using Available Sources of VGI.” In ISPRS TC IV Mid-Term Symposium “3D Spatial Information Science–The Engine of Change,” 42:209–215.
- Fonte, C. C., Marco Minghini, Joaquim Patriarca, Vyron Antoniou, Linda See, and Andriani Skopeliti. 2017a. “Generating Up-to-Date and Detailed Land Use and Land Cover Maps Using OpenStreetMap and GlobeLand30.” ISPRS International Journal of Geo-Information 6 (4): 125.
- Fonte, C. C., Joaquim António Patriarca, Marco Minghini, Vyron Antoniou, Linda See, and Maria Antonia Brovelli. 2017b. “Using Openstreetmap to Create Land Use and Land Cover Maps: Development of an Application.” In Volunteered Geographic Information and the Future of Geospatial Data, edited by P. Calazans Campelo, C. E. Bertolotto, and M. Corcoran, 113–137, Hershey, PA: IGI Global.
- Foody, Giles M, and Doreen S Boyd. 2013. “Using Volunteered Data in Land Cover Map Validation: Mapping West African Forests.” IEEE Journal of Selected Topics in Applied Earth Observations and Remote Sensing 6 (3): 1305–1312. https://ieeexplore.ieee.org/abstract/document/6493463/.
- Fritz, Steffen, Linda See, Ian Mccallum, Liangzhi You, Andriy Bun, Elena Moltchanova, Martina Duerauer, et al. 2015. “Mapping Global Cropland and Field Size.” Global Change Biology 21 (5): 1980–1992. doi:10.1111/gcb.12838.
- Girres, Jean-François, and Guillaume Touya. 2010. “Quality Assessment of the French OpenStreetMap Dataset.” Transactions in GIS 14 (4): 435–459.
- Gladstone, C. S., A. Gardiner, and D. Holland. 2012. “A Semi-Automatic Method for Detecting Changes to Ordnance Survey Topographic Data in Rural Environments.” Proceedings of the 4th GEOBIA, São José Dos Campos, Brazil, 7–9.
- Goodchild, Michael F. 2007. “Citizens as Sensors: The World of Volunteered Geography.” GeoJournal. doi:10.1007/s10708-007-9111-y.
- Gressin, Adrien, Nicole Vincent, Clement Mallet, and Nicolas Paparoditis. 2014. “A Unified Framework for Land-Cover Database Update and Enrichment Using Satellite Imagery.” In 2014 IEEE International Conference on Image Processing (ICIP), 5057–5061.
- Gueguen, Lionel, Pierre Soille, and Martino Pesaresi. 2011. “Change Detection Based on Information Measure.” IEEE Transactions on Geoscience and Remote Sensing 49 (11): 4503–4515.
- Guerin, Cyrielle, Renaud Binet, and Marc Pierrot-Deseilligny. 2014. “Automatic Detection of Elevation Changes by Differential DSM Analysis: Application to Urban Areas.” IEEE Journal of Selected Topics in Applied Earth Observations and Remote Sensing 7 (10): 4020–4037.
- Haklay, Mordechai. 2010. “How Good is Volunteered Geographical Information? A Comparative Study of OpenStreetMap and Ordnance Survey Datasets.” Environment and Planning B: Planning and Design 37 (4): 682–703.
- Haklay, Mordechai, Sofia Basiouka, Vyron Antoniou, and Aamer Ather. 2010. “How Many Volunteers Does It Take to Map an Area Well? The Validity of Linus’ Law to Volunteered Geographic Information.” The Cartographic Journal 47 (4): 315–322.
- Halmy, Marwa Waseem A, Paul E Gessler, Jeffrey A Hicke, and Boshra B Salem. 2015. “Land Use/Land Cover Change Detection and Prediction in the North-Western Coastal Desert of Egypt Using Markov-CA.” Applied Geography 63: 101–112.
- Huth, Juliane, Claudia Kuenzer, Thilo Wehrmann, Steffen Gebhardt, Vo Quoc Tuan, and Stefan Dech. 2012. “Land Cover and Land Use Classification with TWOPAC: Towards Automated Processing for Pixel-and Object-Based Image Classification.” Remote Sensing 4 (9): 2530–2553.
- IGN. 2015. Spécifications Couche Occupation Du Sol à Grande Échelle de l’IGN OCS GE. Technical Document.
- Inglada, Jordi, Arthur Vincent, Marcela Arias, Benjamin Tardy, David Morin, and Isabel Rodes. 2017. “Operational High Resolution Land Cover Map Production at the Country Scale Using Satellite Image Time Series.” Remote Sensing 9 (1): 95.
- INSPIRE. 2013. “D2.8.III.4 INSPIRE Data Specification on Land Use – Draft Technical Guidelines, INSPIRE Thematic Working Group Land Use.”.
- Jokar Arsanjani, Jamal, Marco Helbich, Mohamed Bakillah, Julian Hagenauer, and Alexander Zipf. 2013. “Toward Mapping Land-Use Patterns from Volunteered Geographic Information.” International Journal of Geographical Information Science 27 (12): 2264–2278.
- Kádár, Bálint, and Mátyás Gede. 2013. “Where do Tourists go? Visualizing and Analysing the Spatial Distribution of Geotagged Photography.” Cartographica: The International Journal for Geographic Information and Geovisualization 48 (2): 78–88.
- Keinan, E., Y. A. Felus, Y. Tal, O. Zilberstien, and Y. Elihai. 2016. “Updating National Topographic Data Base Using Change Detection Methods.” International Archives of the Photogrammetry, Remote Sensing and Spatial Information Sciences: 529–536.
- Lebedev, M. A., Yu V Vizilter, O. V. Vygolov, V. A. Knyaz, and A. Yu Rubis. 2018. “Change Detection in Remote Sensing Images Using Conditional Adversarial Networks.” International Archives of the Photogrammetry, Remote Sensing & Spatial Information Sciences 42 (2): 565–571.
- Le Bris, Arnaud, and Nesrine Chehata. 2011. “Change Detection in a Topographic Building Database Using Submetric Satellite Images.” International Archives of the Photogrammetry, Remote Sensing and Spatial Information Sciences 38 (3/W22): 25–30.
- Lefevre, Eric, Olivier Colot, and Patrick Vannoorenberghe. 2002. “Belief Function Combination and Conflict Management.” Information Fusion 3 (2): 149–162.
- Liu, Sicong, Lorenzo Bruzzone, Francesca Bovolo, and Peijun Du. 2014. “Hierarchical Unsupervised Change Detection in Multitemporal Hyperspectral Images.” IEEE Transactions on Geoscience and Remote Sensing 53 (1): 244–260.
- Liu, Sicong, Lorenzo Bruzzone, Francesca Bovolo, Massimo Zanetti, and Peijun Du. 2015. “Sequential Spectral Change Vector Analysis for Iteratively Discovering and Detecting Multiple Changes in Hyperspectral Images.” IEEE Transactions on Geoscience and Remote Sensing 53 (8): 4363–4378.
- Liu, H., and Q. Zhou. 2004. “Accuracy Analysis of Remote Sensing Change Detection by Rule-Based Rationality Evaluation with Post-Classification Comparison.” International Journal of Remote Sensing 25 (5): 1037–1050.
- Lu, Dengsheng, Guiying Li, and Emilio Moran. 2014. “Current Situation and Needs of Change Detection Techniques.” International Journal of Image and Data Fusion 5 (1): 13–38.
- Mas, Jean-François, Richard Lemoine-Rodriguez, Rafael González-López, Jairo López-Sánchez, Andrés Piña-Garduño, and Evelyn Herrera-Flores. 2017. “Land Use/Land Cover Change Detection Combining Automatic Processing and Visual Interpretation.” European Journal of Remote Sensing 50 (1): 626–635.
- Matikainen, Leena, Juha Hyyppä, Eero Ahokas, Lauri Markelin, and Harri Kaartinen. 2010. “Automatic Detection of Buildings and Changes in Buildings for Updating of Maps.” Remote Sensing 2 (5): 1217–1248.
- Molina, Iñigo, Estibaliz Martinez, Carmen Morillo, Jesus Velasco, and Alvaro Jara. 2016. “Assessment of Data Fusion Algorithms for Earth Observation Change Detection Processes.” Sensors 16 (10): 1621.
- Muttitanon, W., and N. K. Tripathi. 2005. “Land Use/Land Cover Changes in the Coastal Zone of Ban Don Bay, Thailand Using Landsat 5 TM Data.” International Journal of Remote Sensing 26 (11): 2311–2323.
- Namdar, Mohammad, Jan Adamowski, Hossein Saadat, Forood Sharifi, and Afsaneh Khiri. 2014. “Land-Use and Land-Cover Classification in Semi-Arid Regions Using Independent Component Analysis (ICA) and Expert Classification.” International Journal of Remote Sensing 35 (24): 8057–8073.
- Nassreddine, Ghalia, Fahed Abdallah, and Thierry Denœux. 2008. “Map Matching Algorithm Using Belief Function Theory.” In 2008 11th International Conference on Information Fusion, 1–8.
- Ohki, Masato, and Masanobu Shimada. 2018. “Large-Area Land Use and Land Cover Classification with Quad, Compact, and Dual Polarization SAR Data by PALSAR-2.” IEEE Transactions on Geoscience and Remote Sensing 56 (9): 5550–5557.
- Olteanu-Raimond, Ana-Maria, Glen Hart, Giles M. Foody, Guillaume Touya, Tobias Kellenberger, and Demetris Demetriou. 2017a. “The Scale of VGI in Map Production: A Perspective on European National Mapping Agencies.” Transactions in GIS 21 (1): 74–90. doi:10.1111/tgis.12189.
- Olteanu-Raimond, Ana-Maria, Laurence Jolivet, Marie-Dominque Van Damme, Timothée Royer, Ludovic Fraval, Linda See, Tobias Sturn, Mathias Karner, Inian Moorthy, and Steffen Fritz. 2018. “An Experimental Framework for Integrating Citizen and Community Science Into Land Cover, Land Use, and Land Change Detection Processes in a National Mapping Agency.” Land 7 (3): 103.
- Olteanu-Raimond, Ana-Maria, Mari Laakso, Vyron Antoniou, Cidália Costa Fonte, Alexandra Fonseca, Magdalena Grus, Jenny Harding, Tobias Kellenberger, Marco Minghini, and Andriani Skopeliti. 2017b. “VGI in National Mapping Agencies: Experiences and Recommendations.” In Mapping and the Citizen Sensor, 299–326. Ubiquity Press. https://www.oapen.org/download?type=document&docid=637890#page=308.
- Olteanu-Raimond, Ana-Maria, Sebastien Mustiere, and Anne Ruas. 2015. “Knowledge Formalization for Vector Data Matching Using Belief Theory.” Journal of Spatial Information Science 2015 (10): 21–46.
- Olteanu-Raimond, Ana-Maria, L. See, M. Schultz, G. Foody, M. Riffler, T. Gasber, L. Jolivet, et al. 2020a. “Use of Automated Change Detection and VGI Sources for Identifying and Validating Urban Land Use Change.” Remote Sensing 12 (7): 1186.
- Olteanu-Raimond, Ana-Maria, Marie-Dominique Van Damme, Julie Marcuzzi, Tobias Sturn, Ludovic Fraval, Marie Gombert, Laurence Jolivet, Linda See, Timothé Royer, and Simon Fauret. 2020b. “Crowd and Community Sourcing to Update Authoritative LULC Data in Urban Areas.” Zenodo, doi:10.5281/zenodo.3691827.
- Papadomanolaki, Maria, Sagar Verma, Maria Vakalopoulou, Siddharth Gupta, and Konstantinos Karantzalos. 2019. “Detecting Urban Changes with Recurrent Neural Networks from Multitemporal Sentinel-2 Data.” In IGARSS 2019-2019 IEEE International Geoscience and Remote Sensing Symposium, 214–217.
- Peng, Daifeng, Yongjun Zhang, and Haiyan Guan. 2019. “End-to-End Change Detection for High Resolution Satellite Images Using Improved Unet++.” Remote Sensing 11 (11): 1382.
- Poulain, Vincent, Jordi Inglada, Marc Spigai, Jean-Yves Tourneret, and Philippe Marthon. 2009. “Fusion of High Resolution Optical and SAR Images with Vector Data Bases for Change Detection.” In 2009 IEEE International Geoscience and Remote Sensing Symposium, 4:IV–956.
- Ran, Y. H., Xin Li, Ling Lu, and Z. Y. Li. 2012. “Large-Scale Land Cover Mapping with the Integration of Multi-Source Information Based on the Dempster–Shafer Theory.” International Journal of Geographical Information Science 26 (1): 169–191.
- Rogan, John, and DongMei Chen. 2004. “Remote Sensing Technology for Mapping and Monitoring Land-Cover and Land-Use Change.” Progress in Planning 61 (4): 301–325.
- Rottensteiner, Franz, John Trinder, Simon Clode, and Kurt Kubik. 2007. “Building Detection by Fusion of Airborne Laser Scanner Data and Multi-Spectral Images: Performance Evaluation and Sensitivity Analysis.” ISPRS Journal of Photogrammetry and Remote Sensing 62 (2): 135–149.
- Royère, Cyril, Dominique Gruyer, and Véronique Cherfaoui. 2000. “Data Association with Believe Theory.” In Proceedings of the Third International Conference on Information Fusion, 1:TUD2–3.
- Saadat, Hossein, Jan Adamowski, Robert Bonnell, Forood Sharifi, Mohammad Namdar, and Sasan Ale-Ebrahim. 2011. “Land Use and Land Cover Classification Over a Large Area in Iran Based on Single Date Analysis of Satellite Imagery.” ISPRS Journal of Photogrammetry and Remote Sensing 66 (5): 608–619.
- Schultz, M., J. Voss, M. Auer, S. Carter, A. Zipf - International journal of Applied, and Undefined 2017. 2017. “Open Land Cover from OpenStreetMap and Remote Sensing.” International Journal of Applied Earth Observation and Geoinformation 63: 206–213. https://www.sciencedirect.com/science/article/pii/S0303243417301605.
- See, Linda, Dmitry Schepaschenko, Myroslava Lesiv, Ian McCallum, Steffen Fritz, Alexis Comber, Christoph Perger, et al. 2015. “Building a Hybrid Land Cover Map with Crowdsourcing and Geographically Weighted Regression.” ISPRS Journal of Photogrammetry and Remote Sensing 103: 48–56.
- Singh, Ashbindu. 1989. “Review Article Digital Change Detection Techniques Using Remotely-Sensed Data.” International Journal of Remote Sensing 10 (6): 989–1003.
- Sitthi, Asamaporn, Masahiko Nagai, Matthew Dailey, and Sarawut Ninsawat. 2016. “Exploring Land Use and Land Cover of Geotagged Social-Sensing Images Using Naive Bayes Classifier.” Sustainability 8 (9): 921.
- Smets, Philippe, and Robert Kennes. 1994. “The Transferable Belief Model.” Artificial Intelligence 66 (2): 191–234.
- Tehrany, Mahyat Shafapour, Biswajeet Pradhan, and Mustafa Neamah Jebuv. 2014. “A Comparative Assessment Between Object and Pixel-Based Classification Approaches for Land Use/Land Cover Mapping Using SPOT 5 Imagery.” Geocarto International 29 (4): 351–369.
- Touya, Guillaume, Vyron Antoniou, Ana-Maria Olteanu-Raimond, and Marie-Dominique Van Damme. 2017. “Assessing Crowdsourced POI Quality: Combining Methods Based on Reference Data, History, and Spatial Relations.” ISPRS International Journal of Geo-Information 6 (3): 80.
- Varghese, Ashley, Jayavardhana Gubbi, Akshaya Ramaswamy, and P. Balamuralidhar. 2018. “ChangeNet: A Deep Learning Architecture for Visual Change Detection.” In Proceedings of the European Conference on Computer Vision (ECCV), 0. Munich, Germany.
- Yan, Yingwei, Michael Schultz, and Alexander Zipf. 2019. “An Exploratory Analysis of Usability of Flickr Tags for Land Use/Land Cover Attribution.” Geo-Spatial Information Science 22 (1): 12–22.
- Zhang, Ce, Isabel Sargent, Xin Pan, Huapeng Li, Andy Gardiner, Jonathon Hare, and Peter M Atkinson. 2019. “Joint Deep Learning for Land Cover and Land Use Classification.” Remote Sensing of Environment 221: 173–187.
- Zhao, Yuanyuan, Le Yu Duole Feng, Linda See, Steffen Fritz, Christoph Perger, and Peng Gong. 2017. “Assessing and Improving the Reliability of Volunteered Land Cover Reference Data.” Remote Sensing 9 (10): 1034.
Appendices
Appendix A
Table A1. Land cover nomenclature.
Table A2. Land use nomenclature.
Appendix B – an example of calculating the pignistic probability
Figure B1. An example of applying the proposed Dempster-Shafer fusion on a LU feature with three contributions from two sources
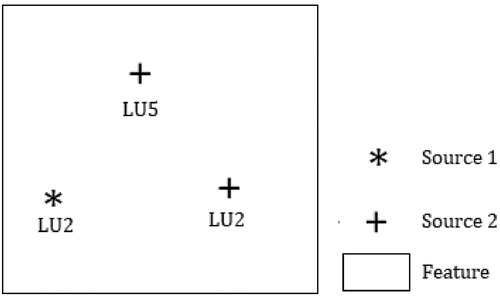
As shown in , there are one contribution from Source 1 and two contributions from Source 2. The frame of discernment and its power set are defined as:
Supposing that ratios between the area of change and the LU feature area for the three contributions LU2 (Source 1), LU2 (Source 2), and LU5 (Source 2) are respectively equal to 0.6, 0.5, 0.3 and the computed agreement for the contribution LU2 (Source 1) is equal to 1. As said before, the agreement for Source 2 is not computed but automatically assigned to 0.9. Thus, the masses of belief are assigned as:
Then, the masses of belief for are:
After applying the Dempster Shafer operator, we obtained the result:
After normalizing the conflict, we obtained:
Finally, the pignistic probabilities are equal to: