?Mathematical formulae have been encoded as MathML and are displayed in this HTML version using MathJax in order to improve their display. Uncheck the box to turn MathJax off. This feature requires Javascript. Click on a formula to zoom.
ABSTRACT
Long-term droughts significantly impact surface and groundwater resources in India, however, observed changes in major river basins have not been well explored. Here we use Standardized Precipitation Index (SPI) and Standardized Precipitation Evapotranspiration Index (SPEI) at three different time scales (24, 48, and 60 months) to identify long-term droughts in India for the observed record of 1951–2015. Drought characteristics (extent, events, frequency, and intensity) are analyzed for different river basins in India. Increasing trend in the areal extent of droughts is observed in two methods with three time scales in the maximum area (63.66%) in India. We use the data from the Gravity Recovery and Climate Experiment (GRACE) to estimate the changes in the terrestrial water storage (TWS) during the period 2002–2015. We identify that major long-term droughts in India occurred from 1966 to 1969, 1972, 1986–1987, and 2002–2004. The all-India average TWS shows a negative trend from 2002 to 2015 with prominent decline in north Indian river basins and positive trend in south Indian river basins. SPI and SPEI at longer time scales are positively associated with TWS indicating the adverse impacts of droughts on surface and groundwater resources in such a populated region.
1. Introduction
Globally, drought is one of the costliest natural disasters (Wilhite, Sivakumar, and Wood Citation2000), which has a significant impact on water resources. The occurrence of drought has increased since 1965 in India (Shewale and Kumar Citation2005) and some of the severe droughts affected surface and groundwater resources (Shah and Mishra Citation2016; Asoka et al. Citation2017). The groundwater level declines due to increases in the frequency and severity of droughts, which in turn results in reduced water levels in streams and lakes. In India, groundwater storage has declined in the northern part and increased in the southern part from 2002 to 2013 (Asoka et al. Citation2017). Water stress is one of the leading problems in India due to increasing water demand for a growing population and industrialization (Sinha, Syed, and Reager Citation2019).
Unlike short-term (less than a year duration) droughts, long-term (2 years or more) droughts can have lasting implications on surface and groundwater resources (Mishra and Singh Citation2010; Tiwari and Mishra Citation2019). Soil moisture has also been used as an effective indicator of long-term droughts (Lakshmi et al. Citation2004). Lack of precipitation for longer duration directly impacts soil moisture, streamflow, and groundwater, which in turn affects crop production and food security (Mishra et al. Citation2019). For instance, long-term drought-affected streamflow in the Yellow River in 1997, which resulted in water shortages, dust storms, and desertification (Mishra and Singh Citation2010). Depletion of groundwater was reported in Bangladesh due to long-term meteorological drought during 1986–2002 (Shahid and Hazarika Citation2010). Persistent drought increases groundwater pumping for irrigation and depletes the groundwater recharge resulting in lower water levels. For instance, long-term drought in California caused a depletion of 80 km3 groundwater (Scanlon et al. Citation2012).
Millions of people in India were affected due to recent droughts. For instance, the 2014–2015 drought affected about 330 million people and caused a severe water crisis in India (Aadhar and Mishra Citation2017). However, most of the studies (Mishra and Desai Citation2005; Kumar et al. Citation2013; Joshi et al. Citation2016; Mallya et al. Citation2016; Aadhar and Mishra Citation2017; Mallya, Tripathi, and Govindaraju Citation2019; Mishra et al. Citation2019; Kulkarni et al. Citation2020; Shah and Mishra Citation2020) in India remained focused on short-term droughts (meteorological, agricultural, and hydrological) mostly during the monsoon season. The water availability in India during droughts has been the key issue during the recent decades, however, the linkage between water availability and long-term droughts at river basin scales has not been explored. Here, we investigate the changes in the long-term (24, 48, and 60 months) droughts using Standardized Precipitation Index (SPI) and Standardized Precipitation Evapotranspiration Index (SPEI) for major river basins in India for 1951–2015 period. We evaluate the linkage between GRACE TWS and long-term droughts based on SPI and SPEI for the major basins during 2002–2015 to understand the impacts of droughts on water availability in India.
2. Study area
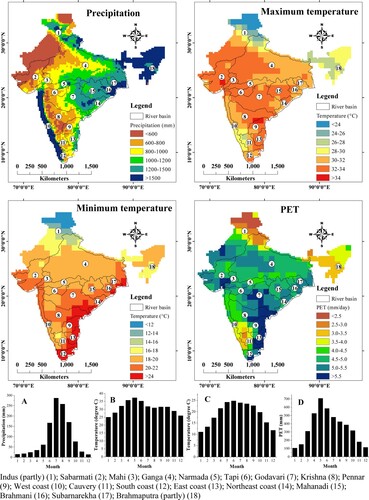
According to the recently published river basin atlas of India by Water Resources Information System (WRIS), there are total of 25 river basins and 103 sub-basins. Among the river basins, 12 basins are considered as major river basins in India covering an area of 2.53 million km2, these are Indus, Mahanadi, Krishna, and Godavari. Ganga, Brahmaputra, and Indus Rivers and are fed by snowmelt water in the summer season, while other basins are entirely dependent on monsoon rainfall. There are seven medium-sized river basins, such as Narmada, Mahi, Tapi, Subarnarekha, Brahmani-Baitarani, Sabarmati, and Cauvery covering 15% of the drainage area of India (Kumar and Jain Citation2011). The elevation across India ranges widely from sea level to more than 4000 m above the mean sea level (AMSL). The higher elevation is found in the northern part of the country. Generally, flow in many Indian rivers is dependent on direct precipitation, except for a few rivers in northern India, where the snow or glacial melting is the major source of water (Mondal, Lakshmi, and Hashemi Citation2018). shows mean annual total precipitation, mean air temperature, and mean PET during 1951–2105 in India. Lower precipitation (<600 mm/year) is observed in the western part and higher precipitation (>1500 mm/year) is found in the eastern part and west coast. Amount of precipitation gradually increases from west to east. Lower range of maximum (<24°C) and minimum (<12°C) temperature is located in the northern part and higher range of maximum (>34°C) and minimum (>24°C) temperature is observed in the south-eastern parts of India. Similarly, minimum (<1300 mm/year) and maximum (>1800 mm/year) ranges of PET were found in northern and southwestern parts. Four types of climatic seasons are observed – pre-monsoon (March–May), monsoon (June–September), post-monsoon (October–November), and winter (December–February) (Mondal, Lakshmi, and Hashemi Citation2018). Minimum temperature and maximum temperature are high during pre-monsoon when PET is higher. Maximum precipitation (about 80%) occurs during the monsoon season (Mishra et al. Citation2016).
Figure 1. Spatial variation of annual average precipitation, maximum temperature, minimum temperature, and potential evapotranspiration (PET) in India. Comparison of monthly (average) variation of precipitation, maximum temperature, minimum temperature, and PET in A to D graphs (A=precipitation; B=maximum temperature; C=minimum temperature, and D=PET). Monthly and annual average were estimated using data from 1951 to 2015.
3. Materials and methods
We obtained daily precipitation data at 0.25° from the India Meteorological Department (IMD) for the 1951–2015 period. Gridded precipitation data are developed by IMD using 6995 observational stations distributed across India (Pai et al. Citation2014). The precipitation dataset is well quality controlled and has been used in several prior studies (Shah and Mishra Citation2015; Mallya et al. Citation2016; Mondal, Lakshmi, and Hashemi Citation2018; Mishra et al. Citation2019). We used daily minimum (Tmin) and maximum (Tmax) air temperatures available at 1° spatial resolution from IMD for the same time duration (1951–2015). We interpolated air temperature to 0.25° using bilinear interpolation to have spatial resolution consistent of precipitation (Shah and Mishra Citation2016). The gridded temperature data were developed by IMD using 3995 observations across India, which was used in the prior studies (Shah and Mishra Citation2016; Shah and Mishra Citation2016; Asoka et al. Citation2018).
We obtained terrestrial water storage (TWS) data from the Gravity Recovery and Climate Experiment (GRACE) from 2002 to 2015 (Tapley et al. Citation2004) (https://grace.jpl.nasa.gov/data/get-data/). GRACE TWS data has been used for drought assessment across the globe (Chen et al. Citation2009; Long et al. Citation2013; Mishra et al. Citation2016; Mishra et al. Citation2018; Sinha, Syed, and Reager Citation2019; Mishra Citation2020: Shah and Mishra Citation2020). The surface mass variations at higher resolution (higher spatial scales) are diminished due to sampling and post processing. Therefore, scaling factors were estimated using the same filters to reduce attenuation results from sampling or post processing (Swenson and Wahr Citation2006). Monthly TWS anomalies were generated for each grid cell after the removal of the mean TWS for 2002–2015.
3.1. Standardized precipitation index method
We used SPI Index (McKee, Doesken, and Kleist Citation1993) to identify meteorological droughts. SPI is a dimensionless index based on the probability distribution of precipitation, which can be used for multiple time scales such as monthly, seasonal, annual, or for long-term (more than two years) drought assessments. We have selected the three time scales (24, 48, and 60-months) for estimating long-term droughts. The 24, 48, and 60-months represent the cumulative deficit/surplus of precipitation for the two, four, and five consecutive years. The Gamma distribution was fitted for each grid to characterize the cumulative probability distribution (CDF) of the precipitation as in the previous studies (Mishra, Cherkauer, and Bowling Citation2010; Sohn et al. Citation2012).
It is essential to fit a gamma probability density to the total precipitation, for assessing SPI indices. The gamma distribution function (г(α)) is fitted to the precipitation dataset that includes a shape factor and a scale factor, termed as α and β, respectively, which involves an estimation for each year and time scale. For this, the maximum likelihood solutions are applied. If the amount of precipitation is represented by x, the cumulative probability (G(x)), can be considered by:
(1)
(1) When x is equal to zero, the gamma function remains undefined and the precipitation distribution may contain zeros (McKee, Doesken, and Kleist Citation1993), and the definition of cumulative probability (H(x)) changes to (Bahrami, Bazrkar, and Zarei Citation2019):
(2)
(2) where q represents the probability of a zero. The cumulative probability is then transformed to the standard normal random variable Z with mean zero and variance of one, which represents the value of the SPI.
3.2. Standardized precipitation evapotranspiration index method
We used the SPEIIndex (Vicente-Serrano, Beguería, and López-Moreno Citation2010) using precipitation and potential evapotranspiration (PET). Monthly PET was estimated using monthly minimum and maximum air temperature and extra-terrestrial radiation by Hargraves–Samani method (Hargreaves and Samani Citation1982).
SPEI was estimated by fitting the current difference of precipitation (P) and PET to the gamma distribution (Vicente-Serrano, Beguería, and López-Moreno Citation2010). SPEI has been widely used in drought studies (Kumar et al. Citation2013; Shah and Mishra Citation2014; Das et al. Citation2016; Mallya et al. Citation2016; Tiwari and Mishra Citation2019). With a value for PET, the difference between the precipitation P and PET for the month i is computed using
(3)
(3) where Pi stands for precipitation (mm), and PETi represents the potential evapotranspiration (mm) assessed by using the Hargreaves method (Hargreaves and Samani Citation1982).
The establishment of the water balance series in different time scales was executed as follows:
(4)
(4) where k represents the time scale (month), and n shows the calculation times.
Fitting the recognized series with three parameter log-logistic probability density function was applied as follows:
(5)
(5) where β shows the shape parameter, α gives the scale parameter and γ gives the original parameter. All the parameters can be acquired by using the L-torque parameter estimation method. Then the cumulative probability in a given time scale can be assessed as
(6)
(6)
After a standard normal distribution process, the SPEI can be assessed by
(7)
(7) When P ≤ 0.5, P = 1−F(x); When P > 0.5, P = 1−P, and the symbol of the SPEI is reversed. The constants are C0 = 2.515517, C1 = 0.802853, C2 = 0.010328, d1 = 1.432788, d2 = 0.189269, and d3 = 0.001308 (Vicente-Serrano, Beguería, and López-Moreno Citation2010; Wang et al. Citation2015). We used the SPEI time scales of 24, 48, and 60 months, which are referred to as SPEI-24, SPEI-48, and SPEI-60 in this paper. Droughts are classified as exceptional (SPI/SPEI less than−2.0), extreme (SPI/SPEI from −1.6 to −1.9), severe (SPI/SPEI between −1.3 and −1.5), and moderate (SPI/SPEI between −0.5 and −1.2).
3.3. Drought characteristics
The drought index values (SPI and SPEI) were studied to extract drought characteristics such as areal extent, intensity, events, and frequency. The area under −1.2 SPI/SPEI value was used to estimate the drought extent for different years. A single drought event can occur in a single month/year or consecutive multiple months/years. Drought severity (DSe) gives the absolute value of the sum of all SPI/SPEI values during a drought event (Tan, Yang, and Li Citation2015).
(8)
(8) Drought intensity (DIe) of a drought event refers to severity divided by the duration.
(9)
(9) In Equation (8), the subscript e refers to a drought event while j represents a drought month. In addition, Index j represents the SPI value in month j while m represents the duration of a drought event (e). The DF was assessed based on Equation (10).
(10)
(10) where ns equals the number of drought events, Ns gives the total number of years for the study period and s is a station.
3.4. Pearson correlation coefficient
Trend of areal extent of drought is assessed by the slope of the linear regression method and the relationship between droughts and terrestrial water storage is computed by the Pearson correlation coefficient in this study. Correlation and slope can be obtained from the following equations:
(11)
(11)
(12)
(12)
(13)
(13)
(14)
(14) where r represents the Pearson correlation coefficient;
gives the covariance between two variables x and y; sx and sy represents the standard deviations of x and y series of variables; n shows the total number of observations;
and
represent the mean of x and y; and a and b are intercept and slope.
4. Results
4.1. Trend of precipitation, temperature, and calculated PET in India
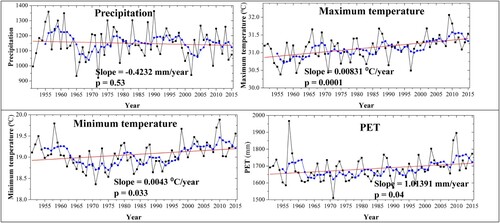
shows long-term (1951–2015) precipitation, temperature, and PET on an annual time scale over India. The precipitation shows a negative trend (slope = −0.42 mm/year and p = 0.53) with time, the negative fluctuations are more between 1965 and 1975 and again after 1995, the moving average indicates more negative fluctuations around 1965–1975 and around 2000–2005. Since 1950, declined trend of monsoon precipitation are observed (Bollasina, Ming, and Ramaswamy Citation2011; Mishra, Shah, and Thrasher Citation2014; Roxy et al. Citation2015). The maximum temperature indicates a steady increasing trend of 0.0083°C/year (p = 0.0001) and the minimum temperature shows an increase of 0.0043°C/year (p = 0.03). Previous studies were found on the increasing trend of temperature in India (Jain and Kumar Citation2012; Mondal, Khare, and Kundu Citation2015). The PET indicates an increasing trend of 0.6979 mm/year (p = 0.04) up to 2015 due to the increasing trend of minimum and maximum air temperature in India. Increasing trend of PET was observed due to increased air temperature by Kundu, Khare, and Mondal (Citation2017). Increasing trend of air temperature results in more evaporation, which helps to increase drought (Dai Citation2011).
Figure 2. Trend in precipitation, temperature (maximum and minimum), and PET on annual time scale from 1951 to 2015. Precipitation and PET were calculated in total amount in a year and temperature is in average value. Line with square marker shows actual value, line with round marker shows 5-years moving average (estimated from actual), and straight line shows best fit line (linear regression) using actual value. Temperature (minimum and maximum) and PET trend were increasing while precipitation was decreasing.
4.2. Characteristics of major long-term droughts in India (1951–2015)
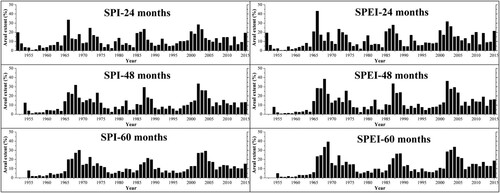
Drought area as indicated by SPI and SPEI is shown in on long-term scales of 24, 48, and 60 months from 1951 to 2015. The 24 month drought from SPI shows highest five drought areas in 1966 (33.58%), 1972 (24.62%), 1987 (23.39%), 2002 (28.36%), and 2003 (23.22%), and the 24 month drought of SPEI shows the highest drought area in 1966 (43.15%), 1986 (23.93%), 1987 (27.93%), 2002 (31.67%), and 2003 (26.42%). The 48 months SPI shows the highest drought area in 1968 (31.78%), 1987 (29.46%), 2002 (33.24%), 2003 (26.04%), and 2004 (25.89%), and SPEI shows highest drought in 1966 (28.43%), 1968 (38.40%), 1987 (33.33%), 2002 (36.23%), 2004 (29.33%). The 60 months SPI shows the highest drought area in 1968 (27.18%), 1969 (30.19%), 2002 (27.01%), 2003 (27.35%), and 2004 (29.24%), and SPEI shows the highest drought area in 1968 (33.52%), 1969 (39.30%), 2002 (28.57%), 2003 (30.40%) 2004 (33.69%). We observed major five droughts at different time scales which were found in 1966–1969, 1972, 1986–1987, and 2002–2004, respectively. Significant drought events in 1965, 1972, 1987, and 2002 were identified by Mallya et al. (Citation2016) using Standard Precipitation Index (SPI), Standardized Precipitation-Evapotranspiration Index (SPEI), Hidden Markov Model-based Drought Index (HMMDI), and Gaussian Mixture Model-based Drought Index (GMM-DI) at 12 months time scale during 1901–2004.
Figure 3. Comparison of areal extent (%) of droughts using SPI and SPEI from 1951 to 2015 in India. Droughts were estimated on long term time scales (24, 48, and 60 months). Top five drought years were observed in 1966 to 1969, 1987 to 1988, and 2002 to 2005 except 1972 (SPI24). Drought area was considered as < -1.2 of SPI/SPEI.
4.3. Drought characteristics in India
Drought extent and events of Indian river basins are given in (drought events distributed map in Appendix 1). The drought extent and events were calculated as the average of 1951–2015 considering the area of individual river basins. The Mahi basin has maximum drought extent (18.52–21.92% in respect to basin area) in all time scales (24, 48, and 60 months) of SPI and SPEI. The minimum drought extent is observed in the South coast basin for all time scales of SPI and for 24 months time scale in SPEI. The Cauvery and the Godavari indicate the minimum drought extent in SPEI 48 and SPEI 60 months time scale, respectively. The drought extent of major river basins of India like Indus varies from 16.27% (SPI24) to 18.54% (SPEI60), Ganga from 15.51% (SPI24) to 17.45% (SPEI48), Brahmaputra from 14.92% (SPI24) to 17.54% (SPEI48 and SPEI60), Narmada from 16.15% (SPI24) to 18.98% (SPEI60), Godavari from 14.31% (SPI60) to 17.00% (SPEI24), Krishna from 14.25% (SPI60) to 16.02% (SPEI24), and Cauvery from 13.29% (SPI48) to 16.57% (SPEI60).
Table 1. Drought extent and drought events (basin-average) in Indian river basins (1951–2015).
The maximum drought events are observed in Subarnarekha (10.49 in SPI24 and 10.14 in SPI48), Indus (10.71 in SPI60, 11.91 in SPEI48, and 11.89 in SPEI60), and Mahi (11.33 in SPEI24). Minimum drought events are found in South coast (8.45 in SPI24, 7.91 in SPI48, and 7.47 in SPI60), Cauvery (9.68 in SPEI24 and 10.22 in SPEI48), and Godavari (9.97 in SPEI60). The drought events of other major river basins of India like Ganga, Brahmaputra, Narmada, and Krishna vary from 9.21 to 11.35.
The drought frequency and drought density are shown in (distributed map in Appendix 1). The maximum drought frequency is observed in Subarnarekha (16.39 in SPI24), Indus (17.03 in SPI48, 17.56 in SPI60, 19.22 in SPEI48, 19.50 in SPEI60), and Mahi (17.71 in SPEI24). The minimum drought frequency is found in South coast (13.21 in SPI24, 12.76 in SPI48, and 12.25 in SPI60), Cauvery (15.12 in SPEI24 and 16.48 in SPEI48), and Godaveri (16.35 in SPEI60). The drought frequency of other major river basins (Ganga, Brahmaputra, Narmada, and Krishna) varies from 14.39–18.52.
Table 2. Drought frequency and drought intensity (basin-average) in Indian river basins (1951–2015).
The highest drought intensity is observed in East coast (−2.08 in SPI24, −2.12 in SPI48, and −2.04 in SPI60), Cauvery (−1.57 in SPEI24 and −1.52 in SPEI48), and Tapi (−1.52 in Tapi), while the low intensity of drought is found in Northeast coast (−1.43 in SPI24), Krishna (−1.45 in SPI48 add −1.44 in SPI60), Indus (−1.44 in SPEI24 and −1.43 in SPEI48), and Subarnarekha (−1.41 in SPEI60). The drought intensity of major river basins in India (Ganga, Brahmaputra, Narmada, and Godavari show less variation (−1.64 to −1.44).
4.4. Trend of area under the long-term drought during 1951–2015 in India
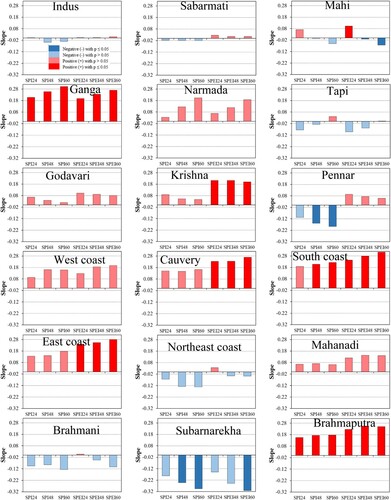
Drought area of different river basins was estimated using SPI and SPEI in long-term time scales of 24, 48, and 60 months from 1951 to 2015. Furthermore, the trend (positive or negative) of areal extent of drought was calculated using linear regression method. Long-term drought trend of different river basins in India as shown in . In majority of the basins, SPI indicated negative or non-significant positive drought condition, while SPEI indicated significantly or non-significant positive drought. In Indus, SPI showed non-significant negative drought trend and SPEI showed positive drought, however, the magnitude of the trend is low. Archer and Fowler (Citation2004) noticed the increasing trend of precipitation and Chaudhry and Rasul (Citation2007) reported the increasing mean temperature during 1961–2000. Increased temperature in Indus can be linked to increased PET, which in turn affects the SPEI based drought extent. In the Ganga basin, both methods showed significant positive drought trend with the trend magnitude of more than 0.16 mm yr−1. This positive drought trend may occur due to the decreasing trend of precipitation as reported by Singh et al. (Citation2008) and the increasing trend of mean temperature noticed by Nepal and Shrestha (Citation2015). In Narmada basin, both the methods indicated non-significant positive trend, which can be associated with increased precipitation in western India. In most of the basins, the intensity of 60 months drought is more than the 24 or 48-month droughts. In the Tapi basin, the 24 and 48-month drought with the SPI indicated negative trend or no drought, but the 60-month drought displays a positive trend. Hence, it implies an increase in 60 months droughts than 24 or 48 months droughts. In Pennar basin, the SPI showed negative trend, while the SPEI showed a positive drought trend. The difference is the effect of temperature, which is an important parameter in the SPEI method. The Krishna, Cauvery, Brahmaputra, Mahanadi, West coast, South Coast, East Coast, and Godavari basins showed high magnitude of positive drought trend in the SPEI method and the affected area is more in long-term droughts (except Krishna). In Krishna and Godavari basins, magnitude of trend showed increased 24 and 48-month droughts. Mahi basin also indicated a positive trend in the 24-month drought, while the trend is negative in long-term 60 months droughts. Subarnarekha, Brahmani, and Northeast showed significant and non-significant negative trend in drought area of different time periods. Ganga, Krishna, Cauvery, South Coast, East Coast, and Brahmaputra show significant droughts with the p-value of less than 0.05. Therefore, most of the river basins in India showed the positive trend in drought area using SPI and SPEI in long-term time scales of 24, 48, and 60 months from 1951 to 2015.
Figure 4. Changes in long term (24, 48, and 60 months) drought area (% per year) in Indian river basins (eighteen river basins) by SPI and SPEI methods for the period of 1951-2015. Changes were estimated using liner regression for computing slope (statistically significant or not at the 5% level) using the area in percentage (%) of droughts (1951-2015). A p value of less than 0.05 indicates statistically significant changes.
4.5. Trend in terrestrial water storage of river basins in India (2002–2015)
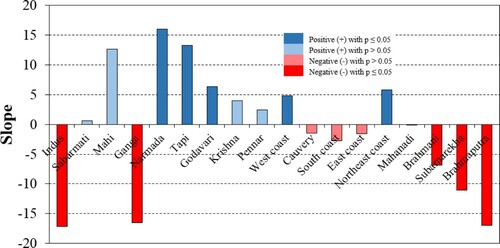
shows the magnitude of change in TWS in different Indian river basins from 2002 to 2015. We observed that major river basins of Ganga, Indus, Brahmaputra, Brahmani, and Subarnarekha experienced a significant (p < 0.05) negative trend in TWS during 2002–2015. Human activities have more impact on TWS of Ganga and Indus basins (Van Beek, Wada, and Bierkens Citation2011). For instance, the decreasing trend of precipitation is observed in the Ganga basin from 2000 to 2015 (Mondal, Lakshmi, and Hashemi Citation2018), while irrigation using groundwater is carried out in the same region for agriculture (Asoka et al. Citation2017). Non-significant decrease is found in the Cauvery, South Coast, Mahanadi, and East Coast. Hence, in these river basins, shortage of water storage is evident over the 14-year period. In the previous section, we observed that the drought condition was significantly higher for Ganga and Brahmaputra for all 24, 48, and 60 months droughts. Trends indicate decline in the TWS and an increase in the long-term droughts in these major basins, which may cause problem in water availability in the future. However, although Indus was not affected by extreme droughts, but fall in TWS indicates an overall shortage of water during this period, which can be attributed to groundwater pumping. The rest of the river basins showed an increased trend of TWS, with a significant rise in the Narmada, Tapi, Godavari, West Coast, and Northeast Coast. Brahmani and Subarnarekha displayed a decreased trend of both droughts and TWS.
Figure 5. Changes in total water storage (TWS) in Indian river basins from 2002 to 2015. Changes in TWS were estimated by liner regression for estimating slope, indicating statistically significant changes at the 5% level (p value of less than 0.05).
4.6. Relationship between droughts and terrestrial water storage
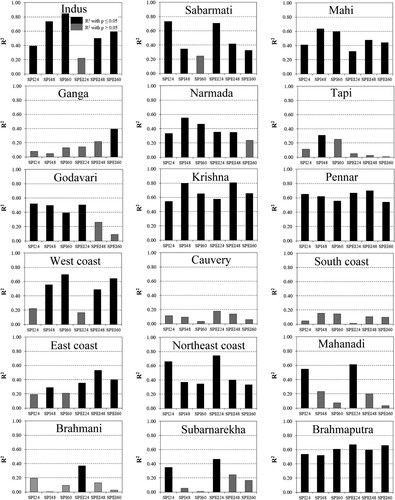
We analyzed the correlation between drought and TWS from 2002 to 2015, which is illustrated in (distributed map in Appendix 2). Significant correlation between TWS and drought is indicated in the majority of the river basins for different drought durations ranging from 24 to 60 months. Few basins such as the West Coast and East Coast indicate significant correlation (p < 0.05) for the long-term of 48 and 60-month droughts. We observe a positive correlation in all the basins except Indus and South Coast, where the correlation implies no effect of droughts on the water storage or significant and non-significant negative correlation. The impact of drought on TWS is, therefore, evident over 13 years in most of the major river basins. Ganga and Brahmaputra indicated an increasing trend of drought area which is reflected in the lowering of TWS. However, Indus showed a decreasing trend in drought area and it shows that the drought does not significantly impact the TWS of the basin. In South coast, however, although the trend in drought area is showing an increase, it is not resulting in the decrease of TWS of the basin.
Figure 6. Correlation between droughts (SPI and SPEI methods with time scale of 24, 48, and 60 months) and TWS during 2002-2015. Correlation with statistically significant or not at the 5% level (p value less than 0.05) was estimated. Strong correlation indicates that the drought strongly impacts TWS.
However, drought indices (SPI and SPEI) showed that droughts have significantly impacted the TWS of India and with the long-term drought events of many months, pressure will be built on the total water storage. In India, SPI and groundwater anomaly shows a negative trend during 2002–2013 drought event (Asoka et al. Citation2017). Variation in the monsoon precipitation influences the groundwater storage in India (Asoka et al. Citation2017). The maximum precipitation (80% in respect to total annual precipitation) occurs during the southwest monsoon (June to September) in India (Mishra et al. Citation2016). Previous studies observed that the precipitation declines when the positive sea surface temperature (SST) anomalies occur over the Indian Ocean (Kumar et al. Citation2006; Mishra et al. Citation2012; Shah and Mishra Citation2016). The El Niño-Southern Oscillation (ENSO) affects the Indian monsoon rainfall, which can influence the SST over the Indian Ocean (Kumar, Rajagopalan, and Cane Citation1999; Krishnamurthy and Shukla Citation2000; Mishra et al. Citation2016). Therefore, the relationship between precipitation and groundwater levels was positive while the relationship between SST and precipitation was negative in India. The ENSO plays an important role in groundwater storage in India (Ashok et al. Citation2004; Roxy et al. Citation2014). The SST anomaly was positive, which might have caused precipitation deficits in 2014. The ENSO might be the cause of 2014–2015 drought in the Indo-Gangetic Plain (Mishra et al. Citation2016).
4.7. Estimation of total water in India
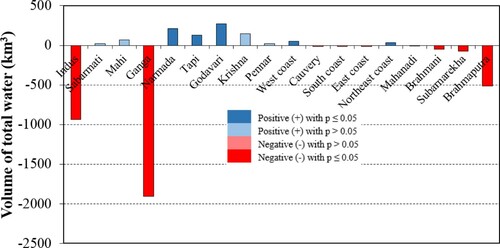
We have estimated the change in the volume of TWS in different major river basins of India from 2002 to 2015 (), using a linear regression method. Indus, Ganga, and Brahmaputra are the major river basins with a significant volume of water loss (p < 0.05). Brahmani and Subarnarekha also showed a significantly decreased volume of water. The rest of the river basins showed an increased volume of TWS. However, Indus, Ganga, and Brahmaputra are major large river basins located in the northern part of India and significant loss of water from these basins in the 14 years can have a considerable impact on the respective regions. The Ganga basin experienced about 1900 km3 of loss of water volume, Indus shows about 900 km3 losses and Brahmaputra indicates about 500 km3 of water losses.
Figure 7. Estimation of total water loss using TWS during 2002-2015 in Indian river basins with statistically significant or not at the 5% level (p value less than 0.05). Volume of total water loss was estimated using slope (linear regression method) of TWS.
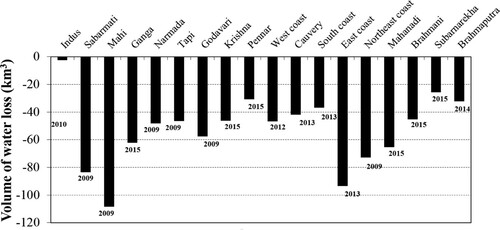
We also identified the recent long-term droughts affecting different river basins and loss of water using TWS (). Mahi showed highest loss of water in 2009 drought (about 110 km3) among all the river basins. Narmada, Godavari, Tapi, and Northest Coast also indicated highest impact from the 2009 drought. The effect of drought was low in Indus basin and 2010 drought had the most adverse effect among the recent droughts. Ganga showed water loss of more than 60 km3 in 2015 drought and 2014 drought had the highest impact in the Brahmaputra basin (about 30 km3 of water loss). East Coast river basin showed a maximum water loss in 2013 drought of about more than 90 km3 followed by the highest loss of Mahi river basin in 2009. Sabarmati river basin experienced highest loss in the most recent 2019 drought with water loss of more than 80 km3. Among the major rivers, Mahanadi experienced a loss of more than 60 km3 in the 2015 drought. In the last 4 years from 2015 to 2019, 8 river basins were affected by long-term severe droughts and 12 out of 18 river basins experienced long-term drought impact in this decade from 2012 to 2019.
Figure 8. Estimation of water loss using TWS due to the most recent long-term drought in various river basins in India.
5. Discussions and conclusions
Long-term drought events have impacted agriculture and socio-economic conditions in nineteenth and twentieth centuries in India (Mishra et al. Citation2019). The quantification of available water resource loss during long-term droughts is challenging in different river basins in India using in-situ observations and satellite datasets. In the present study, we observed the changes in long-duration droughts in major river basins of India using two drought indices (SPI and SPEI). In calculating the drought index, we considered different time scales such as 24, 48, and 60 months for the period 1951–2015. The long-duration drought impact on available water was evaluated for India. We estimated the water loss due to long-term drought during 2002–2015 in the various Indian river basins. The results illustrated that the top three river basins (Indus, Ganga, and Brahmaputra) were showing a significantly (p < 0.05) decreasing trend of water storage, which is similar to the past studies (Rodell, Velicogna, and Famiglietti Citation2009; Tiwari, Wahr, and Swenson Citation2009; Asoka et al. Citation2017). Furthermore, we observed that maximum water loss (95.17%) in India from these three river basins covers about 47.71% area. The recent drought-affected area has increased in India (Shewale and Kumar Citation2005), similar to our observations in this work. Moreover, we found that the trend of drought-affected area increased in most of the Indian river basins.
Most of the Indian states rely on groundwater (GW) for drinking and irrigation activities (Nair and Indu Citation2020). In the northwestern parts, excessive groundwater draft has caused a decline in GW storage (Rodell, Velicogna, and Famiglietti Citation2009; Tiwari, Wahr, and Swenson Citation2009; Chen et al. Citation2014; Goldin Citation2016). Depletion in the TWS was higher due to anthropogenic factors, but the rate of decrease became slow due to increased precipitation in the recent decades (Asoka and Mishra Citation2020). Severe droughts again adversely affect the GW depletion rate. Previous studies have shown that long-term droughts affect the water storage (Ambika and Mishra Citation2019; Mishra Citation2020). Again, extreme and unsustainable pumping of groundwater for the purpose of irrigation and declining precipitation can result in groundwater depletion. In India, depletion of groundwater is reported widely in the works of Asoka et al. (Citation2017), Matthew Rodell, Velicogna, and Famiglietti (Citation2009) and Tiwari, Wahr, and Swenson (Citation2009).
After 2012, the influence of groundwater pumping for the production of crops was observed to be higher than climatic influence in northwest India. However, climate effects are intensified and shortage of water storage is observed when precipitation is low along with heavy pumping. In northwest India, a negative correlation is observed between NDVI and groundwater storage anomaly, indicating a link of greening of vegetation and depletion of groundwater due to pumping for irrigation (Asoka and Mishra Citation2019).
Long-term drought impacts water storage as observed in our study and this is consistent with previous studies (Ambika and Mishra Citation2019; Mishra Citation2020). Our observation is mainly based on satellite-based GRACE data with coarse resolution to estimate the available water loss, which can be further improved using high-resolution long-term satellite data.
Following conclusions can be made based on our main objective:
The decreasing trend (slope = −0.42 mm/year and p = 0.53) of annual precipitation is found while increasing trend is observed for both maximum (0.0083°C/year and p = 0.0001) and minimum temperatures (0.0043°C/year and p = 0.03), and estimated PET (0.6979 mm/year and p = 0.04) in India from 1951 to 2015.
We observed major long-term (24, 48, and 60 months) drought events, which were observed in 1966–1969, 1972, 1986–1987, and 2002–2004, respectively, in India using SPI and SPEI methods.
In the major river basins like Ganga, Brahmaputra, Narmada in India, the mean drought extent, events, frequency, intensity varies from 14.92% to 18.98%, 9.21–11.35, 14.39–18.52, and −1364 to −1.44, respectively.
We observed that many river basins (63.66% area) experienced an increasing trend in areal extent of drought using two drought (SPI and SPEI) indices with different time scales during the observed period (1951–2015), while two river basins (3.35% area) showed a decreasing trend. Other areas (32.99% area) attributed to a mixed type of trend pattern (positive and negative).
Recent trends (2002–2015) of satellite-based TWS of major five river basins (51.05% area) such as the Indus, Ganga, Brahmani, Subarnarekha, and Brahmaputra attributed a significant decreasing trend while other five river basins (19.49% area) such as Narmada, Tapi, Godavari, West coast, and Northeast coast illustrated a significant increasing trend.
We found that drought (SPI and SPEI) and satellite-based TWS experienced a positive correlation in all river basins except Indus, South coast, and Brahmani (16.05% area) from the period of 2002–2015. Therefore, this positive correlation indicated that major droughts significantly impacted the water storage in India.
We observed that the total volume of water declined as −3527 km3 in nine river basins covering 61.65% area and increased 943 km3 in nine river basins covering 38.35% area in India during 2002–2015. Most recent drought events in different river basins occurred in 2009–2015 and total volume of water declined about −943.72 km3.
Future studies can leverage on recently developed new improved surface hydrological characterization – high spatial resolution soil moisture data that are obtained after downscaling the passive microwave retrievals using vegetation and surface temperature (Fang et al. Citation2013; Fang and Lakshmi Citation2014; Fang et al. Citation2018) or high-resolution radar backscatter (Narayan, Lakshmi, and Jackson Citation2006; Narayan and Lakshmi Citation2008).
Acknowledgements
The authors acknowledge the data from the India Meteorological Department (IMD): www.imd.gov.in and GRACE: https://grace.jpl.nasa.gov. We wish to acknowledge funding from NASA grant 80NSSC19K0918, program manager Dr Bradley Doorn that supported this work. The authors are also extremely thankful to Dr Vimal Mishra for his constant support and valuable contribution in this paper.
Disclosure statement
No potential conflict of interest was reported by the author(s).
Additional information
Funding
Notes
Note: Bold and italic values indicate maximum and minimum, respectively.
Note: Bold and italic values indicate maximum and minimum, respectively.
References
- Aadhar, Saran, and Vimal Mishra. 2017. “High-resolution Near Real-Time Drought Monitoring in South Asia.” Scientific Data 4: 170145.
- Ambika, A. K., and V. Mishra. 2019. “Observational Evidence of Irrigation Influence on Vegetation Health and Land Surface Temperature in India.” Geophysical Research Letters 46 (22): 13441–13451.
- Archer, David R, and Hayley J Fowler. 2004. “Spatial and Temporal Variations in Precipitation in the Upper Indus Basin, Global Teleconnections and Hydrological Implications.” Hydrology and Earth System Sciences 8 (1): 47–61.
- Ashok, Karumuri, Zhaoyong Guan, N. H. Saji, and Toshio Yamagata. 2004. “Individual and Combined Influences of ENSO and the Indian Ocean Dipole on the Indian Summer Monsoon.” Journal of Climate 17 (16): 3141–3155.
- Asoka, Akarsh, Tom Gleeson, Yoshihide Wada, and Vimal Mishra. 2017. “Relative Contribution of Monsoon Precipitation and Pumping to Changes in Groundwater Storage in India.” Nature Geoscience 10 (2): 109–117.
- Asoka, A., and V. Mishra. 2019. “Groundwater Pumping to Increase Food Production Causes Persistent Groundwater Drought in India.” arXiv preprint arXiv:1908.00255.
- Asoka, A., and V. Mishra. 2020. “Anthropogenic and Climate Contributions on the Changes in Terrestrial Water Storage in India.” Journal of Geophysical Research: Atmospheres 125 (10): e2020JD032470. doi:https://doi.org/10.1029/2020JD032470.
- Asoka, Akarsh, Yoshihide Wada, Ram Fishman, and Vimal Mishra. 2018. “Strong Linkage Between Precipitation Intensity and Monsoon Season Groundwater Recharge in India.” Geophysical Research Letters 45 (11): 5536–5544.
- Bahrami, Mehdi, Samira Bazrkar, and Abdol Rassoul Zarei. 2019. “Modeling, Prediction and Trend Assessment of Drought in Iran Using Standardized Precipitation Index.” Journal of Water and Climate Change 10 (1): 181–196.
- Bollasina, Massimo A, Yi Ming, and V. Ramaswamy. 2011. “Anthropogenic Aerosols and the Weakening of the South Asian Summer Monsoon.” Science 334 (6055): 502–505.
- Chaudhry, Q. Z., and G. Rasul. 2007. “Development of a Mesoscale Convective System Over the Foothills of Himalaya Into a Severe Storm. Mountains Witnesses of Global Changes.” Development 30: 60–77.
- Chen, J., J. Li, Z. Zhang, and S. Ni. 2014. “Long-term Groundwater Variations in Northwest India from Satellite Gravity Measurements.” Global and Planetary Change 116: 130–138. doi:https://doi.org/10.1016/j.gloplacha.2014.02.007.
- Chen, J. L., C. R. Wilson, B. D. Tapley, Z. L. Yang, and Guo-Yue Niu. 2009. “2005 Drought Event in the Amazon River Basin as Measured by GRACE and Estimated by Climate Models.” Journal of Geophysical Research: Solid Earth 114 (B05404): 1–9.
- Dai, Aiguo. 2011. “Characteristics and Trends in Various Forms of the Palmer Drought Severity Index During 1900–2008.” Journal of Geophysical Research: Atmospheres 116 (D12115): 1–26.
- Das, Prabir Kumar, Dibyendu Dutta, J. R. Sharma, and V. K. Dadhwal. 2016. “Trends and Behaviour of Meteorological Drought (1901–2008) Over Indian Region Using Standardized Precipitation – Evapotranspiration Index.” International Journal of Climatology 36 (2): 909–916.
- Fang, Bin, and Venkat Lakshmi. 2014. “Soil Moisture at Watershed Scale: Remote Sensing Techniques.” Journal of Hydrology 516: 258–272.
- Fang, Bin, Venkataraman Lakshmi, Rajat Bindlish, and Thomas J Jackson. 2018. “Downscaling of SMAP Soil Moisture Using Land Surface Temperature and Vegetation Data.” Vadose Zone Journal 17 (1): 1–15.
- Fang, Bin, Venkat Lakshmi, Rajat Bindlish, Thomas J Jackson, Michael Cosh, and Jeffrey Basara. 2013. “Passive Microwave Soil Moisture Downscaling Using Vegetation Index and Skin Surface Temperature.” Vadose Zone Journal 12 (3): 1–19.
- Goldin, T. 2016. “Groundwater: India’s Drought Below Ground.” Nature Publishing Group 9 (2): 98. doi:https://doi.org/10.1038/ngeo2648.
- Hargreaves, George H, and Zohrab A Samani. 1982. “Estimating Potential Evapotranspiration.” Journal of the Irrigation and Drainage Division 108 (3): 225–230.
- Jain, Sharad K, and Vijay Kumar. 2012. “Trend Analysis of Rainfall and Temperature Data for India.” Current Science 102 (1): 37–49.
- Joshi, Nitin, Divya Gupta, Shakti Suryavanshi, Jan Adamowski, and Chandra A Madramootoo. 2016. “Analysis of Trends and Dominant Periodicities in Drought Variables in India: A Wavelet Transform Based Approach.” Atmospheric Research 182: 200–220.
- Krishnamurthy, V., and Jagadish Shukla. 2000. “Intraseasonal and Interannual Variability of Rainfall Over India.” Journal of Climate 13 (24): 4366–4377.
- Kulkarni, Sneha S, Brian D Wardlow, Yared A Bayissa, Tsegaye Tadesse, Mark D Svoboda, and Shirishkumar S Gedam. 2020. “Developing a Remote Sensing-Based Combined Drought Indicator Approach for Agricultural Drought Monitoring Over Marathwada, India.” Remote Sensing 12 (13): 2091.
- Kumar, Vijay, and Sharad K Jain. 2011. “Trends in Rainfall Amount and Number of Rainy Days in River Basins of India (1951–2004).” Hydrology Research 42 (4): 290–306.
- Kumar, K Krishna, Balaji Rajagopalan, and Mark A Cane. 1999. “On the Weakening Relationship Between the Indian Monsoon and ENSO.” Science 284 (5423): 2156–2159.
- Kumar, K Krishna, Balaji Rajagopalan, Martin Hoerling, Gary Bates, and Mark Cane. 2006. “Unraveling the Mystery of Indian Monsoon Failure During El Niño.” Science 314 (5796): 115–119.
- Kumar, K Niranjan, M. Rajeevan, D. S. Pai, A. K. Srivastava, and B. Preethi. 2013. “On the Observed Variability of Monsoon Droughts Over India.” Weather and Climate Extremes 1: 42–50.
- Kundu, Sananda, Deepak Khare, and Arun Mondal. 2017. “Interrelationship of Rainfall, Temperature and Reference Evapotranspiration Trends and Their Net Response to the Climate Change in Central India.” Theoretical and Applied Climatology 130 (3-4): 879–900.
- Lakshmi, Venkat, Thomas Piechota, Ujjwal Narayan, and Chunling Tang. 2004. “Soil Moisture as an Indicator of Weather Extremes.” Geophysical Research Letters 31 (11): L11401. doi:https://doi.org/10.1029/2004GL019930.
- Long, Di, Bridget R Scanlon, Laurent Longuevergne, Alexander Y Sun, D. Nelun Fernando, and Himanshu Save. 2013. “GRACE Satellite Monitoring of Large Depletion in Water Storage in Response to the 2011 Drought in Texas.” Geophysical Research Letters 40 (13): 3395–3401.
- Mallya, Ganeshchandra, Vimal Mishra, Dev Niyogi, Shivam Tripathi, and Rao S Govindaraju. 2016. “Trends and Variability of Droughts Over the Indian Monsoon Region.” Weather and Climate Extremes 12: 43–68.
- Mallya, Ganeshchandra, Shivam Tripathi, and Rao S Govindaraju. 2019. “An Analysis of Spatio-Temporal Changes in Drought Characteristics Over India.” In Hydrology in a Changing World, edited by S. Singh, and C. Dhanya, 23–71. Cham: Springer. doi:https://doi.org/10.1007/978-3-030-02197-9_2.
- McKee, Thomas B, Nolan J Doesken, and John Kleist. 1993. “The Relationship of Drought Frequency and Duration to Time Scales.” Paper presented at the Proceedings of the 8th Conference on Applied Climatology, Anaheim, California, 17–22 January 1993.
- Mishra, Vimal. 2020. “Long-term (1870–2018) Drought Reconstruction in Context of Surface Water Security in India.” Journal of Hydrology 580: 124228.
- Mishra, Vimal, Saran Aadhar, Akarsh Asoka, Sivananda Pai, and Rohini Kumar. 2016. “On the Frequency of the 2015 Monsoon Season Drought in the Indo-Gangetic Plain.” Geophysical Research Letters 43 (23): 12, 102–112.
- Mishra, Vimal, Keith A Cherkauer, and Laura C Bowling. 2010. “Parameterization of Lakes and Wetlands for Energy and Water Balance Studies in the Great Lakes Region.” Journal of Hydrometeorology 11 (5): 1057–1082.
- Mishra, A. K., and V. R. Desai. 2005. “Drought Forecasting Using Stochastic Models.” Stochastic Environmental Research and Risk Assessment 19 (5): 326–339.
- Mishra, Vimal, Reepal Shah, Syed Azhar, Harsh Shah, Parth Modi, and Rohini Kumar. 2018. “Reconstruction of Droughts in India Using Multiple Land-Surface Models (1951–2015).” Hydrology and Earth System Sciences 22 (4): 2269–2284.
- Mishra, Vimal, Reepal Shah, and Bridget Thrasher. 2014. “Soil Moisture Droughts Under the Retrospective and Projected Climate in India.” Journal of Hydrometeorology 15 (6): 2267–2292.
- Mishra, Ashok K, and Vijay P Singh. 2010. “A Review of Drought Concepts.” Journal of Hydrology 391 (1–2): 202–216.
- Mishra, Vimal, Brian V Smoliak, Dennis P Lettenmaier, and John M Wallace. 2012. “A Prominent Pattern of Year-to-Year Variability in Indian Summer Monsoon Rainfall.” Proceedings of the National Academy of Sciences 109 (19): 7213–7217.
- Mishra, Vimal, Amar Deep Tiwari, Saran Aadhar, Reepal Shah, Mu Xiao, D. S. Pai, and Dennis Lettenmaier. 2019. “Drought and Famine in India, 1870–2016.” Geophysical Research Letters 46 (4): 2075–2083.
- Mondal, Arun, Deepak Khare, and Sananda Kundu. 2015. “Spatial and Temporal Analysis of Rainfall and Temperature Trend of India.” Theoretical and Applied Climatology 122 (1–2): 143–158.
- Mondal, Arun, Venkat Lakshmi, and Hossein Hashemi. 2018. “Intercomparison of Trend Analysis of Multisatellite Monthly Precipitation Products and Gauge Measurements for River Basins of India.” Journal of Hydrology 565: 779–790.
- Nair, A. S., and J. Indu. 2020. “Changing Groundwater Storage Trend of India After Severe Drought.” International Journal of Remote Sensing 41 (19): 7565–7584.
- Narayan, Ujjwal, and Venkat Lakshmi. 2008. “Characterizing Subpixel Variability of low Resolution Radiometer Derived Soil Moisture Using High Resolution Radar Data.” Water Resources Research 44 (6): W06425. doi:https://doi.org/10.1029/2006WR005817.
- Narayan, Ujjwal, Venkat Lakshmi, and Thomas J Jackson. 2006. “High-resolution Change Estimation of Soil Moisture Using L-Band Radiometer and Radar Observations Made During the SMEX02 Experiments.” IEEE Transactions on Geoscience and Remote Sensing 44 (6): 1545–1554.
- Nepal, Santosh, and Arun Bhakta Shrestha. 2015. “Impact of Climate Change on the Hydrological Regime of the Indus, Ganges and Brahmaputra River Basins: A Review of the Literature.” International Journal of Water Resources Development 31 (2): 201–218.
- Pai, D. S., Latha Sridhar, M. Rajeevan, O. P. Sreejith, N. S. Satbhai, and B. Mukhopadhyay. 2014. “Development of a New High Spatial Resolution (0.25× 0.25) Long Period (1901–2010) Daily Gridded Rainfall Data Set Over India and Its Comparison with Existing Data Sets Over the Region.” Mausam 65 (1): 1–18.
- Rodell, Matthew, Isabella Velicogna, and James S Famiglietti. 2009. “Satellite-based Estimates of Groundwater Depletion in India.” Nature 460 (7258): 999–1002.
- Roxy, Mathew Koll, Kapoor Ritika, Pascal Terray, and Sébastien Masson. 2014. “The Curious Case of Indian Ocean Warming.” Journal of Climate 27 (22): 8501–8509.
- Roxy, Mathew Koll, Kapoor Ritika, Pascal Terray, Raghu Murtugudde, Karumuri Ashok, and B. N. Goswami. 2015. “Drying of Indian Subcontinent by Rapid Indian Ocean Warming and a Weakening Land-sea Thermal Gradient.” Nature Communications 6 (1): 1–10.
- Scanlon, Bridget R, Claudia C Faunt, Laurent Longuevergne, Robert C Reedy, William M Alley, Virginia L McGuire, and Peter B McMahon. 2012. “Groundwater Depletion and Sustainability of Irrigation in the US High Plains and Central Valley.” Proceedings of the National Academy of Sciences 109 (24): 9320–9325.
- Shah, Reepal, and Vimal Mishra. 2014. “Evaluation of the Reanalysis Products for the Monsoon Season Droughts in India.” Journal of Hydrometeorology 15 (4): 1575–1591.
- Shah, Reepal D, and Vimal Mishra. 2015. “Development of an Experimental Near-Real-Time Drought Monitor for India.” Journal of Hydrometeorology 16 (1): 327–345.
- Shah, R. D., and V. Mishra. 2016. “Utility of Global Ensemble Forecast System (GEFS) Reforecast for Medium-Range Drought Prediction in India.” Review of. Journal of Hydrometeorology 17 (6): 1781–1800.
- Shah, Deep, and Vimal Mishra. 2020. “Integrated Drought Index (IDI) for Drought Monitoring and Assessment in India.” Water Resources Research 56 (2): e2019WR026284. doi:https://doi.org/10.1029/2019WR026284.
- Shahid, Shamsuddin, and Manzul Kumar Hazarika. 2010. “Groundwater Drought in the Northwestern Districts of Bangladesh.” Water Resources Management 24 (10): 1989–2006.
- Shewale, M. P., and Shravan Kumar. 2005. “Climatological Features of Drought Incidences in India.” Meteorological Monograph (Climatology 21/2005). National Climate Centre, Indian Meteorological Department.
- Singh, Pratap, Vijay Kumar, T. Thomas, and Manohar Arora. 2008. “Changes in Rainfall and Relative Humidity in River Basins in Northwest and Central India.” Hydrological Processes: An International Journal 22 (16): 2982–2992.
- Sinha, Debanjan, Tajdarul H Syed, and John T Reager. 2019. “Utilizing Combined Deviations of Precipitation and GRACE-Based Terrestrial Water Storage as a Metric for Drought Characterization: A Case Study Over Major Indian River Basins.” Journal of Hydrology 572: 294–307.
- Sohn, Soo-Jin, Chi-Yung Tam, Karumuri Ashok, and Joong-Bae Ahn. 2012. “Quantifying the Reliability of Precipitation Datasets for Monitoring Large-Scale East Asian Precipitation Variations.” International Journal of Climatology 32 (10): 1520–1526.
- Swenson, Sean, and John Wahr. 2006. “Post-Processing Removal of Correlated Errors in GRACE Data.” Geophysical Research Letters 33 (8): L08402. doi:https://doi.org/10.1029/2005GL025285
- Tan, Chunping, Jianping Yang, and Man Li. 2015. “Temporal-spatial Variation of Drought Indicated by SPI and SPEI in Ningxia Hui Autonomous Region, China.” Atmosphere 6 (10): 1399–1421.
- Tapley, Byron D, Srinivas Bettadpur, John C Ries, Paul F Thompson, and Michael M Watkins. 2004. “GRACE Measurements of Mass Variability in the Earth System.” Science 305 (5683): 503–505.
- Tiwari, Amar Deep, and Vimal Mishra. 2019. “Prediction of Reservoir Storage Anomalies in India.” Journal of Geophysical Research: Atmospheres 124 (7): 3822–3838.
- Tiwari, V. M., J. Wahr, and S. Swenson. 2009. “Dwindling Groundwater Resources in Northern India, from Satellite Gravity Observations.” Geophysical Research Letters 36: 18.
- Van Beek, L. P. H., Yoshihide Wada, and Marc FP Bierkens. 2011. “Global Monthly Water Stress: 1. Water Balance and Water Availability.” Water Resources Research 47 (7): W07517. doi:https://doi.org/10.1029/2010WR009791.
- Vicente-Serrano, Sergio M, Santiago Beguería, and Juan I López-Moreno. 2010. “A Multiscalar Drought Index Sensitive to Global Warming: The Standardized Precipitation Evapotranspiration Index.” Journal of Climate 23 (7): 1696–1718.
- Wang, Kai-yan, Qiong-fang Li, Yong Yang, Ming Zeng, Peng-cheng Li, and Jie-xiang Zhang. 2015. “Analysis of Spatio-Temporal Evolution of Droughts in Luanhe River Basin Using Different Drought Indices.” Water Science and Engineering 8 (4): 282–290.
- Wilhite, D. A., M. V. K. Sivakumar, and Deborah A. Wood. 2000. Early Warning Systems for Drought Preparedness and Drought Management. Proceedings of an Expert Group Meeting Held in Lisbon, Portugal, 5–7 September 2000. Technical Document No. 1037. Geneva: World Meteorological Organization.
Appenices
Appendix 1: Comparison of long-term drought statistics (drought event, drought intensity, and drought frequency) using SPI and SPEI from 1951 to 2015. Droughts were calculated on different time scales (24, 48, and 60 months). Drought event, drought intensity, and drought frequency were shown in figure.