
 ?Mathematical formulae have been encoded as MathML and are displayed in this HTML version using MathJax in order to improve their display. Uncheck the box to turn MathJax off. This feature requires Javascript. Click on a formula to zoom.
ABSTRACT
Exploring carbon dioxide (CO2) emissions from human activities is essential for urban energy conservation and resource management. Remotely sensed nighttime lights from the Suomi NPP-VIIRS provide spatial consistency in and a low-cost way of revealing CO2 emissions. Although many researches have documented the feasibility of the Suomi NPP-VIIRS data for assessing CO2 emissions, few have systematically revealed the ability of nighttime lights for evaluating CO2 emissions from different industries, such as service industry CO2 emissions (SC), traffic CO2 emissions (TC), and secondary industry CO2 emissions (IC). Here, China was selected as the experimental subject, and we comprehensively explored the relationships between the nighttime lights and SC, TC, and IC, and investigated the factors mediating these relationships. We found that without considering other factors, the nighttime lights only revealed up to 51.2% of TC, followed by 41.7% of IC and 22.7% of SC. When controlling for city characteristic variables, the models showed that there were positive correlations between the Suomi NPP-VIIRS data and SC, IC, and TC, and that nighttime lights have an Inverted-U relationship with SC. The Suomi NPP-VIIRS data are more suitable for revealing SC, TC, and IC in medium-sized and large-sized cities than in small-sized cities and megacities.
1. Introduction
Under the background of human society entering the digital era, it is one of the important goals of human sustainable development to quickly and effectively identify and evaluate the environmental impact of human activities (He et al. Citation2014; Huang et al. Citation2019). During this process, carbon dioxide (CO2) emissions produced by anthropogenic activities have been gradually treated as one of the culprits of climate change (Sarmiento et al. Citation1998). To mitigate the negative impacts of climate warming, an important task is to establish and identify emission inventories in order to monitor CO2 emissions. It is well known that CO2 emissions mainly come from human industrial activities, transportation, and service industries (Guan et al. Citation2018; Nocera, Ruiz-Alarcón-Quintero, and Cavallaro Citation2018; Rahman and Kashem Citation2017). For example, secondary industry CO2 emissions (IC) make up a large proportion of total CO2 emissions in China, corresponding to 78.55% (Shan et al. Citation2018). Ou et al. (Citation2016) have also reported that traffic CO2 emissions (TC) account for 23% of CO2 emissions in the world. Thus, a necessary condition for developing and implementing CO2 mitigation policies in accordance with local conditions is to identify CO2 emissions from different industries (Chen et al. Citation2020). Traditionally, CO2 emissions from different industries have mainly been obtained from statistical data (Liu et al. Citation2015). However, a lack of spatial information has limited their further application.
To further identify and evaluate spatiotemporal changes in global carbon cycles, some studies have provided gridded CO2 emission measures based on traffic networks, population density, and specific point sources (Cai and Zhang Citation2014; Sharma et al. Citation2019; Yang et al. Citation2020). In addition, satellite nighttime light data have also been identified as unique data sources for building CO2 emission maps due to their capacity to detecting low lights from urban areas (Shi et al. Citation2014a, Citation2014b), settlements (Letu et al. Citation2015), factories (Zhao, Samson, and Currit Citation2015), and even streetlights (Cheng et al. Citation2020), which are closely linked to population density and wealth (Elvidge et al. Citation1997; Li et al. Citation2020). For example, Doll, Muller, and Elvidge (Citation2000) suggested that nighttime light data can be seen as an ideal proxy for global greenhouse gas emissions. Gaughan et al. (Citation2019) mapped anthropogenic CO2 emissions in Vietnam, Cambodia, and Laos from nighttime light data. Shi et al. (Citation2016) developed a nighttime light-panel data model for estimating spatiotemporal CO2 emissions in China on a gridded scale.
Although previous studies have had varying degrees of success in estimating CO2 emissions from nighttime light data, there are still several outstanding issues. First, most studies have focused on estimating total CO2 emissions using nighttime light data but have ignored the relationships between nighttime lights and CO2 emissions from different industries, such as CO2 emissions from the service industry, transportation, industrial activities. Even with similar total nighttime lights, different cities would produce different CO2 emissions due to their different social and economic structures (Letu, Nakajima, and Nishio Citation2014; Xie and Weng Citation2015). As shown in , although Nanjing, Chongqing, and Shenzhen have similar total nighttime lights, the service industry CO2 emissions (SC), TC, IC, and total CO2 emissions (TO) within these cities obviously differ. A similar pattern also appears in Jining, Taizhou, and Baoding. Thus, to effectively quantify CO2 emissions from different industries, it is important to identify the nighttime light-CO2 emission relationships from different industries. Second, what factors govern the nighttime light-CO2 emission relationships from different industries? Many studies have proven that the accuracy of nighttime lights for CO2 emission estimation is related to the economy, population, natural environment, etc (Liu et al. Citation2018; Shi et al. Citation2018, Citation2019). If we do not consider these factors, the accuracy of the results will be greatly affected. For example, many factories emit a lot of CO2 during the day but stop production and turn off their lights at night (Zhao, Samson, and Currit Citation2015). Thus, the industrial structure, population, and other factors should be considered when estimating industrial CO2 emissions with nighttime light data. Additionally, road networks and other factors should be taken into account when estimating TC by nighttime light data because some rural roads often have no lights at night (Ou et al. Citation2016). Third, what are the differences of relationships between nighttime lights and CO2 emissions from different industries within different city sizes? Considering cities of different sizes, it is still unknown whether there will be differences in the nighttime light estimation of CO2 emissions after controlling for a series of factors (Shi et al. Citation2018). Finally, remotely sensed nighttime lights from Suomi National Polar-orbiting Partnership Satellite-Visible Infrared Imaging Radiometer Suite (Suomi NPP-VIIRS) have become a new, important data source for estimating CO2 emissions from different industries. Comparing with the traditional Defense Meteorological Satellite Program-Operational Line-scan System (DMSP-OLS) data, the Suomi NPP-VIIRS data have a higher radiation and spatial resolution without pixel saturation (Levin et al. Citation2020). Additionally, the Suomi NPP-VIIRS data can be updated in real time, but the ending of updates has become a limitation for further application of the DMSP-OLS data. Since many studies have indicated that the Suomi NPP-VIIRS data perform better in socioeconomic factor estimation than that of the DMSP-OLS data (Shi et al. Citation2014a, Citation2014b), quantifying and evaluating the capacity of the Suomi NPP-VIIRS data for identifying CO2 emissions from different industries is an important topic.
Table 1. Statistics on service industry CO2 emissions, traffic CO2 emissions, secondary industry CO2 emissions, total CO2 emissions, and nighttime lights in Chinese cities.
For the above-mentioned deficiencies, our study aimed to identify and quantify the Suomi NPP-VIIRS data-CO2 emission relationship from different industries. We also considered the potential impact factors governing the nighttime light-CO2 emission relationships. Moreover, a heterogeneity analysis was conducted based on different city sizes. To achieve these objectives, we selected China as our experimental subject, as it is experiencing rapid CO2 emissions and is specifically facing pressure to reduce CO2 emissions. Additionally, the imbalance in the CO2 emission distribution and the difference in luminous intensity further prove that China is an ideal research subject. In summary, the main contributions of our study are as follows:
For the first time, this study has systematically identified and evaluated the nighttime light-CO2 emission relationships from different industries.
The factors that govern the nighttime light-CO2 emission relationships were examined and quantified in this study.
The heterogeneity of the nighttime light-CO2 emission relationship was also validated and analyzed in this study.
This study will provide a theoretical basis for modeling consistent high-resolution CO2 emissions from different industries regionally and globally based on remotely sensed nighttime light data.
2. Materials and methods
2.1. Study area
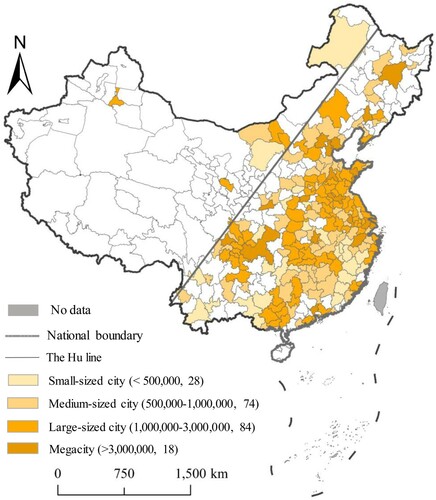
China’s 204 cities were selected as the study area, which are mainly distributed in the region to the east of the Hu line (Chen et al. Citation2016) (), where the population is concentrated and the development of the regional economy and urbanization are relatively advanced. Because the Hu line can be regarded as the dividing line between different levels of CO2 emissions and socioeconomic development in China, the selection of these sample cities can effectively reveal the nighttime light-CO2 emission relationships from different industries. Moreover, due to the imbalance in urban development in China, these cities were divided into four categories based on their end-of-2012 populations. The specific criteria are as follows: small-sized city, medium-sized city, large-sized city, megacity (Song, Wang, and Qi Citation2015).
Figure 1. The spatial distribution of the study area.
Note: the numbers in brackets represent the population and the number of cities, respectively.
2.2. Materials
Five data sources from 2012 and 2015 were used in this study, including the monthly Suomi NPP-VIIRS data, the Chinese city CO2 emissions dataset, socioeconomic data, NDVI data, and administrative division data.
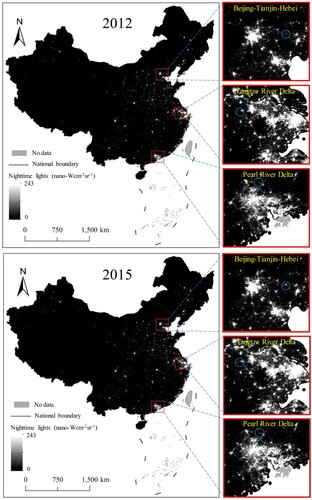
The monthly Suomi NPP-VIIRS data were obtained from the National Oceanic and Atmospheric Administration’s National Geophysical Data Center (NOAA/NGDC). The original data were given in a spatial resolution of 0.004167°, with a wavelength range of 0.5-0.9 μm. Since the Suomi NPP-VIIRS data did not remove background noise, it was necessary to synthesize and denoise the monthly data to obtain annual night light data that effectively reflect real human CO2 emissions (). Thus, we first calculated the annual average from the monthly data. Then, the DMSP-OLS data were then selected as a mask to remove overflow lights and negative values. Finally, the eight-neighborhood threshold method was further used to remove outlier values. The specific steps can be found in Wu et al. (Citation2020).
Figure 2. The corrected Suomi NPP-VIIRS data from 2012 and 2015.
Note: Enlarged views on the right are pictures for the Beijing-Tianjin-Hebei, the Yangtze River Delta, and the Pearl River Delta. By comparing the blue areas, the luminous intensity in 2015 was found to be higher than that in 2012 in some regions.
China’s city CO2 emissions, including SC, TC, and IC, were obtained from Chinese city CO2 emissions datasets. The data collected were from greenhouse gas emissions from enterprises, industries, departments, and China’s high-resolution spatial emission grid data (Cai et al. Citation2017; China urban greenhouse gas working group Citation2019).
The socioeconomic data, including the population (A), built-up urban areas (G), the proportion of college students in the total population (H), electricity consumption (J), the proportion of the tertiary industry in total industry (Q), the road network density (D), and the proportion of the secondary industry in total industry (L), were obtained from the Statistical Database of Economic and Social Development by the National Knowledge Infrastructure of China.
The normalized difference vegetation index (NDVI) data derived from the Moderate Resolution Imaging Spectroradiometer (MODIS) were obtained from the website of the Data Centre for Resources and Environmental Sciences, Chinese Academy of Sciences (RESDC). The national and city boundaries were collected from the National Geographic Information Center. It is noted that to ensure data uniformity, all spatial data were projected to WGS-84 Albers.
2.3. Theoretical and benchmark regression model
Previous studies have proven that nighttime lights can reveal human socioeconomic parameters according to the following formula:
(1)
(1)
where S represents the human socioeconomic parameters, such as population, electricity consumption, and gross domestic product (GDP), NT is the nighttime light, β is the coefficient, and α represents other variables that could mediate the socioeconomic parameters.
Similarly, we also assumed that nighttime lights are correlated with CO2 emissions from different industries. Referring to formula 1, we constructed the following model for these relationships:
(2)
(2)
where C represents different types of CO2 emissions, including SC, TC, and IC. i and t represent the sample city and year (2012 and 2015), respectively. TNT is total nighttime lights. α1 is used to measure the nighttime light-CO2 emission relationship from different industries and is the core parameter of this study. Additionally, we controlled for urban characteristic variables (U), including A, G, J, and H, which are correlated with CO2 emissions (Chen et al. Citation2018; Wang et al. Citation2019). FE represents fixed effects that were used to alleviate errors due to missing variables. ε represents the error term.
To further validate the factors mediating the nighttime light-CO2 emission relationships, some socioeconomic factors, including Q, L, and D, were added to formula 3 below. Previous studies have indicated that economic structures have close relationships with SC and IC (Lauvaux et al. Citation2020; Liu et al. Citation2015). The development of transportation also promotes CO2 emissions (Liu and Feng Citation2020). Thus, whether these factors affect the nighttime light-CO2 emission relationships needs to be further verified.
(3)
(3)
where I represent specific socioeconomic variables, including Q, L, and D. To further alleviate the endogeneity problem in the model, the NDVI (M) was selected as an instrumental variable. As shown in Figure S1, we found that nighttime lights have a negative relationship with the NDVI. It has been proven that the NDVI does not directly affect CO2 emissions, satisfying the assumptions for its use an instrumental variable (Shi et al. Citation2018; Zhang, Schaaf, and Seto Citation2013). Moreover, is there a linear or nonlinear nighttime light-CO2 emission relationship? In other words, is it the case that the brighter the lights are at night, the higher the CO2 emissions are, or is the relationship something else? Thus, (TNT)2 was added to formula 3 to check for these nonlinear relationships. It is noted that to avoid heteroskedasticity and instability, all variables were transformed by taking the natural logarithm.
Finally, city size not only affects CO2 emissions but also further affects nighttime lights. Thus, the nighttime light-CO2 emission relationships were also evaluated within cities of different sizes to assess spatial heterogeneity.
3. Results and discussion
3.1. The nighttime light-CO2 emission relationship from different industries
reports the benchmark regression results for the Suomi NPP-VIIRS-SC relationships. In column (1), without considering other factors, the core explanatory variable, TNT, has a significantly positive correlation with SC with a low adjusted-R2 value (0.227), indicating that nighttime lights can only account for 22.7% of SC changes. Although the nighttime lights reflect SC to some extent, it is impossible to estimate this relationship comprehensively without considering other factors. When controlling for a series of city characteristic variables and city fixed effects in column (2), there is still a significantly positive TNT-SC correlation, with a high adjusted-R2 value (0.834). In general, the models show that there is a positive correlation between TNT and SC. However, one question is whether brighter TNT indicates more SC or whether, after nighttime lights reach a certain level, SC begins to decrease? In column (3), (TNT)2 was added to the regression model, and we found that the coefficients on TNT and (TNT)2 are 10.245 and −0.482, respectively, with significance at the level of 1%, indicating that there is an Inverted ‘U’ TNT-SC relationship. This means that the Suomi NPP-VIIRS data can reveal the development of the service industry in the upper half of the parabola. The brighter the nighttime lights are, the higher the SC is. In the lower half of the parabola, the areas with bright nighttime lights are often located in the city center or in high-tech industrial zones, which emit a low level of CO2 (Tian et al. Citation2019). Considering the nonlinear relationship between TNT and SC, more complex piecewise functions should be used for estimation.
Table 2. Correlations between nighttime lights and service industry CO2 emissions for all selected cities.
NDVI, A, G, H, and J were also added to the regression model as controls for the TNT-SC relationship. Although their coefficients (except for NDVI) are not significant, these factors greatly improve the model’s degree of fit, with adjusted-R2 values from 0.227–0.834 and 0.840. Additionally, Q, representing the development of the tertiary industry, was also added in column (4). The relationship between Q and SC is negative with a coefficient of −0.442, implying that the development of the tertiary industry should reduce CO2 emissions. This further proves that when Q is controlled for, the Suomi NPP-VIIRS data can more effectively reveal SC.
The relationships between TNT and TC are shown in . In column (1), we found that nighttime lights can reveal TC more effectively than SC. The model is well fitted with a relatively high adjusted-R2 value of 0.512, indicating that 51.2% of TC changes can be revealed by nighttime lights. The reason may be that the Suomi NPP-VIIRS data can directly detect lights from roads at night (Shi et al. Citation2015), which are closely related to CO2 emissions. Additionally, we should consider the fact that some roads in rural areas have vehicles traveling during the daytime, which consequently emit CO2, but instantaneous lights derived from just a few vehicles were too weak to be detected at night (Zhao, Samson, and Currit Citation2015). Thus, some city characteristic variables, including NDVI, A, G, H, and J, were added to column (2). The results show that the TNT coefficient (0.544) is still significant, with an adjusted-R2 value of 0.900, suggesting that some socioeconomic factors should be considered when using the Suomi NPP-VIIRS data to reveal TC. To test the nonlinear relationships between nighttime lights and TC, (TNT)2 was added to column (3), and the coefficients on both TNT and (TNT)2 did not pass the significance test. presents the scatter plot of TNT and TC and shows that the best-fit curve for the two variables indicates a linear relationship. In addition, although we recognized that the development of electric vehicles could lead to a decline in the accuracy of TC estimates from the Suomi NPP-VIIRS data, fuel vehicles are the main sources of TC and have not changed in the short term.
Figure 3. The relationship between nighttime lights and TC, IC.
Noted: TNT, IC TC represent total nighttime lights, secondary industry CO2 emissions, and traffic CO2 emissions, respectively. Note: logarithmic transformation can be more intuitive to find the data relationship, and convenient for statistical inference.
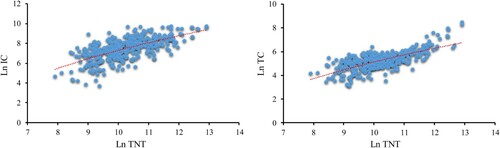
Table 3. Correlations between nighttime lights and traffic CO2 emissions for all selected cities.
From , we found that with gradually controlling for city characteristic variables, the degree of fit of the model is further improved. In addition to NDVI, A, G, H, and J, we further added D into the model. From column (4), D has a significantly positive effect on TC, and the degree of fit of the model was greatly improved, with an adjusted-R2 value of 0.906.
presents the regression results for the relationships between TNT and IC. In column (1), we found that the adjusted-R2 value of the TNT-IC relationship is 0.417, indicating that the Suomi NPP-VIIRS data can reveal 41.7% of IC changes without considering other factors. However, Zhao, Samson, and Currit (Citation2015) indicated that some small factories operate during the day but stop at night. The IC derived from these factories would not be detected through nighttime lights. Thus, some city characteristic variables have been added to the model to control for nonlight-related IC. In column (2), the degree of fit of the model increased significantly, with adjusted-R2 values jumping from 0.417–0.912. In addition, (TNT)2 was added to the model to test for nonlinear correlations between nighttime lights and IC. The coefficients on both TNT and (TNT)2 did not pass the significance test, which proved that there is no nonlinear TNT-IC relationship. We further plotted the TNT-IC data () and found an obvious linear relationship between TNT and IC, which supports the above analysis results.
Table 4. Correlations between nighttime lights and secondary industry CO2 emissions for all selected cities.
Additionally, as shown in column (4) of , the coefficient on J for the TNT-IC relationships is significantly positive. This indicates that with stable nighttime lights, IC gradually increases when J grows. In contrast, if TNT is unchanged, cities with higher G tend to emit less IC. Many studies have found that industrial structure (Rahman and Kashem Citation2017; Tian et al. Citation2019), especially the development of heavy industry, affects the IC of cities. Thus, L has been added to the model. The regression coefficient is not significant, which implies that the IC estimated by nighttime lights is not affected by industrial development. One possible explanation is that nighttime lights can detect most factory activities, and areas without lights can only be controlled for energy consumption, population density, etc.
3.2. Heterogeneity analysis
Through the above analysis, we found that the nighttime light-CO2 emission relationships were complex and diverse. For cities of different sizes, even if they have similar nighttime lights, their CO2 emissions might follow different trends. Thus, a heterogeneity analysis has been attempted to be carried out to further identify these relationships.
As shown in Tables S1-S4, without considering other factors, the Suomi NPP-VIIRS data were positively correlated with SC for cities of all sizes. The range of adjusted-R2 values is between 0.092 and 0.109, indicating that approximately 10% of the SC variations are revealed by the Suomi NPP-VIIRS data within different sized cities. For small-sized cities, we found that although controlling for some city characteristic variables increased the adjusted-R2 values to a certain extent, the coefficient on TNT did not pass the significance test. This implies that nighttime light data does not effectively capture SC in small cities. This is attributed to the undeveloped tertiary industry in small-sized cities, and SC could not be fully reflected by nighttime lights. For medium-sized and large cities, when considering other city characteristic variables, TNT still has a positive and significant effect on SC, and the adjusted-R2 values were higher than 0.8. It is noted that the TNT regression coefficient for medium-sized cities was higher than that for large-sized cities, indicating that the Suomi NPP-VIIRS data can more effectively reveal SC in medium-sized cities. For megacities, the regression coefficient on TNT was not significant, indicating that the Suomi NPP-VIIRS data cannot effectively reflect SC. This might be because nighttime lights in megacities are mainly derived from residential areas, commercial centers, and transportation hubs, while the nighttime lights emitted by the tertiary industry are weak. Through this comparison, we concluded that the Suomi NPP-VIIRS data are more effective in identifying and quantifying SC in medium-sized and large cities.
Tables S5-S8 present the results of the relationship between nighttime lights and TC within cities of different sizes. Without considering other factors, the TNT coefficients for cities of all sizes were positive and significant. By comparing the adjusted-R2 values, we found that the Suomi NPP-VIIRS data explained the most TC in large cities (46.6%), followed by megacities (37.8%), medium-sized cities (30.8%), and small cities (23.0%). In the case where we control for some city characteristic variables, the TNT coefficients for medium-sized and large cities were still positive and significant. In contrast, the coefficients for small cities and megacities did not pass the significance test. The following two reasons may explain this result. 1) The roads in small cities are underdeveloped, and some roads have no lights at night, so that nighttime lights cannot reflect the real TC. 2) Due to the interference of many non-road lights, the lights in megacities cannot fully reflect the real TC. Thus, we concluded that the Suomi NPP-VIIRS data can more effectively reveal TC in medium-sized and large cities.
In Tables S9-S12, the Suomi NPP-VIIRS data only directly reflect a part of the IC within cities of all sizes. After controlling for other factors, although the adjusted-R2 values were significantly improved, the TNT coefficients for small cities, large cities, and megacities did not pass the significance test. The reasons may be as follows. 1) Due to the inadequate development of industry and the interference of nonindustrial lights in small cities, and large cities, megacities, respectively, the nighttime lights can neither fully nor effectively identify IC. 2) Due to the relative completeness of industrial development and less interference from nonindustrial lights, IC can be quickly and effectively reflected by the Suomi NPP-VIIRS data when controlling for other factors.
In summary, the Suomi NPP-VIIRS data are more suitable for revealing SC, TC, and IC in medium-sized and large cities (except for IC in large cities), while the estimations for small cities and megacities were not significantly affected by controlling for more factors.
3.3. Robustness test
Our results show that there are significantly different relationships between the Suomi NPP-VIIRS data and SC, TC, and IC. Without considering other factors, nighttime lights are the most effective at revealing TC, followed by IC and then SC. To better reveal CO2 emissions, it is necessary to control for city characteristic variables to improve the accuracy of the model. Moreover, through the heterogeneity analysis, differentiated nighttime light-CO2 emission relationships from different industries were found within cities of different sizes. Next, three steps are used to test the robustness of the results.
First, certain large cities were deleted from the sample cities, including Beijing, Shanghai, Chongqing, Chengdu, Suzhou, Guangzhou, Tianjin, Tangshan, and Ha’erbin, because their lights were very bright compared to those of other cities. The robustness test results are listed in Tables S13-S15. We found that TNT is significantly positively correlated with SC, TC, and IC. When city characteristic variables were included, the model’s degree of fit was significantly improved.
Second, to further control for endogeneity and enhance the robustness of the results, TNT with one lag period were used as an instrumental variable in the estimation. The results also proved the plausibility of the above results.
At last, our analysis results are broadly similar to the previous studies. Zhao, Samson, and Currit (Citation2015) suggested that nighttime lights not only reveal the region’s population but also its affluence. Thus, nighttime light data can more effectively estimate CO2 emissions than GDP or population data. Additionally, Xie and Weng (Citation2015) found that some city characteristic variables, including socioeconomic and natural environmental factors, can improve energy consumption and CO2 emission estimation from nighttime light data.
3.4. Discussion and implications
Our study has evaluated the possibility of the Suomi NPP-VIIRS data for revealing CO2 emissions from different industries, along with the factors mediating that ability, which provides an important basis for generating high-resolution CO2 emissions datasets. It is of great significance to promote more in-depth research on urban energy conservation, emission reduction, and resource management and to support policy discussions on resource and environmental sustainability. The values and uncertainties for the study are summarized as follows.
The results of the study provide the possibility for the further use of the Suomi NPP-VIIRS data to evaluate CO2 emissions from different industries at a fine spatial scale. Combined with a variety of urban socioeconomic indicators, the further generation of CO2 emission datasets can also be used as a useful input to multi-scale carbon cycle model, providing a quantitative basis for setting carbon-neutral targets throughout the world, especially for developing countries.
Cities are at the core of global sustainable development challenges (Yu et al. Citation2018), and CO2 emissions, as an important indicator, are widely used in the assessment of sustainable urban living, production, and environmental protection. However, due to a lack of spatial information, traditional statistical CO2 emission data are restricted in their applications on a fine spatial scale. This study revealed the use of nighttime light data to evaluate CO2 emissions from different industries, providing a theoretical basis for fine-scale CO2 emission estimation. Also, estimating CO2 emissions from nighttime lights will provide a possibility for cities to formulate and use additional sustainability indicators, supplementing some available regional sustainability indicators and their related policies.
CO2 emission estimation is affected by scale effects. For grid estimation, more refined CO2 emission data should be used for verification, but obviously, such data are still lacking (Zhao, Samson, and Currit Citation2015). Since the regression model here was used to identify the nighttime light-CO2 emission relationship from different industries, such functions could be used to directly map more refined CO2 emissions. Zhao, Samson, and Currit (Citation2015) indicated that although the linear regression would produce relatively large errors, it was still valuable, especially in multiyear, large-scale, and high-resolution CO2 emission estimation when considering the on-the-ground situations where many developing countries or regions do not have high-quality statistical systems or sufficiently detailed data on socioeconomic and environmental conditions.
Three representative types of CO2 emissions, including SC, TC, and IC, were selected for the correlation analysis in this study. Whether more types of CO2 emissions, such as residential CO2 emissions, agricultural CO2 emissions, and industrial process CO2 emissions, can be revealed by nighttime light data still needs further analysis. For example, Wu et al. (Citation2020) proved that agricultural production was closely related to nighttime lights, which provides a theoretical basis for us to reveal agricultural CO2 emissions by using nighttime light data.
Only the Suomi NPP-VIIRS data from 2012 and 2015 were selected for the experimental analysis. Longer time series should be used to further identify the nighttime light-CO2 emission relationship from different industries. However, the analysis needs to address a series of problems, including the integration of different nighttime light data and the denoising of the Suomi NPP-VIIRS data. Although some studies have proven that the un-calibrated nighttime light data does not significantly affect the analysis of socioeconomic indicators (Wu et al. Citation2020), whether this is true for CO2 emission estimation requires further discussion.
It is noted that electricity is generated from power plants which typically are far away from major cities. The location of nighttime lights observed from satellites is not likely the place where major sources of CO2 emissions are located. As a results, it is difficult to make the argument that more lights means more CO2 emission at a given location. Thus, it is necessary to add the power plant location as a control variable in the future, so as to more effectively reveal the nighttime light-CO2 emission relationships.
4. Conclusions
This study has systematically evaluated the ability of the Suomi NPP-VIIRS data for revealing service industry CO2 emissions (SC), traffic CO2 emissions (TC), and secondary industry CO2 emissions (IC) in China. The potential impact factors governing the Suomi NPP-VIIRS-CO2 emission relationships were also considered from different perspectives. Results suggested that there were positive correlations between the Suomi NPP-VIIRS data and SC, IC, and TC. Specifically, without considering other factors, nighttime lights can only reveal 22.7% (SC), 51.2% (TC), and 41.7% (IC) of changes, respectively. When controlling for a series of city characteristic variables and city fixed effects, there are still significantly positive TNT- CO2 emission correlations, with high adjusted-R2 values for SC (0.834), TC (0.900), and IC (0.912). In addition, it also indicated that nighttime lights have an Inverted-U relationship with SC. The Suomi NPP-VIIRS data are more suitable for revealing SC, TC, and IC in medium-sized and large-sized cities than in small-sized cities and megacities. The study will provide the possibility for the further use of the Suomi NPP-VIIRS data to evaluate CO2 emissions from different industries at a fine spatial scale. It is of great significance to promote more in-depth research on urban energy conservation, emission reduction, and resource management and to support policy discussions on resource and environmental sustainability.
Supplementary_Material
Download MS Word (97.5 KB)Data availability statement
The monthly Suomi NPP-VIIRS data are openly available in Earth Observation Group at https://payneinstitute.mines.edu/eog/. China’s city CO2 emissions were collected from China City Greenhouse Gases Emissions Datasets.
Disclosure statement
No potential conflict of interest was reported by the author(s).
Additional information
Funding
References
- Cai, B., C. Yang, J. Lu, and L. Cao. 2017. “China City CO2 Emissions Dataset (2012).” China Environment Press, Beijing, China. (in Chinese).
- Cai, B., and L. Zhang. 2014. “Urban CO2 Emissions in China: Spatial Boundary and Performance Comparison.” Energy Policy 66: 557–567.
- Chen, S., D. Chen, S. O. Economics, and F. University. 2018. “Air Pollution, Government Regulations and High-Quality Economic Development.” Economic Research Journal 2: 20–34. (in Chinese).
- Chen, M., Y. Gong, Y. Li, D. Lu, and H. Zhang. 2016. “Population Distribution and Urbanization on Both Sides of the Hu Huanyong Line: Answering the Premier's Question.” Journal of Geographical Sciences 26 (11): 1593–1610. (in Chinese).
- Chen, X., C. Shuai, Y. Wu, and Y. Zhang. 2020. “Analysis on the Carbon Emission Peaks of China's Industrial, Building, Transport, and Agricultural Sectors.” Science of The Total Environment 709: 135768.
- Cheng, B., Z. Chen, B. Yu, Q. Li, C. Wang, B. Li, B. Wu, Y. Li, and J. Wu. 2020. “Automated Extraction of Street Lights from JL1-3B Nighttime Light Data and Assessment of Their Solar Energy Potential.” IEEE Journal of Selected Topics in Applied Earth Observations Remote Sensing 13: 675–684.
- China urban greenhouse gas working group. 2019. “China city Greenhouse Gases Emissions Dataset (2015).” China Environment Press, Beijing, China. (in Chinese).
- Doll, C. H., J.-P. Muller, and C. D. Elvidge. 2000. “Night-time Imagery as a Tool for Global Mapping of Socioeconomic Parameters and Greenhouse gas Emissions.” AMBIO: a Journal of the Human Environment 29 (3): 157–162.
- Elvidge, C. D., K. E. Baugh, E. A. Kihn, H. W. Kroehl, E. R. Davis, and C. W. Davis. 1997. “Relation Between Satellite Observed Visible-Near Infrared Emissions, Population, Economic Activity and Electric Power Consumption.” International Journal of Remote Sensing 18 (6): 1373–1379.
- Gaughan, A. E., T. Oda, A. Sorichetta, F. R. Stevens, and S. V. Nghiem. 2019. “Evaluating Nighttime Lights and Population Distribution as Proxies for Mapping Anthropogenic CO2 Emission in Vietnam, Cambodia and Laos.” Environmental Research Communications 1 (9): 091006.
- Guan, D., J. Meng, D. M. Reiner, N. Zhang, Y. Shan, Z. Mi, S. Shao, Z. Liu, Q. Zhang, and S. J. Davis. 2018. “Structural Decline in China’s CO2 Emissions Through Transitions in Industry and Energy Systems.” Nature Geoscience 11 (8): 551–555.
- He, C., Q. Ma, Z. Liu, and Q. Zhang. 2014. “Modeling the Spatiotemporal Dynamics of Electric Power Consumption in Mainland China Using Saturation Corrected DMSP/OLS Nighttime Stable Light Data.” International Journal of Digital Earth 12 (7): 993–1014.
- Huang, X., J. Xia, R. Xiao, and T. He. 2019. “Urban Expansion Patterns of 291 Chinese Cities, 1990–2015.” International Journal of Digital Earth 12 (1): 62–77.
- Lauvaux, T., K. R. Gurney, N. L. Miles, K. J. Davis, S. J. Richardson, A. Deng, B. J. Nathan, T. Oda, J. A. Wang, and L. Hutyra. 2020. “Policy-relevant Assessment of Urban CO2 Emissions.” Environmental & Science Technology 54 (16): 10237–10245.
- Letu, H., M. Hara, G. Tana, Y. Bao, and F. Nishio. 2015. “Generating the Nighttime Light of the Human Settlements by Identifying Periodic Components from DMSP/OLS Satellite Imagery.” Environmental Science & Technology 49 (17): 10503–10509.
- Letu, H., T. Y. Nakajima, and F. Nishio. 2014. “Regional-scale Estimation of Electric Power and Power Plant CO2 Emissions Using Defense Meteorological Satellite Program Operational Linescan System Nighttime Satellite Data.” Environmental Science & Technology Letters 1 (5): 259–265.
- Levin, N., C. C. Kyba, Q. Zhang, A. S. de Miguel, M. O. Román, X. Li, B. A. Portnov, A. L. Molthan, A. Jechow, and S. D. Miller. 2020. “Remote Sensing of Night Lights: A Review and an Outlook for the Future.” Remote Sensing of Environment 237: 111443.
- Li, X., N. Levin, J. Xie, and D. Li. 2020. “Monitoring Hourly Night-Time Light by an Unmanned Aerial Vehicle and its Implications to Satellite Remote Sensing.” Remote Sensing of Environment 247: 111942.
- Liu, Y., and C. Feng. 2020. “Decouple Transport CO2 Emissions from China’s Economic Expansion: A Temporal-Spatial Analysis.” Transportation Research Part D: Transport Environment 79: 102225.
- Liu, Z., D. Guan, W. Wei, S. J. Davis, P. Ciais, J. Bai, S. Peng, Q. Zhang, K. Hubacek, and G. Marland. 2015. “Reduced Carbon Emission Estimates from Fossil Fuel Combustion and Cement Production in China.” Nature 524 (7565): 335–338.
- Liu, X., J. Ou, S. Wang, X. Li, Y. Yan, and L. Jiao. 2018. “Estimating Spatiotemporal Variations of City-Level Energy-Related CO2 Emissions: An Improved Disaggregating Model Based on Vegetation Adjusted Nighttime Light Data.” Journal of Cleaner Production 177: 101–114.
- Nocera, S., C. Ruiz-Alarcón-Quintero, and F. Cavallaro. 2018. “Assessing Carbon Emissions from Road Transport Through Traffic Flow Estimators.” Transportation Research Part C: Emerging Technologies 95: 125–148.
- Ou, J., X. Liu, X. Li, and X. Shi. 2016. “Mapping Global Fossil Fuel Combustion CO2 Emissions at High Resolution by Integrating Nightlight, Population Density, and Traffic Network Data.” IEEE Journal of Selected Topics in Applied Earth Observations & Remote Sensing 9 (4): 1674–1684.
- Rahman, M. M., and M. A. Kashem. 2017. “Carbon Emissions, Energy Consumption and Industrial Growth in Bangladesh: Empirical Evidence from ARDL Cointegration and Granger Causality Analysis.” Energy Policy 110: 600–608.
- Sarmiento, J. L., T. M. Hughes, R. J. Stouffer, and S. Manabe. 1998. “Simulated Response of the Ocean Carbon Cycle to Anthropogenic Climate Warming.” Nature 393 (6682): 245–249.
- Shan, Y., D. Guan, H. Zheng, J. Ou, Y. Li, J. Meng, Z. Mi, Z. Liu, and Q. Zhang. 2018. “China CO2 Emission Accounts 1997–2015.” Scientific Data 5: 170201.
- Sharma, G., B. Sinha, Pallavi, H. Hakkim, B. P. Chandra, A. Kumar, and V. Sinha. 2019. “Gridded Emissions of CO, NOx, SO2, CO2, NH3, HCl, CH4, PM2.5, PM10, BC, and NMVOC from Open Municipal Waste Burning in India.” Environmental Science &Technology 53 (9): 4765–4774.
- Shi, K., Y. Chen, L. Li, and C. Huang. 2018. “Spatiotemporal Variations of Urban CO2 Emissions in China: A Multiscale Perspective.” Applied Energy 211: 218–229.
- Shi, K., Y. Chen, B. Yu, T. Xu, Z. Chen, R. Liu, L. Li, and J. Wu. 2016. “Modeling Spatiotemporal CO2 (Carbon Dioxide) Emission Dynamics in China from DMSP-OLS Nighttime Stable Light Data Using Panel Data Analysis.” Applied Energy 168: 523–533.
- Shi, K., C. Huang, B. Yu, B. Yin, Y. Huang, and J. Wu. 2014a. “Evaluation of SUOMI NPP-VIIRS Night-Time Light Composite Data for Extracting Built-up Urban Areas.” Remote Sensing Letters 5 (4): 358–366.
- Shi, K., B. Yu, Y. Hu, C. Huang, Y. Chen, Y. Huang, Z. Chen, and J. Wu. 2015. “Modeling and Mapping Total Freight Traffic in China Using SUOMI NPP-VIIRS Nighttime Light Composite Data.” Giscience & Remote Sensing 52 (3): 274–289.
- Shi, K., B. Yu, Y. Huang, Y. Hu, B. Yin, Z. Chen, L. Chen, and J. Wu. 2014b. “Evaluating the Ability of SUOMI NPP-VIIRS Nighttime Light Data to Estimate the Gross Domestic Product and the Electric Power Consumption of China at Multiple Scales: A Comparison with DMSP-OLS Data.” Remote Sensing 6 (2): 1705–1724.
- Shi, K., B. Yu, Y. Zhou, Y. Chen, C. Yang, Z. Chen, and J. Wu. 2019. “Spatiotemporal Variations of CO2 Emissions and Their Impact Factors in China: A Comparative Analysis Between the Provincial and Prefectural Levels.” Applied Energy 233-234: 170–181.
- Song, Q., Y. Wang, and Y. Qi. 2015. “Study on Present Status of Carbon Emissions in China’s Lowcarbon Pilot Cities.” China Popul. Resour. Environ 25 (1): 78–82. (in Chinese)
- Tian, X., F. Bai, J. Jia, Y. Liu, and F. Shi. 2019. “Realizing low-Carbon Development in a Developing and Industrializing Region: Impacts of Industrial Structure Change on CO2 Emissions in Southwest China.” Journal of Environmental Management 233: 728–738.
- Wang, H., X. Lu, Y. Deng, Y. Sun, C. P. Nielsen, Y. Liu, G. Zhu, M. Bu, J. Bi, and M. B. McElroy. 2019. “China’s CO2 Peak Before 2030 Implied from Characteristics and Growth of Cities.” Nature Sustainability 2 (8): 748–754.
- Wu, Y., M. Jiang, Z. Chang, Y. Li, and K. Shi. 2020. “Does China's Urban Development Satisfy Zipf's Law? A Multiscale Perspective from the SUOMI NPP-VIIRS Nighttime Light Data.” International Journal of Environmental Research and Public Health 17 (4): 1460.
- Xie, Y., and Q. Weng. 2015. “World Energy Consumption Pattern as Revealed by DMSP-OLS Nighttime Light Imagery.” Giscience & Remote Sensing 53 (2): 265–282.
- Yang, Y., S. Qu, B. Cai, S. Liang, Z. Wang, J. Wang, and M. Xu. 2020. “Mapping Global Carbon Footprint in China.” Nature Communications 11 (1): 2237.
- Yu, B., S. Deng, G. Liu, C. Yang, Z. Chen, C. J. Hill, and J. Wu. 2018. “Nighttime Light Images Reveal Spatial-Temporal Dynamics of Global Anthropogenic Resources Accumulation Above Ground.” Environmental Science & Technology 52 (20): 11520–11527.
- Zhang, Q., C. Schaaf, and K. C. Seto. 2013. “The Vegetation Adjusted NTL Urban Index: A new Approach to Reduce Saturation and Increase Variation in Nighttime Luminosity.” Remote Sensing of Environment 129: 32–41.
- Zhao, N., E. L. Samson, and N. A. Currit. 2015. “Nighttime-lights-derived Fossil Fuel Carbon Dioxide Emission Maps and Their Limitations.” Photogrammetric Engineering & Remote Sensing 81 (12): 935–943.