
 ?Mathematical formulae have been encoded as MathML and are displayed in this HTML version using MathJax in order to improve their display. Uncheck the box to turn MathJax off. This feature requires Javascript. Click on a formula to zoom.
ABSTRACT
Gridded model assessments require at least one climatic and one soil database for carrying out the simulations. There are several parallel soil and climate database development projects that provide sufficient, albeit considerably different, observation based input data for crop model based impact studies. The input database related uncertainty of the Biome-BGCMuSo agro-environmental model outputs was investigated using three and four different gridded climatic and soil databases, respectively covering an area of nearly 100.000 km2 with 1104 grid cells. Spatial, temporal, climate and soil database selection related variances were calculated and compared for four model outputs obtained from 30-year-long simulations. The choice of the input database introduced model output variability that was comparable to the variability the year-to-year change of the weather or the spatial heterogeneity of the soil causes. Input database selection could be a decisive factor in carbon sequestration related studies as the soil carbon stock change estimates may either suggest that the simulated ecosystem is a carbon sink or to the contrary a carbon source on the long run. Careful evaluation of the input database quality seems to be an inevitable and highly relevant step towards more realistic plant production and carbon balance simulations.
1. Introduction
Modelling is an essential tool in agricultural systems science (Jones et al. Citation2017). Beside environmental index-based methods (Olesen et al. Citation2011), statistical models (Delerce et al. Citation2016) and Niche-based models (Estes et al. Citation2013) process-based models are the most commonly used tools for climate impact studies as well as for environment protection related assessments. Process-based agro-environmental models, often simply called crop models (Smith, Prentice, and Sykes Citation2001; Jones et al. Citation2003; Keating et al. Citation2003; Brisson et al. Citation2003; Stöckle, Donatelli, and Nelson Citation2003; Kersebaum Citation2007; Nendel et al. Citation2011) are the mathematical (usually computer-based) representations of the most important processes of the soil-plant system consisting of a set of ordinary or partial differential equations and empirical equations organized into procedures or modules where the outputs of one procedure can serve as input to other procedures and the model as a whole is able to describe the temporal pattern of the key system parameters. These models are designed to calculate crop yield and other important parameters of the soil-plant system as a function of weather and soil conditions, plant-specific characteristics as well as a choice of agricultural management practices. Crop models have a central role in informing agro-industry and policy makers about the risks and potential of adaptation strategies to counter climate change, as well as directing plant scientists and breeders towards the required traits in improved varieties and cropping systems’ management practices to mitigate global climate change impacts (Fodor et al. Citation2017).
Currently, there are two large modelling initiatives: the Agricultural Model Intercomparison and Improvement Project – AgMIP (agmip.org) and the Modelling European Agriculture for Climate Change project – MACSUR (macsur.eu). These networking hubs coordinate and support crop model development, together with crop model based studies and impact assessments, providing information for producers, policymakers and the public in the area of integrated climate change risk assessment for global agriculture and food security. Model inter-comparison studies carried out by various AgMIP and MACSUR groups have identified large uncertainties and biases in model outputs (e.g. Asseng et al. Citation2013, Citation2014; Bassu et al. Citation2014). In these studies, all members of the model ensemble used the same input datasets thus the results clearly demonstrate the significant structural differences of the incorporated models.
Using good quality local (weather, soil and plant development and growth) data and careful calibration agro-environmental models are capable of reliably simulating the yield formation dynamics, the final yield and the changes of other system parameters (e.g. soil organic carbon content) at plot scale (Verburg and Bond Citation2003; Sommer et al. Citation2008; Jégo et al. Citation2013; Li et al. Citation2015). Though, accurate modelling of the impact of extreme weather events and/or agromanagement options is still a challenge even for the state-of-the-art models (Barlow et al. Citation2015; Hussain et al. Citation2018). In order to use simulation models at larger scales, those should be coupled with weather and soil databases representatively covering the study area. There are two fundamentally different ways to do it: (1) carry out the simulations for certain points of the study area using locally available input data then spatially interpolate the simulation results; (2) spatially interpolate the model inputs first and create an input data grid then carry out simulations for each grid points using the corresponding inputs. Vast majority of the larger scale studies use the latter approach, often called gridded modelling (Webber et al. Citation2018; Müller et al. Citation2019; Shelia et al. Citation2019; Franke et al. Citation2020). Gridded model assessments require at least one climatic and one soil database of certain spatial resolution as a minimum prerequisite for carrying out the simulations. Various uncertainties exist, not only in the design of the applied model(s) and model parameters, but also in various types of input data. Waha et al. (Citation2015) investigated the model (small scale vs large scale) selection as well as the climate and soil input data resolution (both spatial and temporal) related uncertainty of crop model outputs. Hoffmann et al. (Citation2015) and Zhao et al. (Citation2015) investigated the climate data aggregation effect, while Folberth et al. (Citation2016), Grosz et al. (Citation2017), Coucheney et al. (Citation2018) and Maharjan et al. (Citation2019) investigated the soil data aggregation effect on specific model outputs. Recently, Ojeda et al. (Citation2020, Citation2021) assessed the combined data aggregation effect of climate and soil on APSIM model outputs. Tao et al. (Citation2018) presented the contribution of crop model structure and parameters to model output uncertainty in climate change impact assessments. In many cases, there are several parallel soil and climate database development projects that provide sufficient, observation based input data for crop model based impact studies. Due to the different data processing approaches and methodologies as well as the differences in the underlying network of observation stations that provides base data for the gridded database, the available soil and weather data sources provide different data for the very same crop model inputs. Obviously, differences in the applied input databases could be a significant source of uncertainty in crop model outputs (Ojeda et al. Citation2020, Citation2021). The question is the relative significance of this uncertainty compared to others such as the uncertainty related to the spatial heterogeneity of soil or the interannual variability of weather.
The main goal of this study is to demonstrate and assess the input database related uncertainty of the Biome-BGCMuSo agro-environmental model outputs when Net Primary Production (NPP), Evapotranspiration (ET), Total Ecosystem Respiration (TER) and Soil Organic Carbon Content Change Rate in the topsoil (SOCCR) are simulated using climatic and soil input data retrieved from different databases.
2. Material and methods
2.1. Biome-BGCMuSo v6.1 model
The Biome-BGCMuSo v6.1 model has been created by merging the 4M crop model (Fodor, Pásztor, and Németh Citation2014) with the Biome-BGCMuSo v4.1 biogeochemical model (Hidy et al. Citation2016). Biome-BGCMuSo v6.1, also called Biome-BGCMAg v2.1, is a detailed biogeochemical model extended with many features from the 4M crop model, thus merges many capabilities from both model families. The hybrid model is capable of simulating all major land use types, any kind of land use changes, a large number of agro-management operations, as well as the full water, carbon and nitrogen cycle of the plant-soil system including its GHG (greenhouse gas) balance. Key processes are simulated according to the procedures listed in .
Table 1. Key processes simulated in the Biome-BGCMuSo agro-environmental model and the corresponding references.
More details of the model features can be found in Fodor, Pásztor, and Németh (Citation2014) and Hidy et al. (Citation2016). Biome-BGCMuSo is coupled with high resolution (0.1°×0.1°) gridded climate and soil databases constituting the so called AgroMo modelling framework.
2.2. Study area
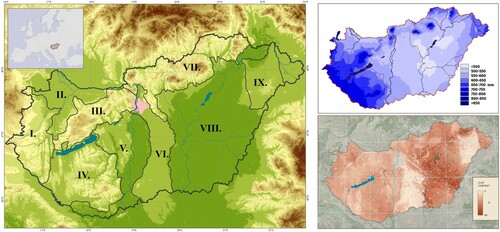
Three climatic and soil datasets were collected and post-processed to have the same spatial resolution of approx. 10×10 km. The data grids cover the area of Hungary with 1104 cells (). The majority of the agricultural land in the Carpathian basin is located in Hungary. Regarding its plant production, Hungary ranks among the best in the world concerning the average yields of her main crops: maize, wheat, sunflower and rapeseed.
Figure 1. Location of the study area within Europe and its main regions (left): Feet of the Alps (I.),Little Hungarian Plain (II.), Transdanubian Mountains (III.), Transdanubian Hills (IV.), Great Hungarian Plain (V., VI, VIII., IX), North Hungarian Mountains (VII.). The Great Hungarian Plain can be divided into four well-distinguishable regions, two of which (VI., IX.) are dominantly covered by coarse texture sandy soils while the other two regions (V., VIII.) are mostly covered with fine texture loamy and clayey soils. Top right: Average annual precipitation (1981-2010), retrieved from the website of the Hungarian Meteorological Service, Bottom right: Clay fraction of the topsoil (0-30 cm).
2.3. Climate data
The Biome-BGCMuSo model requires the daily global radiation, maximum and minimum temperature, daylight average vapour pressure deficit and precipitation as input data. For a historical time period, time series from three different databases were used in the study, namely, the CARPATCLIM, the FORESEE and the ERA5.
CARPATCLIM is an observation-based dataset that contains several meteorological variables for the broader Carpathian Region covering the time period 1961–2010 (Spinoni et al. Citation2015) at 0.1°×0.1° resolution regular grid. During the construction of CARPATCLIM the same methodology was used by the national meteorological services that were involved in the international project for homogenization and interpolation of the observed station data (Szentimrey Citation2007; Szentimrey and Bihari Citation2006). For the study area, CARPATCLIM uses an observation network of 109 stations for precipitation, and 34 stations for temperature, and it can be considered as the best possible database for Hungary, though with limited temporal coverage. CARPATCLIM is one of the regional, observation based gridded datasets that are available for specific parts of Europe (summarized in Fantini et al. Citation2016).
FORESEE (Open Database FOR ClimatE Change-Related Impact Studies in CEntral Europe) is a free meteorological database for Central Europe covering the time period of 1951–2100 with 1/6°×1/6° spatial resolution (Dobor et al. Citation2014; Kern, Marjanović, and Barcza Citation2016). FORESEE contains observation-based daily maximum/minimum temperature and precipitation data and climate projections for the same variables as well, the latter starting from the last observed year that is continuously updated. The dataset is supplemented by global radiation data estimated by the MTClim software (Thornton, Hasenauer, and White Citation2000). The observation based data (1951–2018) was built using the E-OBS dataset (Kern, Marjanović, and Barcza Citation2016; Cornes et al. Citation2018). In the present study we used an interpolated version of FORESEE at the same 0.1°×0.1° resolution regular grid that is defined by CARPATCLIM. FORESEE uses a relatively low number of station data (17 stations for temperature and 16 stations for precipitation). The daily data stored on the original grid of FORESEE were resampled to the finer grid of 0.1° × 0.1° using an interpolation technique (Kern et al., Citation2016) that takes elevation into account.
ERA5 is a reanalysis database constructed and disseminated by ECMWF (Copernicus Climate Change Service Citation2017; Hersbach et al. Citation2019). ERA5 is the fifth generation of reanalysis products of ECMWF which contains major improvements both in terms of spatial (0.1°) and temporal (hourly) resolution. At present, ERA5 contains data from 1950 until the present in hourly time steps. Observations are used indirectly in ERA5 through the 4D-Var data assimilation method. In this sense ERA5 represents an alternative compared to CARPATCLIM and FORESEE that are both interpolated, observation based datasets. This assimilation method uses instrumental measurements and short range model runs to produce gridded values of several meteorological parameters: rainfall, air temperature, incoming solar radiation and many others. ERA5 data were retrieved using the CDS API via R interface. The hourly data was post-processed to provide daily minimum/maximum temperatures and other ancillary variables needed in the study.
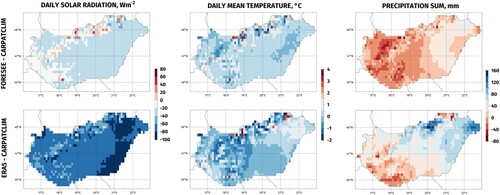
The databases show considerable differences both in details (presence or lack of spatial features) and in the spatial distribution of the parameters for the majority of the months. The CARPATCLIM database was developed by using substantially more station data for the interpolation, therefore, it gives a most detailed picture for the study area. FORESEE also shows the effect of topography (e.g. mountains in the north-eastern part of the country), but it is more rough. In the case of ERA5, the fine details related to topography cannot be seen, but the spatial structure of temperature in all the three reference databases are similar: an increasing Northwest-Southeast gradient can be recognized though, with quite different mean values. Differences of the average solar radiation intensity, average daily mean temperature and precipitation sum for the vegetation period (April-October) for 1981–2010 based on the investigated databases were presented on maps according to Ojeda et al. (Citation2021) (). The CARPATCLIM database was used as a benchmark for the comparisons. Apart from some grid cells in the hilly regions, the vast majority of the study area receives considerably less radiation according to the FORESEE and ERA5 databases. This is especially true for the ERA5 database. Regarding the average temperature for the majority of the study area, the differences between the databases are within the −0.5–0.5 °C range. Larger deviations can be observed mainly in the hilly areas. There are no clearly ‘cooler’ or ‘warmer’ databases. Certain regions can be warmer according to one database than to another, while for another region this tendency turns around for the same pair of databases. The Western and Eastern part of the study area receives less and more precipitation, respectively according to the FORSEE database. Except from some grid cells in the North and in the South, the whole study area receives considerably more precipitation according to the ERA5 database. This difference could exceed 100 mm for the vegetation period in the North-Eastern part of the study area.
Figure 2. Differences of the average daily solar radiation intensity, average daily mean temperature and precipitation sum for the vegetation period (April-October) for 1981–2010 based on the investigated databases. Top/bottom row: values obtained from the FORESEE/ERA5 database minus the values obtained from the CARPATCLIM database.
2.4. Soil database
Water content at saturation (SAT), field capacity (FC) and wilting point (WP) and saturated hydraulic conductivity (KS) are the key soil input parameters of the Biome-BGCMuSo model. We analysed four sets of soil parameters: EU-SHG: retrieved from the continental, 250 m resolution EU-SoilHydroGrids dataset (Tóth et al. Citation2017); US-PTF, EU-PTF and HU-PTF where the soil parameters were computed by using basic soil properties (bulk density, sand content, etc.) from the 100 m resolution DOSoReMI database (Pásztor et al. Citation2020) with the pedotransfer functions (PTFs) proposed by Ritchie, Gerakis, and Suleiman (Citation1999), Tóth et al. (Citation2015) and Szabó et al. (Citation2019), respectively. EU-SHG is the 3D soil hydraulic map of Europe which was derived from the 250 m SoilGrids (Hengl et al. Citation2017) dataset with the European PTFs (Tóth et al. Citation2015). US-PTFs, EU-PTFs and HU-PTFs differ in their training dataset as well as in the predictor variables. The US-PTFs were obtained on a database of soil water limits and other basic soil properties of 401 soil samples from 15 states in the USA (Ratliff, Ritchie, and Cassel Citation1983). This method uses bulk density, soil organic carbon, sand and clay content values to estimate SAT, FC and WP. The EU-PTFs were trained on the European Hydropedological Data Inventory (Weynants et al. Citation2013). SAT was computed from particle size distribution, topsoil and subsoil distinction, organic carbon content and bulk density. For the estimation of FC and WP, particle size distribution and organic carbon content was used. The HU-PTFs includes several other environmental variables as well further to the basic soil properties. These PTFs were derived on the Hungarian Detailed Soil Hydrophysical Database (Makó et al. Citation2010) extended with topographical, meteorological, geological and remotely sensed vegetation parameters therefore are specific for the Pannonian region. For all four datasets the saturated hydraulic conductivity was estimated according to Suleiman and Ritchie (Citation2001) using field capacity and bulk density. The four soil databases shared the maximum soil depth data field, so the very same (observation based, spatially interpolated) values were used for all of them. The maximum soil depth values were not homogenized across the grid cells, instead spatially explicit values were used in the simulations (Fig A1).
In order to maintain reasonable computation time during, all input data were provided for the Biome-BGCMuSo calculations at the resolution of the climatic data (approx. 10×10 km). Accordingly, the finer resolution soil data had to be upscaled. Following the recommendations of Ojeda et al. (Citation2020) a dominant soil type method is used for this purpose. For every 10×10 km grid cells one representative cell out of the 10.000 constituting 100×100 m subcells of the DOSoReMI grid has been selected. The location of this representative cell was used to pinpoint the representative from the coarser resolution EU-SoilHydroGrids, as well. The DOSoReMI database comprises separate data arrays for the 0-30, 30-60, 60–100 and 100–200 cm deep layers. First, the average bulk density, soil organic matter, sand, silt and clay content of the 10.000 subcells were calculated for each soil layer. The representative subcell was selected by comparing the subcell properties to the average values and looking for a subcell for which the weighted distance from the average (wD) is minimal (see equation below).
where
denotes the jth parameter of the ith subcell in the kth layer,
denotes the average of the jth parameter in the kth layer for the 10.000 cells, and
denotes the weight factor for the kth layer sum. In case of j = 1, 2, 3, 4 and 5 P is the bulk density, organic matter, sand, silt and clay content, respectively. In case of k = 1, 2, 3 and 4 the value of
is 5, 3, 2 and one, respectively.
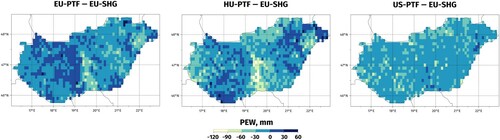
HU-PTF dataset provides the most detailed picture of the soil cover as it takes the highest number of determinants into account, including topographical and geological information. One can clearly recognize the low quality sandy soils characterized by low Plant Extractable Water (PEW) value on the maps (except for the US-PTF dataset) located in the middle and the North-Eastern part of the study area (cf. .). The pedotransfer function that calculates the PEW values of the US-PTF dataset uses the sand and the SOM content only and assumes that PEW equals around 13 V% for a wide range of soils. Only soils with very high sand or SOM content are supposed to have significantly lower or higher PEW value, respectively. Accordingly, apart from a few cells, PEW is around 13V% for the whole study area in the US-PTF dataset. Differences of the plant extractable water of the top 100 cm layer of the soils were calculated based on the investigated databases using the EU-SHG database as a benchmark for the comparisons ().
Figure 3. Differences of the plant extractable water (PEW) of the top 100 cm layer of the soil profile calculated based on the investigated databases: EU-PTF, HU-PTF and US-PTF. The EU-SHG database was used as a benchmark for the comparisons.
2.5. Model setup
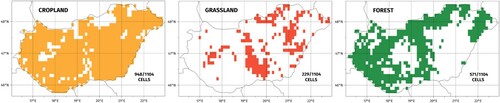
Three major land cover types were simulated by using the Biome-BGCMuSo model covering the target area: crop-, grass- and forestlands (). Considering that maize is grown on the largest portion of croplands (HCSO Citation2021), and 86% of the forested area are deciduous forest (Bán et al. Citation2001) in Hungary, croplands and forests were represented by maize and deciduous broadleaf forest in the simulations, respectively. The key plant specific Biome-BGCMuSo model parameters, that were selected based on the result of a prior sensitivity analysis, were calibrated by using observed data. A Generalized Likelihood Uncertainty Estimation (GLUE) method (Beven and Binley Citation1992) based procedure was used to determine the optimum value of the input parameters minimizing the absolute difference between the model outputs and the corresponding observed data. During calibration the upper and lower bounds of the possible input parameters were set to literature based values (Stöckle and Nelson Citation2013; White et al. Citation2000).
Figure 4. Grid cells where the ratio of crop, grass and forest area exceeds 20%.
In case of maize, a two-step calibration method was used. First, parameter adjustment was performed based on eddy covariance GPP (Gross Primary Production) measurements carried out at the Klingenberg cropland site (50°53'35.0"N; 13°31'20.6"E) in Germany (Prescher, Grünwald, and Bernhofer Citation2010). Based on the eddy covariance data of maize experiments from 2007 and 2018, fraction of leaf N in Rubisco, specific leaf area and allocation parameters were calibrated. In the second step, average annual yield data (1991-2018) from the long-term field experiments of the Centre for Agricultural Research (Martonvásár: 47°19'56.97"N, 18°47'50.61"E) in Hungary were used for calibration. The average yield was calculated from 16 yield data of four treatments (4 repetitions in each treatment) for each year. The selected treatments shared the following features: chernozem soil with deep (50+ cm) A horizon with at least 2.6% organic matter content in the topsoil; at least 160 kg/ha/y nitrogen fertilizer level; FAO350 hybrid planted in the second decade of April with 7 seeds/m2 density. The maximum senescence rate of the above ground biomass, the effect of water stress on photosynthesis, and the root weight corresponding to the maximum root depth model parameters were fine-tuned to obtain the best fit of the simulated maize yields on the observed data. The resulting plant parameter set for maize provided estimates that are consistent with both the long-term field experiment yield data and the daily resolution carbon flux data. Maize simulations were then validated by using the NUTS-3 level (EuroStat Citation2021) yield data retrieved from the database of the Hungarian Statistical Office. This database provided a total of 570 yield data for the 19 NUTS-3 regions of Hungary for the 1981–2010 period.
In case of grasslands, Leaf Area Index (LAI) data of a humid grassland experiment site (Hegyhátsál: 46°57'20.76"N, 16°39'7.39"E; Barcza et al. Citation2003; Nagy et al. Citation2010) was used for model calibration. Photosynthesis, soil water stress and allocation related parameters were adjusted to match the LAI dynamics of the humid, productive grassland site. LAI was measured with an ACCUPAR LP-80 ceptometer (METER Group Citation2021) several times during the vegetation period in four years between 2009 and 2012. Another parameter set representing dry grasslands was constructed so that the additional simulation results were consistent with observations made at a Hungarian sandy, dry, low productivity grassland site (Fülöpháza: 46°52'16.48"N, 19°25'17.44"E; Ónodi et al. Citation2018), where the maximum of LAI was measured in each year with the same instrument in the 2003–2012 period. For this purpose, the fraction of leaf N in Rubisco and the specific leaf area parameter was decreased, and the soil water content stress related aboveground senescence coefficient was increased. Grass simulations were then validated by using the NUTS-3 level biomass data of the Hungarian Central Statistical Office.
For the deciduous forest simulations the input parameter set proposed by White et al. (Citation2000) was used and the results were consistent with our best knowledge about Hungarian forest carbon uptake (Marjanović et al. Citation2010) and storage.
During the model setup (calibration and validation) the CARPATCLIM climatic and the EU-SHG soil databases were used. With a minor change, we applied the method suggested by Ojeda et al. (Citation2018) to assess model performance both in calibration and validation. The following statistical indicators were used: concordance correlation coefficient (CCC) defined by Lin (Citation1989), mean absolute error (MAE) defined e.g. in Willmott and Matsuura (Citation2005) and mean signed error (MSE, also known as bias) which is also defined in Lin (Citation1989) We decided to use MAE instead of root mean square error as the former has some advantages over the latter: MAE is a more natural and unambiguous measure of average error (Willmott and Matsuura Citation2005).
2.6. Model simulations
After calibrating the plant parameters, the three major land cover types were simulated by using the Biome-BGCMuSo model with specific plant parameter sets for crop-, grass- and forestlands. The model was run with all climate×soil dataset combinations but only for those grid cells where the share of the land cover type in question exceeds 20% according to the CORINE-2012 (EEA Citation2021) database (), resulting in 948×12 = 11376, 229×12 = 2748, 571×12 = 6852 30 year-long simulations for the 1981–2010 period for crop-, grass- and forestlands, respectively. The period was limited due to the CARPATCLIM database as it provides data series till 2010 only.
Composite grassland simulation was performed using the so-called NÖSZTÉP land cover database (Tanács et al. Citation2019). By using the NÖSZTÉP data it was possible to distinguish between productive and less productive grassland sites in Hungary. Two grassland simulations were performed for each selected grid cells and the results were calculated by linear combination of the partial results considering the share of productive/less productive grassland area within the pixel.
2.7. Assessment of uncertainty
30-year-long (1981-2010) simulations were carried out with the calibrated Biome-BGCMuSo model using the twelve climate×soil input dataset combinations. Annual Net Primary Production (NPP), Annual Total Evapotranspiration (ET), Annual Total Respiration (TER) and Organic Carbon Content Change Rate (SOCCR) of the topsoil results were compared across the simulations with paired samples t-tests (with α = 0.5 significance level) using MS Excel Analysis ToolPak. Model results obtained with a specific climate-soil input database combo were selected in every possible way, resulting in different pairs and comparisons. The simulations in each pair differed either in the used soil or climate or both input databases. The variance of the simulation results were investigated in five different ways. Spatial [1], temporal [2], spatiotemporal [3], climate database related [4] and soil database related [5] variances were calculated. Additionally, the mean of the investigated model outputs (MEANall) across the grid cell, simulation years and the applied input databases were also computed.
(1a)
(1a)
(1b)
(1b)
(2)
(2)
(3)
(3)
(4a)
(4a)
(4b)
(4b)
(5a)
(5a)
(5b)
(5b)
(6)
(6)
where denotes the ith model output obtained with the jth climate and lth soil database for the pth grid cell in the qth simulation year. In case of i = 1, 2, 3 and 4, X stands for the NPP, ET, TER and SOC, respectively. In case of j = 1, 2 and 3 the CARPATCLIM, FORESEE and ERA5 dataset, while in case of l = 1, 2, 3 and 4 the EU-SHG, EU-PTF, HU-PTF and US-PTF databases were used in the simulations. In case of crop, grass and forest simulations N = 948, 229 and 571, respectively (cf. .).
Temporal and spatiotemporal variability could not be defined for SOCCR, since this variable intrinsically carries temporal aspects by definition. Uncertainties originating from different sources were characterized by the above defined variations. Spatial variance (VARspat) is a demonstrative measure of model uncertainty that is a result of the spatial heterogeneity of the soil characteristics across the grid. Temporal variance (VARtemp) is a measure of uncertainty caused by the interannual variability of climatic parameters. Climate and soil database related variances (VARclimateDB and VARsoilDB) characterize the uncertainty originating from an arbitrary choice of climate and/or soil input database. Climate database related variances were compared to the temporal as well as to the spatiotemporal variances, and soil database related variances were compared to the spatial as well as to the spatiotemporal variances to demonstrate their relative significance. In order to present the spatiotemporal aspects of the climate and soil database related relative uncertainties (RUNC), the distributions of the ratios of the climate and/or soil database related variances and the spatiotemporal variance [6] [7] [8] across the years and grid cells were also investigated. VARclimateDB and VARsoilDB measures were correlated to environmental parameters to locate domains where the selection of the input database could be a crucial issue.
(6)
(6)
(7)
(7)
(8)
(8)
The distribution of the SOC change rate model results across the grid cells were analysed more thoroughly as the sign of this output is related to a highly important issue in the context of climate change: whether the soil is a carbon sink or a carbon source under the investigated land-use types.
3. Results and discussion
3.1. Model calibration and validation
Performance of the calibrated Biome-BGCMuSo model in simulating maize GPP and yield as well as grass LAI is demonstrated in the Appendix on Figure A2. and A3., respectively. After calibrating the selected plant specific parameters the model was capable of estimating the observed values with a comparable efficiency reported in similar studies (Liu et al. Citation2012; Bao et al. Citation2017; Soufizadeh et al. Citation2018; Sándor et al. Citation2017), except for the dry grassland site. Note that ceptometer measurements are quite problematic, loaded with considerable error and tend to underestimate the actual leaf area when LAI is below one (Pokovai and Fodor Citation2019). Nevertheless, the model was able to capture the low productivity of the dry grassland site. The Biome-BGCMuSo model overestimated the NUTS-3 level observed production data (Figure A4.) used for validation. This is a general issue of crop models as those are still incapable of precisely simulating the impact of various abiotic and biotic stress factors and usually assume ideal (perfectly executed) agro-management which is rarely the case in real farm plant production.
3.2. Assessment of uncertainty
According to the t-tests, in the majority of the 66 cases, exchanging either the climate or soil or both input databases resulted in significant changes in the outputs ().
Table 2. Number and percentage of significant changes caused by exchanging either the climate or the soil or both of the input databases regarding the investigated land use types and model outputs.
Based on the simulation results, exchanging the soil input database causes considerably smaller uncertainty in all investigated model outputs and for all land use types than exchanging the climate input database (). The relative significance of the different input database related uncertainties relative to the spatiotemporal uncertainty (RUNCsoilDB, RUNCclimateDB, RUNCinputDB) are presented in . The expected value of the soil database related uncertainty of NPP (indicated by the 50th percentile of the RUNCsoilDB values) is 17.0, 7.8 and 11.6% in case of croplands, grasslands and forests, respectively. The climate database related uncertainty (RUNCclimateDB) of NPP was found to be 53.1, 11.3 and 36.9% in case of croplands, grasslands and forests, respectively. The approximate uncertainty measures of the other investigated outputs can be read out from , by reading the abscissas corresponding to the 50% probability ordinates. Additionally, the relative significance of uncertainties originating from various sources could be estimated by calculating the ratio of two selected entries from , avoiding inappropriate pairs, of course: e.g. variables with different units.
Figure 5. Importance of the soil database (orange, RUNCsoilDB), the climate database (blue, RUNCclimateDB) and the input database related uncertainty (black, RUNCinputDB) relative to the spatiotemporal uncertainty.
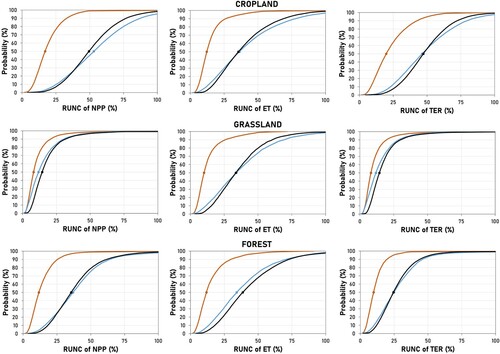
Table 3. Variances of the model outputs resulting from different sources (defined by [1] – [5]).
Putting the input database related uncertainty into context for croplands (0.0555 kgC m−2) by assuming that the 85% of the NPP is stored in the above ground biomass that has an average of 45% carbon content and also assuming a harvest index of 0.5, cropland VARinputDB corresponds to 524 kg ha−1 yield uncertainty. It is 9.2% of the long term average maize yield in Hungary and 38% of the mean absolute error of the Biome-BGCMuSo simulated yields when the model was validated against NUTS-3 (county) level observed data. It seems that it is practically indifferent what climate or soil database is used when simulating the Net Primary Production or Annual Total Respiration of grasslands; the expected value of both RUNCclimateDB and RUNCsoilDB is around 10%. However, it is only an apparently low variability that is caused by the relatively high spatiotemporal variability of the grassland NPP and TER () compared to VARspattemp of croplands and forests. The reason of the relatively high spatiotemporal variability most likely lies in the following two facts. Firstly, that grassland cells are located in highly different regions. Eighteen % of the cells are located on sandy soils (sand > 80%), 28% of the cells are located on clayey soils (clay > 30%), and these cells are situated on the relatively dry middle and Eastern part of the country while the rest of the cells are in the mountainous (altitude > 500 m a.s.l.), relatively wet parts of the study area. Secondly, grasslands are diverse ecosystems that was accounted for a simply way in the study: a wet and a dry grassland simulation were performed for each grid cells and the outputs were calculated as linear combinations of the partial results considering the share of the productive and the less productive grassland areas within the pixel. The share of the dry grasslands across the grid cells shows polarized, double peak distribution: 37 and 31% of the cells have less than 25 and more than 75% share of dry grasslands, respectively. Wet grasslands produce relatively large biomass even in dry years while dry grasslands produce relatively small biomass even in wet years, resulting in a relatively high spatiotemporal variability of carbon balance related outputs (NPP and TER). For the rest of the outputs and land use types the expected value of the climate database related uncertainty may approach or even surpass 50% of the spatiotemporal uncertainty. The soil database related uncertainty exceeds 15% of the spatiotemporal uncertainty only in case of cropland NPP. To the contrary, the climate database related uncertainty is less than 15% of the spatiotemporal uncertainty only in case of grassland NPP and TER. In every other cases it is at least 25% of the spatiotemporal uncertainty. In the vast majority of the cases (cells and years) the soil and climate database related uncertainty is less than 25 and 75% of the spatiotemporal uncertainty, respectively. However, the climate database related uncertainty might exceed the spatiotemporal uncertainty in some cells and/or years (, Cropland NPP (96th percentile = 102%) and Forest ET (98th percentile = 108%)).
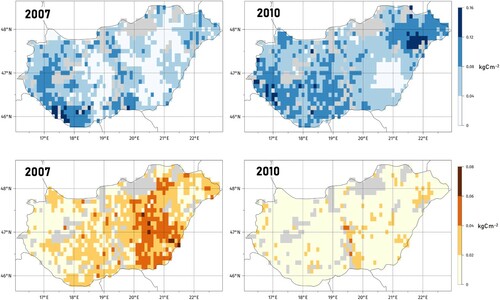
For the cropland NPP, a relatively strong linear relationship was found between the yearly component of the climate database related uncertainty and the average annual precipitation (AAPrec, mm): (VARclimateDB = 0.0000942×AAPrec + 0.0039487; r = 0.548). An even stronger quadratic relationship was found between the grid cell specific component of the soil database related uncertainty and the clay fraction of the top soil (CLAY, %): (VARsoilDB = 0.0000245×(CLAY – 18)2 + 0.0175; r = 0.645). The higher the annual precipitation amount the higher uncertainty the climate database selection may cause. In wet years, either or both the number of wet days and the precipitation amounts are higher providing more opportunities for differences between the input datasets, compared to dry years. The VARclimateDB seems to be more pronounced on sandy soils characterized by very low clay content and extreme water-balance regime (cf. and ). The soil database related uncertainty has its highest values both for sandy and clayey soils, both having extreme water-balance characteristics: low water holding capacity for sandy soils and low permeability for clayey soils. Since it is always a challenge for databases to properly represent the extremes, no wonder that VARsoilDB exhibits the highest values for these soil types. Soil database related uncertainty is much more pronounced in dry years especially on clayey soils, but it still can be an issue in wet years on sandy soils (.). If there is sufficient amount of precipitation (e.g. in 2010), it does not matter how different the soil characteristics (especially water holding capacity) are in the different databases, there can be enough water in the soil for the plants not limiting their simulated growth. In dry years (e.g. in 2007) several other soil parameter related factors become decisive for plant production: extreme low permeability (characteristic of clays) increases runoff and further decrease the available water content is the soil; the root zone is usually less deep in these years that make the potentially available water amount less that can be escalated by the fact that the most sporadic rain events can moisten only the topsoil.
Figure 6. Spatial distribution of the yearly component of the climate (top) and soil (bottom) database related uncertainty of cropland NPP in a dry and in a wet year. 2007 was one of the most drought-affected years and 2010 was the wettest year of the investigated time period (1981-2010).
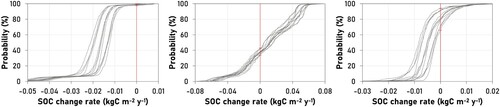
By looking at how the SOCCR changes depend on the climate-soil input database combination across the grid cells (.) it turns out that there are several grid cells: 17/948 (1.8% of croplands); 35/229 (15.3% of grasslands); 179/571 (31.3% of forests) where the SOC content change rate could be either negative (SOC decreases) or positive (SOC increases). The extent of this change, could reach 0.121 kgCm−2y−1 (changing from −0.053–0.068 kgCm−2y−1) on grasslands and 0.034 kgCm−2y−1 (changing from −0.026–0.008 kgCm−2y−1) on forestlands depending on the climate-soil input database combination used for the simulations. With only a couple exceptions on forestlands, the cells where the database selection change the sign of SOCCR are located in the hilly or mountainous regions (., region I., III., IV., VII.). The ERA5 temperatures are clearly higher all year around ( shows the difference for May only) than the CARPATCLIM temperatures that causes significantly more intense soil life, an accelerated respiration in the simulations when the CARPATCLIM database is used, in line with the findings of Davidson and Janssens (Citation2006). When averaged across the different soil database selections, 415 and 526 cells are characterized by decreasing soil organic carbon content when the ERA5 and the CARPATCLIM databases provide temperature data for the simulations, respectively. The soil input database change (with fixed climate input database) may also result in a sign change of SOCCR. In case of the CARPATCLIM, FORESEE and ERA5 databases, the number of cells with negative SOCCR varies between 382 and 455, 454 and 487 as well as between 522 and 535, respectively. In every case, the use of the EU-SHG and the US-PTF database provided the lowest and the highest number of cells with decreasing soil organic carbon content, respectively. For these cells that are located in the wetter, hilly or mountainous regions, the average Annual Total Ecosystem Respiration obtained with the US-PTF soil database is 0.018 kgCm−2y−1 greater than the TER obtained with the EU-SHG database. This kind of difference can also be detected in the soil respiration component of TER that explains the more intense decrease of soil organic carbon when the US-PTF database is used. The rate of soil organic matter decomposition as well as the related CO2 emission and SOC decrease are reciprocal functions of both the difference of the soil moisture contents at field capacity and wilting point and the difference of the field capacity and the hygroscopic soil moisture content. However, displays only the prior difference, which is practically the PEW value, it holds true for the latter difference as well, that both are clearly smaller in the US-PTF soil database.
Figure 7. Distribution of the topsoil SOC content change rate across the grid cells depending on the climate-soil input database combination (3×4=12 combinations in total). From left to right: croplands, grasslands, forests.
4. Conclusions
Depending on the underlying data collection and data processing methodology, the available climate and soil databases offer considerably different values even for key model inputs such as precipitation amount and plant extractable water capacity. The input database choice introduces considerable uncertainty to the simulation results of the Biome-BGCMuSo model. Input database uncertainty is far from being negligible as it may introduce model output variability that is comparable to the variability the year-to-year change of the weather or the spatial heterogeneity of the soil causes. Various environmental conditions, such as annual precipitation amount and soil clay content strongly influence the extent of the input database related uncertainty, thus result in inhomogeneity in its spatial distribution. Input database selection could be a decisive factor in carbon sequestration related studies, especially when process- based models are used (e.g. Valkama et al. Citation2020), since depending on the choice, the soil carbon stock change estimates may either suggest that the simulated ecosystem is a carbon sink or to the contrary a carbon source on the long run. Climate database choice adds another source of uncertainty to climate projections as the related uncertainty propagates to an uncertainty in the projection through bias correction. Considering its importance, the input database related uncertainty should be included in the ensemble modelling studies or in the super-ensemble probabilistic assessments (Tao et al. Citation2018) in order to account for the uncertainties from various important sources. Careful evaluation of the quality of the climate and soil input databases seems to be an inevitable and highly relevant step towards more realistic plant production and carbon balance simulations.
Supplementary_Material
Download MS Word (1,007.5 KB)Data availability statement
The data that support the findings of this study are available on request from the corresponding author, [NF] The data are not publicly available due to [restrictions e.g. their containing information that could compromise the privacy of research participants].
Disclosure statement
No potential conflict of interest was reported by the author(s).
Correction Statement
This article has been republished with minor changes. These changes do not impact the academic content of the article.
Additional information
Funding
References
- Asseng, S., F. Ewert, P. Martre, R. P. Rötter, D. B. Lobell, D. Cammarano, B. A. Kimball, et al. 2014. “Rising Temperatures Reduce Global Wheat Production.” Nature Climate Change 5: 143–147. doi:https://doi.org/10.1038/nclimate2470.
- Asseng, S., F. Ewert, C. Rosenzweig, J. W. Jones, J. L. Hatfield, A. C. Ruane, K. J. Boote, et al. 2013. “Uncertainty in Simulating Wheat Yields Under Climate Change.” Nature Climate Change 3: 827–832. doi:https://doi.org/10.1038/nclimate1916.
- Bán, I., A. Osváth, M. Tóth, L. Balogh, and P. Csóka. 2001. “Forest resources of Hungary, 2001.” State Forest Service, Hungary, Budapest. ISSN 0238-1303. In Hungarian with English summary.
- Bao, Y., G. Hoogenboom, R. McClendon, and G. Vellidis. 2017. “A Comparison of the Performance of the CSM-CERES-Maize and EPIC Models Using Maize Variety Trial Data.” Agricultural Systems 150: 109–119. doi:https://doi.org/10.1016/j.agsy.2016.10.006.
- Barcza, Z., L. Haszpra, H. Kondo, N. Saigusa, S. Yamamoto, and J. Bartholy. 2003. “Carbon Exchange of Grass in Hungary.” Tellus B: Chemical and Physical Meteorology 55 (2): 187–196. DOI: https://doi.org/10.3402/tellusb.v55i2.16695.
- Barlow, K. M., B. P. Christy, G. J. O’Leary, P. A. Riffkin, and J. G. Nuttall. 2015. “Simulating the Impact of Extreme Heat and Frost Events on Wheat Crop Production: A Review.” Field Crops Research 171: 109–119. doi:https://doi.org/10.1016/j.fcr.2014.11.010.
- Bassu, S., N. Brisson, J. L. Durand, K. Boote, J. Lizaso, J. W. Jones, C. Rosenzweig, et al. 2014. “How do Various Maize Crop Models Vary in Their Responses to Climate Change Factors?.” Global Change Biology 20 (7): 2301–2320. doi:https://doi.org/10.1111/gcb.12520.
- Beven, K., and A. Binley. 1992. “The Future of Distributed Models: Model Calibration and Uncertainty Prediction.” Hydrological Processes 6 (3): 279–298. doi:https://doi.org/10.1002/hyp.3360060305. ISSN 0885-6087.
- Brisson, N., C. Gary, E. Justes, R. Roche, B. Mary, D. Ripoche, D. Zimmer, et al. 2003. “An Overview of the Crop Model Stics.” European Journal of Agronomy 18 (3–4): 309–332. doi:https://doi.org/10.1016/S1161-0301(02)00110-7.
- Copernicus Climate Change Service (C3S). 2017. ERA5: Fifth generation of ECMWF atmospheric reanalyses of the global climate.” Copernicus Climate Change Service Climate Data Store (CDS). Accessed February 17, 2021. https://cds.climate.copernicus.eu/cdsapp#!/home.
- Cornes, R. C., G. van der Schrier, E. J. M. van den Besselaar, and P. D. Jones. 2018. “An Ensemble Version of the E-OBS Temperature and Precipitation Data Sets.” Journal of Geophysical Research: Atmospheres 123: 9391–9409. doi:https://doi.org/10.1029/2017JD028200.
- Coucheney, E., H. Eckersten, H. Hoffmann, P. E. Jansson, T. Gaiser, F. Ewert, and E. Lewan. 2018. “Key Functional Soil Types Explain Data Aggregation Effects on Simulated Yield, Soil Carbon, Drainage and Nitrogen Leaching at a Regional Scale.” Geoderma 318: 167–181. doi:https://doi.org/10.1016/j.geoderma.2017.11.025.
- Davidson, E. A., and I. A. Janssens. 2006. “Temperature Sensitivity of Soil Carbon Decomposition and Feedbacks to Climate Change.” Nature 440: 165–173. doi:https://doi.org/10.1038/nature04514.
- DeJonge, K. C., J. C. Ascough, A. A. Andales, N. C. Hansen, L. A. Garcia, and M. Arabi. 2012. “Improving Evapotranspiration Simulations in the CERES-Maize Model Under Limited Irrigation.” Agricultural Water Management 115: 92–103. doi:https://doi.org/10.1016/j.agwat.2012.08.013.
- Delerce, S., H. Dorado, A. Grillon, M. C. Rebolledo, S. D. Prager, V. H. Patiño, G. G. Varón, and D. Jiménez. 2016. “Assessing Weather-Yield Relationships in Rice at Local Scale Using Data Mining Approaches.” PLoS ONE 11: e0161620. doi:https://doi.org/10.1371/journal.pone.0161620.
- Dobor, L., Z. Barcza, T. Hlásny, Á Havasi, F. Horváth, P. Ittzés, and J. Bartholy. 2014. “Bridging the gap Between Climate Models and Impact Studies: The FORESEE Database.” Geoscience Data Journal 2: 1–11. doi:https://doi.org/10.1002/gdj3.22.
- EEA. 2021. “Co ORdinated INformation on the Environment (CORINE) Land Cover 2012, Version 18.4. European Commission - Directorate-General for Internal Market, Industry, Entrepreneurship and SMEs (DG-GROW, data owner).” European Environment Agency (EEA, data custodian). Accessed February 17, 2021. URL: http://land.copernicus.eu/pan-european/corine-land-cover/clc-2012.
- Estes, L. D., B. A. Bradley, H. Beukes, D. G. Hole, M. Lau, M. G. Oppenheimer, R. Schulze, M. A. Tadross, and W. R. Turner. 2013. “Comparing Mechanistic and Empirical Model Projections of Crop Suitability and Productivity: Implications for Ecological Forecasting.” Global Ecology and Biogeography 22 (8): 1007–1018. doi:https://doi.org/10.1111/geb.12034.
- EuroStat. 2021. NUTS - Nomenclature of territorial units for statistics. Accessed January 9, 2021. https://ec.europa.eu/eurostat/web/nuts/background.
- Fantini, A., F. Raffaele, Cs. Torma, S. Bacer, E. Coppola, and F. Giorgi. 2016. “Assessment of Multiple Daily Precipitation Statistics in ERA-Interim Driven Med-CORDEX and EURO-TCORDEX Experiments Against High Resolution Observations.” Climate Dynamics 51 (3): 877–900. doi:https://doi.org/10.1007/s00382-016-3453-4.
- Farquhar, G. D., S. von Caemmerer, and J. A. Berry. 1980. “A Biochemical Model of Photosynthetic CO2 Assimilation in Leaves of C3 Species.” Planta 149: 78–90. doi:https://doi.org/10.1007/BF00386231.
- Fodor, N., A. Challinor, I. Droutsas, J. Ramirez-Villegas, F. Zabel, A.-K. Koehler, and C. H. Foyer. 2017. “Integrating Plant Science and Crop Modeling: Assessment of the Impact of Climate Change on Soybean and Maize Production.” Plant and Cell Physiology 58 (11): 1833–1847. doi:https://doi.org/10.1093/pcp/pcx141.
- Fodor, N., L. Pásztor, and T. Németh. 2014. “Coupling the 4M Crop Model with National geo-Databases for Assessing the Effects of Climate Change on Agro-Ecological Characteristics of Hungary.” International Journal of Digital Earth 7 (5): 391–410. doi:https://doi.org/10.1080/17538947.2012.689998.
- Folberth, C., R. Skalský, E. Moltchanova, J. Balkovič, L. B. Azevedo, M. Obersteiner, and M. van der Velde. 2016. “”Uncertainty in Soil Data Can Outweigh Climate Impact Signals in Global Crop Yield Simulations.” Nature Communications 7: 11872. doi:https://doi.org/10.1038/ncomms11872.
- Franke, J., C. Müller, J. Elliott, A. C. Ruane, J. Jagermeyr, J. Balkovic, P. Ciais, et al. 2020. “The GGCMI Phase II Experiment: Global Gridded Crop Model Simulations Under Uniform Changes in CO2, Temperature, Water, and Nitrogen Levels (Protocol Version 1.0).” Geoscientific Model Development 13: 2315–2336. doi:https://doi.org/10.5194/gmd-13-2315-2020.
- Grosz, B., R. Dechow, S. Gebbert, H. Hoffmann, G. Zhao, J. Constantin, H. Raynal, et al. 2017. “The Implication of Input Data Aggregation on up-Scaling Soil Organic Carbon Changes.” Environmental Modelling & Software 96: 361–377. doi:https://doi.org/10.1016/j.envsoft.2017.06.046.
- HCSO. 2021. Hungarian Central Statistical Office, harvested area of main crops in Hungary. Accessed February 17, 2021. https://www.ksh.hu/docs/hun/xstadat/xstadat_eves/i_omn007a.html.
- Hengl, T., J. Mendes de Jesus, G. B. M. Heuvelink, M. Ruiperez Gonzalez, M. Kilibarda, A. Blagotić, W. Shangguan, et al. 2017. “Soil Grids 250m: Global Gridded Soil Information Based on Machine Learning.” PLoS ONE 12 (2). doi:https://doi.org/10.1371/journal.pone.0169748.
- Hersbach, H., W. Bell, P. Berrisford, A. Horányi, J. M. Sabater, J. Nicolas, R. Radu, et al. 2019. “Global Reanalysis: Goodbye ERA-Interim, Hello ERA5.” ECMWF Newsletter 159: 17–24. doi:https://doi.org/10.21957/vf291hehd7.
- Hidy, D., Z. Barcza, H. Marjanović, M. Z. Ostrogović Sever, L. Dobor, Gy. Gelybó, N. Fodor, et al. 2016. “Terrestrial Ecosystem Process Model Biome-BGCMuSo v4.0: Summary of Improvements and new Modeling Possibilities.” Geoscientific Model Development 9: 4405–4437. doi:https://doi.org/10.5194/gmd-9-4405-2016.
- Hoffmann, H., G. Zhao, L. van Bussel, A. Enders, X. Specka, C. Sosa, J. Yeluripati, et al. 2015. “”Variability of Effects of Spatial Climate Data Aggregation on Regional Yield Simulation by Crop Models.” Climate Research 65: 53–69. DOI: https://doi.org/10.3354/cr01326.
- Howell, T. A., and S. R. Evett. 2004. “The Penman-Monteith method.” in Evapotranspiration: Determination of Consumptive Use in Water Rights Proceedings. Continuing Legal Education in Colorado, Inc. Denver, CO.
- Hussain, J., T. Khaliq, A. Ahmad, and J. Akhtar. 2018. “Performance of Four Crop Model for Simulations of Wheat Phenology, Leaf Growth, Biomass and Yield Across Planting Dates.” PLOS ONE 13 (6). doi:https://doi.org/10.1371/journal.pone.0197546.
- Jégo, G., G. Bélanger, G. F. Tremblay, Q. Jing, and V. S. Baron. 2013. “Calibration and Performance Evaluation of the STICS Crop Model for Simulating Timothy Growth and Nutritive Value.” Field Crops Research 151: 65–77. doi:https://doi.org/10.1016/j.fcr.2013.07.003.
- Jones, J. W., J. M. Antle, B. Basso, K. J. Boote, R. T. Conant, I. Foster, H. C. J. Godfray, et al. 2017. “Brief History of Agricultural Systems Modelling.” Agricultural Systems 155: 240–254. doi:https://doi.org/10.1016/j.agsy.2016.05.014.
- Jones, J. W., G. Hoogenboom, C. H. Porter, K. J. Boote, W. D. Batchelor, L. A. Hunt, P. W. Wilkens, U. Singh, A. J. Gijsman, and J. T. Ritchie. 2003. “The DSSAT Cropping System Model.” European Journal of Agronomy 18 (3–4): 235–265. doi:https://doi.org/10.1016/S1161-0301(02)00107-7.
- Keating, B. A., P. S. Carberry, G. L. Hammer, M. E. Probert, M. J. Robertson, D. Holzworth, N. I. Huth, et al. 2003. “An Overview of APSIM, a Model Designed for Farming Systems Simulation.” European Journal of Agronomy 18 (3–4): 267–288. doi:https://doi.org/10.1016/S1161-0301(02)00108-9.
- Kern, A., H. Marjanović, and Z. Barcza. 2016. “Evaluation of the Quality of NDVI3 g Dataset Against Collection 6 MODIS NDVI in Central-Europe Between 2000 and 2013.” Remote Sensing 8 (11): 955. doi:https://doi.org/10.3390/rs8110955.
- Kersebaum, K. 2007. “Modelling Nitrogen Dynamics in Soil-Crop Systems with HERMES.” Nutrient Cycling in Agroecosystems 77: 39–52. doi:https://doi.org/10.1007/s10705-006-9044-8.
- Li, Z. T., J. Y. Yang, C. F. Drury, and G. Hoogenboom. 2015. “Evaluation of the DSSAT-CSM for Simulating Yield and Soil Organic C and N of a Long-Term Maize and Wheat Rotation Experiment in the Loess Plateau of Northwestern China.” Agricultural Systems 135: 90–104. doi:https://doi.org/10.1016/j.agsy.2014.12.006.
- Lin, L. I.-K. 1989. “A Concordance Correlation Coefficient to Evaluate Reproducibility.” Biometrics 45: 255–268.
- Liu, Hai-long, Jing-yi Yang, H. E. Ping, You-lu Bai, Ji-yun Jin, C. F. Drury, Ye-ping Zhu, et al. 2012. “Optimizing Parameters of CSM-CERES-Maize Model to Improve Simulation Performance of Maize Growth and Nitrogen Uptake in Northeast China.” Journal of Integrative Agriculture 11 (11): 1898–1913. doi:https://doi.org/10.1016/S2095-3119(12)60196-8.
- Maharjan, G. R., H. Hoffmann, H. Webber, A. K. Srivastava, L. Weihermüller, A. Villa, E. Coucheney, et al. 2019. “Effects of Input Data Aggregation on Simulated Crop Yields in Temperate and Mediterranean Climates.” European Journal of Agronomy 103: 32–46. doi:https://doi.org/10.1016/j.eja.2018.11.001.
- Makó, A., B. Tóth, H. Hernádi, Cs. Farkas, and P. Marth. 2010. “Introduction of the Hungarian Detailed Soil Hydrophysical Database (MARTHA) and its use to Test External Pedotransfer Functions.” Agrokémia és Talajtan 59 (1): 29–38. doi:https://doi.org/10.1556/agrokem.59.2010.1.4.
- Marjanović, H., G. Alberti, J. Balogh, Sz. Czóbel, L. Horváth, A. Jagodics, Z. Nagy, M.Z. Ostrogović, A. Peressotti, and E. Führer. 2010. “Measurements and Estimations of Biosphere-Atmosphere Exchange of Greenhouse Gases — Forests.” In Atmospheric Greenhouse Gases: The Hungarian Perspective, edited by László Haszpra, 121–156. Dordrecht: Springer. ISBN 978-90-481-9949-5, e-ISBN 978-90-481-9950-1, doi:https://doi.org/10.1007/978-90-481-9950-1
- METER Group. 2021. Canopy interception and leaf are index, accurate canopy analysis in real time. Accessed January 7, 2021. https://www.metergroup.com/environment/products/accupar-lp-80-leaf-area-index/.
- Müller, C., J. Elliott, D. Kelly, A. Arneth, J. Balkovic, P. Ciais, D. Deryngal, et al. 2019. “The Global Gridded Crop Model Intercomparison Phase 1 Simulation Dataset.” Scientific Data 6: 50. doi:https://doi.org/10.1038/s41597-019-0023-8.
- Nagy, Z., Z. Barcza, L. Horváth, J. Balogh, A. Hagyó, N. Káposztás, B. Grosz, A. Machon, and K. Pintér. 2010. “Measurements and Estimations of Biosphere-Atmosphere Exchange of Greenhouse Gases — Grasslands.” In Atmospheric Greenhouse Gases: The Hungarian Perspective, edited by László Haszpra, 91–119. Springer: Dordrecht. ISBN 978-90-481-9949-5, e-ISBN 978-90-481-9950-1, doi:https://doi.org/10.1007/978-90-481-9950-1
- Nendel, C., M. Berg, K. C. Kersebaum, W. Mirschel, X. Specka, M. Wegehenkel, K. O. Wenkel, and R. Wieland. 2011. “The MONICA Model: Testing Predictability for Crop Growth, Soil Moisture and Nitrogen Dynamics.” Ecological Modelling 222 (9): 1614–1625. doi:https://doi.org/10.1016/j.ecolmodel.2011.02.018.
- Ojeda, J. J., E. E. Rezaei, T. A. Remenyi, M. A. Webb, H. A. Webber, B. Kamali, R. M. B. Harris, et al. 2020. “Effects of Soil-and Climate Data Aggregation on Simulated Potato Yield and Irrigation Water Requirement.” Science of the Total Environment 710: 135589. doi:https://doi.org/10.1016/j.scitotenv.2019.135589.
- Ojeda, J. J., E. E. Rezaei, T. A. Remenyi, H. A. Webber, S. Siebert, H. Meinke, M. A. Webb, et al. 2021. “Implications of Data Aggregation Method on Crop Model Outputs–The Case of Irrigated Potato Systems in Tasmania, Australia.” European Journal of Agronomy 126: 126276. doi:https://doi.org/10.1016/j.eja.2021.126276.
- Ojeda, J. J., J. J. Volenec, S. M. Brouder, O. P. Caviglia, and M. G. Agnusdei. 2018. “Modelling Stover and Grain Yields, and Subsurface Artificial Drainage from Long-Term Corn Rotations Using APSIM.” Agricultural Water Management 195: 154–171. doi:https://doi.org/10.1016/j.agwat.2017.10.010.
- Olesen, J. E., M. Trnka, K. C. Kersebaum, A. O. Skjelva°g, B. Seguin, P. Peltonen-Sainio, F. Rossi, J. Kozyra, and F. Micale. 2011. “Impacts and Adaptation of European Crop Production Systems to Climate Change.” European Journal of Agronomy 34: 96–112. doi:https://doi.org/10.1016/j.eja.2010.11.003.
- Ónodi, G., Z. Botta-Dukát, G. Kröel-Dulay, E. Lellei-Kovács, and M. Kertész. 2018. “Reduction in Primary Production Followed by Rapid Recovery of Plant Biomass in Response to Repeated mid-Season Droughts in a Semiarid Shrubland.” Plant Ecology 219: 517–526. doi:https://doi.org/10.1007/s11258-018-0814-6.
- Pásztor, L., A. Laborczi, K. Takács, G. Illés, J. Szabó, and G. Szatmári. 2020. “Progress in the Elaboration of GSM Conform DSM Products and Their Functional Utilization in Hungary.” Geoderma Regional 21. ISSN 2352-0094. doi:https://doi.org/10.1016/j.geodrs.2020.e00269
- Pokovai, K., and N. Fodor. 2019. “Adjusting Ceptometer Data to Improve Leaf Area Index Measurements.” Agronomy 9 (12): 866. doi:https://doi.org/10.3390/agronomy9120866.
- Prescher, A. K., T. Grünwald, and C. Bernhofer. 2010. “Land use Regulates Carbon Budgets in Eastern Germany: From NEE to NBP.” Agricultural and Forest Meteorology 150 (7–8): 1016–1025. doi:https://doi.org/10.1016/j.agrformet.2010.03.008.
- Ratliff, L. F., J. T. Ritchie, and D. K. Cassel. 1983. “Field-measured Limits of Soil Water Availability as Related to Laboratory Measured Properties.” Soil Science Society of America Journal 47: 770–775. doi:https://doi.org/10.2136/sssaj1983.03615995004700040032x.
- Ritchie, J. T. 1972. “Model for Predicting Evaporation from a row Crop with Incomplete Cover.” Water Resources Research 8 (5): 1204–1213. doi:https://doi.org/10.1029/WR008i005p01204.
- Ritchie, J. T. 1985. “A User-Orientated Model of the Soil Water Balance in Wheat.” In Wheat Growth and Modelling, edited by W. Day and R.K. Atkin. NATO ASI Science (Series A: Life Sciences), 86. Boston, MA: Springer. doi:https://doi.org/10.1007/978-1-4899-3665-3_27
- Ritchie, J. T., A. Gerakis, and A. Suleiman. 1999. “Simple Model to Estimate Field-Measured Soil Water Limits.” Transactions of the ASABE 42: 1609–1614.
- Sándor, R., Z. Barcza, M. Acutis, L. Doro, D. Hidy, M. Köchy, J. Minet, et al. 2017. “Multi-model Simulation of Soil Temperature, Soil Water Content and Biomass in Euro-Mediterranean Grasslands: Uncertainties and Ensemble Performance.” European Journal of Agronomy 88: 22–40. doi:https://doi.org/10.1016/j.eja.2016.06.006.
- Sándor, R., and N. Fodor. 2012. “Simulation of Soil Temperature Dynamics with Models Using Different Concepts.” The Scientific World Journal. doi:https://doi.org/10.1100/2012/590287.
- Shelia, V., J. Hansen, V. Sharda, C. Porter, P. Aggarwal, C. J. Wilkerson, and G. Hoogenboom. 2019. “A Multi-Scale and Multi-Model Gridded Framework for Forecasting Crop Production, Risk Analysis, and Climate Change Impact Studies.” Environmental Modelling & Software 115: 144–154. doi:https://doi.org/10.1016/j.envsoft.2019.02.006.
- Smith, B., I. C. Prentice, and M. T. Sykes. 2001. “Representation of Vegetation Dynamics in the Modelling of Terrestrial Ecosystems: Comparing two Contrasting Approaches Within European Climate Space.” Global Ecology and Biogeography 10: 621–637. doi:https://doi.org/10.1046/j.1466-822X.2001.t01-1-00256.x.
- Sommer, R., K. Kienzler, C. Conrad, N. Ibragimov, J. Lamers, C. Martius, and P. Vlek. 2008. “Evaluation of the CropSyst Model for Simulating the Potential Yield of Cotton.” Agronomy for Sustainable Development 28: 345–354. doi:https://doi.org/10.1051/agro:2008008.
- Soufizadeh, S., E. Munaro, G. McLean, A. Massignam, E. J. van Oosterom, S. C. Chapman, C. Messina, M. Cooper, and G. L. Hammer. 2018. “Modelling the Nitrogen Dynamics of Maize Crops – Enhancing the APSIM Maize Model.” European Journal of Agronomy 100: 118–131. doi:https://doi.org/10.1016/j.eja.2017.12.007.
- Spinoni, J., S. Szalai, T. Szentimrey, M. Lakatos, Z. Bihari, A. Nagy, Á Németh, et al. 2015. “Climate of the Carpathian Region in the Period 1961-2010: Climatologies and Trends of 10 Variables.” International Journal of Climatology 35 (7): 1322–1341. doi:https://doi.org/10.1002/joc.4059.
- Stöckle, C. O., M. Donatelli, and R. Nelson. 2003. “CropSyst, a Cropping Systems Simulation Model.” European Journal of Agronomy 18 (3–4): 289–307. doi:https://doi.org/10.1016/S1161-0301(02)00109-0.
- Stöckle, C. O., and R. Nelson. 2013. “Cropping Systems Simulation Model User’s Manual.” Accessed October 12, 2020. https://nishat2013.files.wordpress.com/2013/11/cropping-system-manual-book.pdf.
- Suleiman, A. A., and J. T. Ritchie. 2001. “Estimating Saturated Hydraulic Conductivity from Soil Porosity.” Transactions of the ASAE 44 (2): 235–339. doi:https://doi.org/10.13031/2013.4683.
- Szabó, B., G. Szatmári, K. Takács, A. Laborczi, A. Makó, K. Rajkai, and L. Pásztor. 2019. “Mapping Soil Hydraulic Properties Using Random-Forest-Based Pedotransfer Functions and Geostatistics.” Hydrology and Earth System Science 23: 2615–2635.
- Szentimrey, T. 2007.. “Manual of homogenization software MASHv3.02.” Hungarian Meteorological Service, Budapest. 65p.
- Szentimrey, T., and Z. Bihari. 2006. “MISH (Meteorological Interpolation based on Surface Homogenized Data Basis).” In: COST Action 719 Final Report, The use of GIS in climatology and meteorology. Eds: O.E.Tveito, M.Wegehenkel, F. van der Wel and H. Dobesch, 54-56.
- Tanács, E., M. Belényesi, R. Lehoczki, R. Pataki, O. Petrik, T. Standovár, L. Pásztor, et al. 2019. “Országos, nagyfelbontású ökoszisztéma- alaptérkép: módszertan, validáció és felhasználási lehetőségek (In Hungarian).” Természetvédelmi Közlöny 25: 34–58. ISSN 1216-4585.
- Tao, F., R. P. Rotter, T. Palosuo, C. G. H. Diaz-Ambrona, M. I. Minguez, M. A. Semenov, K. C. Kersebaum, et al. 2018. “Contribution of Crop Model Structure, Parameters and Climate Projections to Uncertainty in Climate Change Impact Assessments.” Global Change Biology 24 (3): 1291–1307. doi:https://doi.org/10.1111/gcb.14019.
- Thornton, P. E., H. Hasenauer, and M. A. White. 2000. “Simultaneous Estimation of Daily Solar Radiation and Humidity from Observed Temperature and Precipitation: an Application Over Complex Terrain in Austria.” Agricultural and Forest Meteorology 104 (4): 255–271. doi:https://doi.org/10.1016/S0168-1923(00)00170-2.
- Tóth, B., M. Weynants, A. Nemes, A. Makó, G. Bilas, and G. Tóth. 2015. “New Generation of Hydraulic Pedotransfer Functions for Europe.” European Journal of Soil Science 66: 226–238. doi:https://doi.org/10.1111/ejss.12192.
- Tóth, B., M. Weynants, L. Pásztor, and T. Hengl. 2017. “3D Soil Hydraulic Database of Europe at 250 m Resolution.” Hydrological Processes 31: 2662–2666. doi:https://doi.org/10.1002/hyp.11203.
- Valkama, E., G. Kunypiyaeva, R. Zhapayev, M. Karabayev, E. Zhusupbekov, A. Perego, C. Schillaci, et al. 2020. “Can Conservation Agriculture Increase Soil Carbon Sequestration? A Modelling Approach.” Geoderma 369: 114298. doi:10.1016/j.geoderma.2020.114298.
- Verburg, K., and W. J. Bond. 2003. Use of APSIM to simulate water balances of dryland farming systems in south eastern Australia. Technical Report 50/03. CSIRO Land and Water, Canberra, Australia ISSN 1446-6163.
- Waha, K., N. Huth, P. Carberry, and E. Wang. 2015. “How Model and Input Uncertainty Impact Maize Yield Simulations in West Africa.” Environmental Research Letters 10), doi:https://doi.org/10.1088/1748-9326/10/2/024017.
- Webber, H., F. Ewert, J. E. Olesen, C. Müller, S. Fronzek, A. C. Ruane, M. Bourgault, et al. 2018. “Diverging Importance of Drought Stress for Maize and Winter Wheat in Europe.” Nature Communications 9. doi:https://doi.org/10.1038/s41467-018-06525-2.
- Weynants, M., G. Tóth, P. Strauss, F. Feichtinger, W. Cornelis, M. Javaux, S. Matula, et al. 2013. European HYdropedological Data Inventory (EU-HYDI). European Comission JRC Technical Reports. Institute for Environment and Sustainability. doi:https://doi.org/10.2788/5936.
- White, M. A., P. E. Thornton, S. W. Running, and R. R. Nemani. 2000. “Parameterization and Sensitivity Analysis of the Biome-BGC Terrestrial Ecosystem Model: net Primary Production Controls.” Earth Interactions 4: 1–85. doi:https://doi.org/10.1175/1087-3562(2000)004<0003:PASAOT>2.0.CO;2.
- Willmott, C. J., and K. Matsuura. 2005. “Advantages of the Mean Absolute Error (MAE) Over the Root Mean Square Error (RMSE) in Assessing Average Model Performance.” Climate Research 30: 79–82. doi:https://doi.org/10.3354/cr030079.
- Zhao, G., H. Hoffmann, L. G. J. van Bussel, A. Enders, X. Specka, C. Sosa, J. Yeluripati, et al. 2015. ““Effect of Weather Data Aggregation on Regional Crop Simulation for Different Crops, Production Conditions, and Response Variables.” Climate Research 65: 141–157. DOI: https://doi.org/10.3354/cr01301.