
 ?Mathematical formulae have been encoded as MathML and are displayed in this HTML version using MathJax in order to improve their display. Uncheck the box to turn MathJax off. This feature requires Javascript. Click on a formula to zoom.
ABSTRACT
The ecological vulnerability of global protected areas (PAs) is linked to the 2030 United Nations Sustainable Development Goals. We developed a novel degree of ecological vulnerability (DEV) index based on Big Earth Data to assess the ecological vulnerability of PAs. This is a transparent, repeatable, large-scale and rapid assessment method. We applied the method to case studies of International Union for Conservation of Nature (IUCN) PAs in the basins of the Aral Sea, the Caspian Sea, the Black Sea and the Lake Baikal. Between 2001 and 2015, the spatial pattern of ecological vulnerability in the study area was relatively stable. The Caspian Sea basin and protected landscape/seascape (category V) showed high ecological vulnerability, while the Black Sea basin and wilderness areas (category Ib) showed low ecological vulnerability. Big Earth Data shows great vitality in PAs ecological vulnerability assessment. Strengthening international cooperation is an important means to break the bottleneck of ecological environment and resource endowment in these important international basins.
1. Introduction
Global biodiversity is declining faster than at any time in human history, which has serious implications for human wellbeing (Pimm et al. Citation2014; Pimm, Jenkins, and Li Citation2018; Di Marco et al. Citation2019; Dinerstein et al. Citation2019). Aichi target 11 sets a goal of achieving a global area of 17% terrestrial PA coverage and 10% marine PA coverage by 2020 (Visconti et al. Citation2019; Leendertz and Kalema-Zikusoka Citation2021). However, the ongoing global assessments indicated that the vast majority of these targets have not been met, and the situation of some targets has worsened (Butchart, Di Marco, and Watson Citation2016; Venter et al. Citation2018; Santini et al. Citation2019; Woodley et al. Citation2019; Maxwell et al. Citation2020). The post-2020 global target for PAs will be discussed at the 15th meeting of the Biodiversity Convention in 2021 in China (Yang et al. Citation2020; UNEP Citation2020), and there are suggestions that we need a ‘Global Safety Net’ to reverse biodiversity loss and stabilize the Earth’s climate (Dinerstein et al. Citation2020; Hanson et al. Citation2020). Assessing PA effectiveness is remarkably challenging, whereas there is overwhelming evidence that the means currently allocated to PAs are insufficient, it remains unclear the extent to which these conservation tools are already contributing to the long-term conservation of nature, individually as well as globally (IUCN Citation2018; Loiseau et al. Citation2020; Rodrigues and Cazalis Citation2020; Xu et al. Citation2020).
Ecological vulnerability is a topic of growing concern and interest in the field of global environmental change and sustainable development research (Jiang et al. Citation2018; Xu et al. Citation2016). In the past decade, several approaches and methods have been proposed to quantitatively evaluate ecological vulnerability (Fuentes, Limpus, and Hamann Citation2011; Zhang et al. Citation2017; Thiault et al. Citation2018). Although these methods differ slightly depending on the target of the application, almost all consider the same key parameters: sensitivity, exposure and adaptive capacity (McCarthy et al. Citation2001; Cuevas, Liceaga-Correa, and Uribe-Martínez Citation2019). The published methods have employed different quantitative techniques, taking into account the fact that evaluation indexes cannot reflect the quality of the ecosystem in a linear way, both with and without explicit spatial modules (Holling Citation1973; Hong et al. Citation2016). As a transparent, repeatable, large scale and rapid method, Big Earth Data may provide the methodologies to generate essential knowledge from diverse and complex data sources to ensure a sustainable human society that is essential for the preservation of the planet (Stephenson et al. Citation2017; Guo Citation2018; Guo et al. Citation2020; Zheng et al. Citation2012; Zheng Citation2020). Given the definition of ecological vulnerability (Turner et al. Citation2003), the conceptual model of vulnerability reflects the degree of sensitivity, exposure and adaptive capacity involving intrinsic and extrinsic factors (Nillson and Grelsson Citation1995).
Here, we developed an ecological vulnerability assessment tool for PAs based on Big Earth Data. The approach was applied to case studies of IUCN PAs in the basins of the Aral Sea, the Caspian Sea, the Black Sea and the Lake Baikal (Three Seas and One Lake, TSOL) (). The TSOL region has attracted the attention of the international community, because of a variety of crisis from ecological environment or resource development. For example, the severe shrinkage of the Aral Sea and water resources coordination issues in the upstream and downstream regions lead to the serious ecological crisis in the basin of Aral Sea (Wu et al. Citation2020). As the largest lake in the world, the Caspian Sea is located at the junction of Eurasia and has a large number of oil and gas resources transformed from marine sediments (Konyushkova et al. Citation2021; Pamucar et al. Citation2021). The Black Sea is a large and anoxic marine system, which is faced with the problem of huge environmental pollution, and the Black Sea Strait is also an important navigation route connecting Europe, Asia, the Black Sea and the Mediterranean Sea (Karsli Citation2021; Pojar et al. Citation2021). The reserve and quality of fresh water resources of the Lake Baikal is second to none in the world, and its basin is facing huge ecological risks brought by the development of mineral and forest resources (Brown et al. Citation2021; Swann et al. Citation2020).
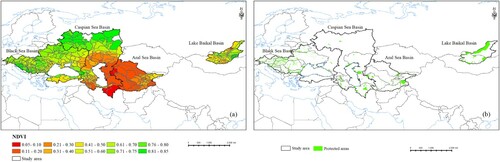
Figure 1. The normalized difference vegetation index (NDVI) of the study area and the distribution of protected areas.
2. Study area and datasets
2.1. Study area
The study area spans multiple climatic zones including the tropics, subtropics, warm temperate, and cold temperate zones (). The study area is of international concern because it covers a large area, with multiple land cover types and a wide disparity in national economic levels and cultures. For example, the Aral Sea used to be the fourth largest lake in the world (Bekchanov, Ringler, and Bhaduri Citation2018), but uncontrolled water intake led to a sharp reduction of more than 90% of the lake area, and soil salinization led to ecosystem damage.
2.2. Datastes
The remote sensing data used in this study were obtained from MOD13A3 and MCD12Q1 (resolution of 1 km and 500 m, respectively), Operational Linescan System nighttime light images (1 km resolution), and the products of ASMR2/ASMRE Soil Moisture (25 km resolution). The NASA Shuttle Radar Topographic Mission (SRTM v4.1, 90 m resolution) provided digital elevation data (DEMs). The precipitation data were from the CRU TS v. 4.01 dataset at 0.5° resolution, which was released on 20 September 2017. The data details are listed in .
Table 1. Basic information of the products in the paper.
3. Methods
3.1. Calculation of the ecological vulnerability
Many scholars have studied ecological vulnerability from the perspectives of exposure, sensitivity and adaptability (Kling et al. Citation2020; Mumby et al. Citation2014; Nguyen et al. Citation2016; White Citation1974). This study used the advantages of Big Earth Data (Guo Citation2018; Guo et al. Citation2020; Wang et al. Citation2019), developed and enriched the meaning, contents and methods of calculating exposure, sensitivity and adaptability, and quantitatively expressed the spatial–temporal distribution characteristics and patterns of ecological vulnerability. Based on the analytic hierarchy process (AHP) and experts mark, this paper established the index evaluation system according to the specific situation of ecological vulnerability ().
Table 2. The evaluation index system for ecological vulnerability.
Combining remote sensing (RS) data and geographic information systems (GIS) technology, this paper assessed the EVI (Ecological Vulnerability Index) from 2001 to 2015 and explained the variations of the EVI by various data. The details of the EVI system are listed in .
3.2. Standardized calculation and multi-criteria evaluation
The values of each indicator were standardized to reflect the positive/negative contribution of each variable towards the objective function. In the case of positive contributions to ecological vulnerability, the original Xi values were converted into a range of F(max) values from 0 to 1, according to the following formula (Wu et al. Citation2020):
(1)
(1) where F(max) are the normalized data, Xi are the data to be normalized, Xmin is the minimum value assumed by the variables and Xmax is the maximum value.
In contrast, a negative contribution to ecological vulnerability was calculated using the following formula, where the variables have the same meaning as Equation (1).
(2)
(2)
Finally, the EVI was given by the sum of the standardized values as described by the following formula:
(3)
(3) where n is the number of variables, and Wj is the weight associated to the jth elementary criterion with i=1 and 0≤Wj≤1.
3.3. Classification of the degree of ecological vulnerability
Synthesis maps of DEV were produced and classified as serious, high, medium, low or normal based on the natural interval classification method (Nguyen et al. Citation2016). The details of the classification of DEV were shown in .
Table 3. The classification and grading of degree of ecological vulnerability compared with the ecological vulnerability index.
4. Results
4.1. Distribution of PAs within the TSOL region
There were 5, 296 PAs in the TSOL region, with a total area of 5.47×10⁵ km2, representing 10.28% of the total land area of the basins (). The PAs in the Lake Baikal basin (23.55%) covered the largest area, followed by the Black Sea basin (8.24%). The PAs in the Aral Sea basin and the Caspian Sea basin covered relatively less area, at 5.57% and 3.74%, respectively. In terms of the numbers of PAs, the Black Sea basin had the highest percentage, accounting for 95.11% of the total number. However, the PAs in the Black Sea basin were relatively small with an average size of 39.94 km2. The PAs in Lake Baikal basin were the largest on average (4370.97 km2), followed by the Aral Sea basin (1089.02 km2) and then the Caspian Sea basin (828.77 km2).
Table 4. Numbers and area of protected areas (PAs) in the TSOL region.
4.2. Biodiversity important places (BIPs) within the TSOL region
shows the distribution of BIPs, which were created by combining KBAs, endemic bird areas (EBAs), intact forest landscapes (IFLs), global 200 ecoregions (G200), and the global lakes and wetlands database (GLWD) (Davis et al. Citation1997; Eken et al. Citation2004; Olson and Dinerstein Citation2002; Stattersfield et al. Citation1998; Potapov et al. Citation2008; Zheng et al. Citation2015). The BIPs within the TSOL region covered an area of 3.61 million km2, accounting for 51.05% of the total area.
Figure 2. The distribution of biodiversity important places (BIPs) inside and outside protected areas by overlaying key biodiversity areas (KBAs), endemic bird areas (EBAs), intact forest landscapes (IFLs), global 200 ecoregions (G200) and the global lakes and wetlands database (GLWD).
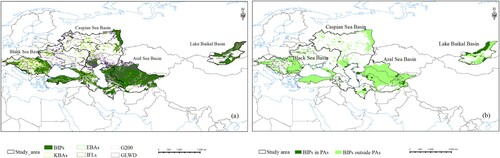
In these basins, the BIPs covered the greatest area in the Aral Sea basin (78.63%), followed by the Lake Baikal basin (53.39%), the Black Sea basin (37.28%) and the Caspian Sea basin (34.91%). Of these BIPs, 15.79% were within PAs with a total area of 3.73×10⁵ km2. The Lake Baikal basin had the highest coverage (38.65%), followed by the Black Sea basin (12.73%), the Caspian Sea basin (7.51%) and the Aral Sea basin (4.26%) ().
Table 5. The area and ratio of biodiversity important places (BIPs) in the different basins.
4.3. DEV within the TSOL region
The DEV of the TSOL region ranged from −0.13 to −0.69 and showed spatial stability with some minor volatility during 2001 and 2015 (). The DEV of the Aral Sea basin was relatively low in the upper reaches and increased in the middle and lower reaches of the river.
Figure 3. Degree of ecological vulnerability within the TSOL region from 2001 to 2015.
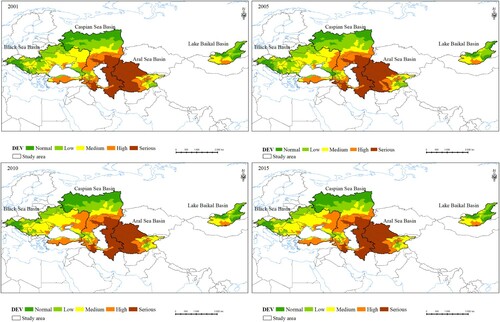
For the Lake Baikal basin, the most ecologically vulnerable areas were mainly in the south, while regions with lower levels of vulnerability were concentrated in the east and north. The Black Sea basin and the Caspian Sea basin both showed a gradual increase in vulnerability from north to south and from west to east. The ecological condition in the sandy plain areas of the southern Black Sea basin and the flatlands in the eastern Caspian Sea basin was highly vulnerable. The vulnerability fluctuations in the Aral Sea basin were mainly concentrated in the central and western regions, while the vulnerability fluctuations in the Aral Sea basin were mainly concentrated in the southern part of the region.
4.4. DEV inside and outside the BIPs
In 2015, the DEV of the BIPs was generally at a medium level, with the highest vulnerability in the Aral Sea basin, and lowest in the Black Sea and Lake Baikal basins. There was a high DEV in the PAs in the Caspian Sea basin, and it was higher than that outside the PAs. In contrast, the DEV in the Aral Sea basin was high outside the BIPs. The high vulnerability areas require special attention to enhance ecological restoration (). From 2001 to 2015, the DEV of the BIPs remained steady, and usually DEV outside the BIPs was higher than that inside the BIPs. In 2015, DEV inside and outside the BIPs began to level off. In the Black Sea basin, the DEV of the BIPs showed a trend of improvement although there were periodic fluctuations. In the Aral Sea basin, the DEV outside BIPs remained at a high level for many years, with a slight improvement in 2015.
Table 6. DEV (degree of ecological vulnerability) of BIPs (biodiversity important areas) inside and outside protected areas (PAs) among the different basins.
4.5. Spatiotemporal patterns of DEV in PAs
Overall, the DEV in PAs generally was stable at a medium level between 2001 and 2015, particularly for the major PA types such as national parks and habitat/species management areas. The DEV in a few types of PAs fluctuated ().
Figure 4. Maps of the spatiotemporal variation patterns of DEV (degree of ecological vulnerability) in PAs (protected areas) within the TSOL region from 2001 to 2015.
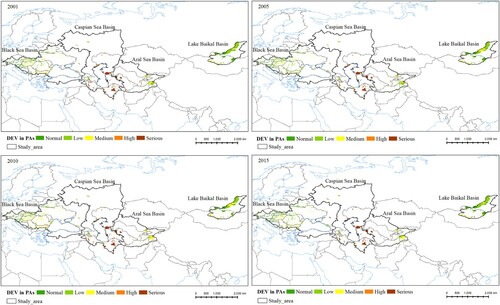
The Caspian Sea basin remained at a moderately high level and the DEV of protected landscape/seascape was medium to high. In contrast, the Black Sea basin had a moderately low DEV level, as did wilderness areas. The ecological situation as indicated by the DEV in the following categories of PAs improved: the Lake Baikal basin (Ia), the Caspian basin (V), and the Black Sea basin (III, IV, and VI). The PAs requiring additional attention included: (1) high DEV in the Caspian basin (Ia and V) and the Aral Sea basin (V); (2) medium and high DEV in the Aral Sea basin (Ia) and the Caspian Sea basin (II, III, IV and unclassified); and (3) the aggravated DEV in the Black Sea basin (Ib, V), the Aral Sea basin and the Lake Baikal basin (Unclassified) ( and ).
Table 7. Degree of ecological vulnerability in the studied protected areas (grouped by category) from 2001 to 2015. Ia: strict nature reserve, Ib: wilderness area, II: national park, III: natural monument or feature, IV: habitat/species management area, V: protected landscape/seascape, VI: protected area with sustainable use of natural resources.
5. Discussion
According to our former research results (Wu et al. Citation2020), the ecological carrying capacity (ECC) of the Aral Sea basin is getting better during 2001–2018, and the ECC of the upstream region is better than that of the downstream region. In this paper, the EVI of the Aral Sea basin is getting better during 2001–2015, and the spatiotemporal distribution law of EVI is similar to that of ECC. A water trading system can improve inflows to the Aral Sea but would require significant compensation for agricultural producers (Bekchanov, Ringler, and Bhaduri Citation2018). In the last three decades, several ecological factors were changed and affected the most important commercial fish stocks in the Caspian Sea, and the stock of the stellate sturgeon (Acipenser stellatus Pallas) was being overfished for the whole years and critically endangered (Fazli et al. Citation2021). However, the vulnerability of terrestrial protected areas in the Caspian Sea basin has improved, it was shown as that the DEV of BIPs outside terrestrial PAs has changed from high to medium in this paper.
The EVI of the Black Sea basin showed a gradual increase in vulnerability from north to south and from west to east, and the ecological condition in the sandy plain areas of the southern Black Sea basin was highly vulnerable. The result is consistent with a previous paper, which shows that the Black Sea coastline of Georgia is evaluated as the region, characterized with the highest grade of ecological vulnerability (Lagidze et al. Citation2017). In the last century, the southern Europe have been impacted by a combination of anthropogenic and climatic pressures, which have rapidly evolved to change the ecological status of freshwater and coastal systems. The southern Black Sea basin is differently impacted by anthropogenic and climatic forces and this will influence their vulnerability to future changes of flow regime and water quality (Micheli et al. Citation2013). As lakes warm worldwide (Meyer et al. Citation2017; Swann et al. Citation2018), climate change and human Interference may alter not only plankton community structure and abundance of the Lake Baikal, but also the EVI of the total ecosystem in the basin. Compared with former approaches (Konyushkova et al. Citation2021), this paper integrated the information about forests, ecological zones and wetlands. This study focused on assessing the condition and trends of PAs from the perspective of ecosystem vulnerability, and provided some support for the optimization of spatial pattern of the PA network. When PA network is discussed, the regional sustainable development should also be considered (Anderson et al. Citation2017; Diaz et al. Citation2020; Thiault et al. Citation2020).
6. Conclusion
The approach developed in this paper illustrates how to derive a more integrated understanding of the condition of linked social-ecological systems for ecological vulnerability analysis on a large scale. Strengthening international cooperation is an important means to break the bottleneck of ecological environment and resource endowment in these important international basins. Big Earth Data science shows great vitality in protected area ecological vulnerability assessment and regional sustainable development. The spatial pattern of ecological vulnerability in the TSOL region was relatively stable during 2001–2015. The Caspian Sea basin and protected landscape/seascape (category V) showed high ecological vulnerability, while the Black Sea basin and wilderness areas (category Ib) showed low ecological vulnerability. The effective measure to conserve and maintain biodiversity is to optimize the quality of PAs on the basis of ensuring the coverage of protected areas. Big Earth Data could be used to identify the priority areas for ecological restoration by quickly and accurately identifying areas of ecological vulnerability over a large scale in future.
Data and materials availability
All data needed to replicate the conclusions in the paper are presented in the paper and/or the Supplementary Materials, or the references cited. Additional data related to this paper may be requested from the authors.
Acknowledgements
We thank the anonymous reviewers for this manuscript. We also thank Leonie Seabrook, PhD, from Liwen Bianji, Edanz Group China (www.liwenbianji.cn/ac), for editing the English text of a draft of this manuscript.
Disclosure statement
No potential conflict of interest was reported by the author(s).
Additional information
Funding
References
- Anderson, K., B. Ryan, W. Sonntag, A. Kavvada, and L. Friedl. 2017. “Earth Observation in Service of the 2030 Agenda for Sustainable Development.” Geo-spatial Information Science 20 (2): 77–96. doi:https://doi.org/10.1080/10095020.2017.1333230.
- Bekchanov, M., C. Ringler, and A. Bhaduri. 2018. “A Water Rights Trading Approach to Increasing Inflows to the Aral Sea.” Land Degradation & Development 29 (4): 952–961. doi:https://doi.org/10.1002/ldr.2394.
- Brown, K. P., A. Gerber, D. Bedulina, and M. A. Timofeyev. 2021. “Human Impact and Ecosystemic Health at Lake Baikal.” Wiley Interdisciplinary Reviews-Water 5: e1528. doi:https://doi.org/10.1002/wat2.1528.
- Butchart, S. H. M., M. Di Marco, and J. E. M. Watson. 2016. “Formulating Smart Commitments on Biodiversity: Lessons from the Aichi Targets.” Conservation Letters 9 ((6)[SI]): 457–468. doi:https://doi.org/10.1111/conl.12278.
- Cuevas, E., M. D. Liceaga-Correa, and A. Uribe-Martínez. 2019. “Ecological Vulnerability of two sea Turtle Species in the Gulf of Mexico: An Integrated Spatial Approach.” Endangered Species Research 40: 337–356. doi:https://doi.org/10.3354/esr00984.
- Davis, S. D., V. H. Heywood, O. Herrera-MacBryde, J. Villa-Lobos, and A. C. Hamilton. 1997. Centres of plant diversity: A guide and strategy for their conservation (eds.). WWF and IUCN. Oxford, UK: Information Press.
- Diaz, S., J. Settele, E. Brondizio, H. T. Ngo, A. Pfaff, S. Polasky, J. Agard, A. Arneth, P. Balvanera, and K. A. Brauman. 2020. “Investments’ Role in Ecosystem Degradation Response.” Science 368 (6489): 377.2–377. doi:https://doi.org/10.1126/science.abb6019.
- Di Marco, M., S. Ferrier, T. D. Harwood, A. J. Hoskins, and J. E. M. Watson. 2019. “Wilderness Areas Halve the Extinction Risk of Terrestrial Biodiversity.” Nature 573 (7775): 582–585. doi:https://doi.org/10.1038/s41586-019-1567-7.
- Dinerstein, E., A. R. Joshi, C. Vynne, A. T. L. Lee, F. Pharand-Deschênes, M. França, S. Fernando, et al. 2020. “A ‘Global Safety Net’ to Reverse Biodiversity Loss and Stabilize Earth’s Climate.” Science Advances 6 (36): eabb2824. doi:https://doi.org/10.1126/sciadv.abb2824.
- Dinerstein, E., C. Vynne, E. Sala, A. R. Joshi, S. Fernando, T. E. Lovejoy, J. Mayorga, et al. 2019. “A Global Deal for Nature: Guiding Principles, Milestones, and Targets.” Science Advance 5 (4): 1–17. doi:https://doi.org/10.1126/sciadv.aaw2869.
- Eken, G., L. Bennun, T. M. Brooks, W. Darwall, L. D. Fishpool, M. Foster, D. Knox, et al. 2004. “Key Biodiversity Areas as Site Conservation Targets.” BioScience 54 (12): 1110–1118. doi:https://doi.org/10.1641/0006-3568(2004)054[1110:KBAASC]2.0.CO;2.
- Fazli, H., M. Tavakoli, M. R. B. Khoshghalb, and M. Moghim. 2021. “Population Dynamics of Stellate Sturgeon Acipenser Stellatus Pallas, 1771 in the Southern Caspian Sea.” Iranian Journal of Fisheries Sciences 20 (1): 45–61. doi:https://doi.org/10.22092/ijfs.2021.123469.
- Fuentes, M. M. P. B., C. J. Limpus, and M. Hamann. 2011. “Vulnerability of sea Turtle Nesting Grounds to Climate Change.” Global Change Biolology 17: 140–153. doi:https://doi.org/10.1111/j.1365-2486.2010.02192.x.
- Guo, H. D. 2018. “Steps to the Digital Silk Road.” Nature 554: 25–27. doi:https://doi.org/10.1038/d41586-018-01303-y.
- Guo, H. D., S. Nativi, D. Liang, M. Craglia, L. Z. Wang, S. Schade, C. Corban, et al. 2020. “Big Earth Data Science: An Information Framework for a Sustainable Planet.” International Journal of Digital Earth 13 (7): 743–767. doi:https://doi.org/10.1080/17538947.2020.1743785.
- Hanson, J. O., J. R. Rhodes, S. H. M. Butchart, G. M. Buchanan, M. Graeme, C. Rondinini, G. F. Ficetola, and R. A. Fuller. 2020. “Global Conservation of Species’ Niches.” Nature 580: 232–234. doi:https://doi.org/10.1038/s41586-020-2138-7.
- Holling, C. S. 1973. “Resilience and Stability of Ecological Systems.” Annual Review of Ecology and Systematics 4: 1–23. http://www.jstor.org/stable/2096802.
- Hong, W. Y., R. R. Jiang, C. Y. Yang, F. F. Zhang, M. Su, and Q. Liao. 2016. “Establishing an Ecological Vulnerability Assessment Indicator System for Spatial Recognition and Management of Ecologically Vulnerable Areas in Highly Urbanized Regions: A Case Study of Shenzhen, China.” Ecological Indicators 69: 540–547. doi:https://doi.org/10.1016/j.ecolind.2016.05.028.
- IUCN. 2018. Guidelines on Business and KBAs: Managing Risk to Biodiversity. Gland, Switzerland. doi:https://doi.org/10.2305/IUCN.CH.2018.05.en.
- Jiang, L., X. X. Huang, F. T. Wang, Y. C. Liu, and P. L. An. 2018. “Method for Evaluating Ecological Vulnerability Under Climate Change Based on Remote Sensing: A Case Study.” Ecological Indicators 85: 479–486. doi:https://doi.org/10.1016/j.ecolind.2017.10.044.
- Karsli, B. 2021. “Determination of Metal Content in Anchovy (Engraulis encrasicolus) from Turkey, Georgia and Abkhazia Coasts of the Black Sea: Evaluation of Potential Risks Associated with Human Consumption.” Marine Pollution Bulletin 165: 186–201. doi:https://doi.org/10.1016/j.marpolbul.2021.112108.
- Kling, M. M., S. L. Auer, P. J. Comer, D. D. Ackerly, and H. Hamilton. 2020. “Multiple Axes of Ecological Vulnerability to Climate Change.” Global Change Biology 26 (5): 2798–2813. doi:https://doi.org/10.1111/gcb.15008.
- Konyushkova, M., S. Alavipanah, A. Heidari, D. Kozlov, M. Yu, and I. Semenkov. 2021. “Spatial and Seasonal Salt Translocation in the Young Soils at the Coastal Plains of the Caspian Sea.” Quaternary International 590: 15–25. doi:https://doi.org/10.1016/j.quaint.2020.11.005.
- Lagidze, L., L. Matchavariani, G. Metreveli, N. Tsivtsivadze, N. Paichadze, Z. Gulashvili, and D. Svanadze. 2017. “Evaluation of Climate Parameters of Black Sea Coastline in the Background of Climate Change.” Journal of Environmental Biology 38 (5)SI): 1069–1077. doi:https://doi.org/10.22438/jeb/38/5(SI)/GM-25.
- Leendertz, F. H., and G. Kalema-Zikusoka. 2021. “Vaccinate in Biodiversity Hotspots to Protect People and Wildlife from Each Other.” Nature 591 (7850): 369–379. doi:10.1038/d41586-021-00689-6.
- Loiseau, N., N. Mouquet, N. Casajus, M. Grenie, M. Gueguen, B. Maitner, D. Mouillot, et al. 2020. “Global Distribution and Conservation Status of Ecologically Rare Mammal and Bird Species.” Nature Communications 11 (1): 221–232. doi:https://doi.org/10.1038/s41467-020-18779-w.
- Maxwell, S. L., V. Cazalis, N. Dudley, M. Hoffmann, A. S. L. Rodrigues, S. Stolton, P. Visconti, and S. et al. 2020. “Area-based Conservation in the Twenty-First Century.” Nature 586 (7828): 217–227. doi:https://doi.org/10.1038/s41586-020-2773-z.
- McCarthy, J. J., O. F. Canziani, N. A. Leary, D. J. Dokken, and K. S. White. 2001. Climate Change 2001: Impacts, Adaptation and Vulnerability. Contribution of Working Group 2 to the 3rd Assessment Report of the Intergovernmental Panel on Climate Change. Cambridge: Cambridge University Press.
- Meyer, M. F., S. E. Hampton, T. Ozersky, O. O. Rusanovskaya, and K. H. Woo. 2017. “Vulnerability of Rotifers and Copepod Nauplii to Predation by Cyclops Kolensis (Crustacea, Copepoda) Under Varying Temperatures in Lake Baikal, Siberia.” Hydrobiologia 796 (1): 309–318. doi:https://doi.org/10.1007/s10750-016-3005-2.
- Micheli, F., B. S. Halpern, S. Walbridge, S. Ciriaco, F. Ferretti, S. Fraschetti, R. Lewison, L. Nykjaer, and A. A. Rosenberg. 2013. “Cumulative Human Impacts on Mediterranean and Black Sea Marine Ecosystems: Assessing Current Pressures and Opportunities.” Plos One 8 (12): 121–132. doi:https://doi.org/10.1371/journal.pone.0079889.
- Mumby, P. J., I. Chollett, Y. M. Bozec, and N. H. Wolff. 2014. “Ecological Resilience, Robustness and Vulnerability: How do These Concepts Benefit Ecosystem Management?” Current Opinion in Environmental Sustainability 7: 22–27. doi:https://doi.org/10.1016/j.cosust.2013.11.021.
- Nguyen, A. K., Y. A. Liou, M. H. Li, and T. A. Tran. 2016. “Zoning eco-Environment Vulnerability for Environmental Management and Protection.” Ecological Indicators 69: 100–117. doi:https://doi.org/10.1016/j.ecolind.2016.03.026.
- Nillson, C. N., and G. Grelsson. 1995. “The Fragility of Ecosystems: A Review.” Journal of Applied Ecology 32 (4): 677–692. doi:https://doi.org/10.2307/2404808.
- Olson, D. M., and E. Dinerstein. 2002. “The Global 200: Priority Ecoregions for Global Conservation.” Annals of the Missouri Botanical Garden 89 (2): 199–1224. doi:https://doi.org/10.2307/3298564.
- Pamucar, D., M. Behzad, D. Bozanic, and M. Behzad. 2021. “Decision Making to Support Sustainable Energy Policies Corresponding to Agriculture Sector: Case Study in Iran’ s Caspian Sea Coastline.” Journal of Cleaner Production 292: 141–158. doi:https://doi.org/10.1016/j.jclepro.2020.125302.
- Pimm, S. L., C. N. Jenkins, R. Abell, T. M. Brooks, J. L. Gittleman, L. N. Joppa, P. H. Raven, C. M. Roberts, and J. O. Sexton. 2014. “The Biodiversity of Species and Their Rates of Extinction, Distribution, and Protection.” Science 344 (6187): 987–994. doi:https://doi.org/10.1126/science.1246752.
- Pimm, S. L., C. N. Jenkins, and B. V. Li. 2018. “How to Protect Half of Earth to Ensure it Protects Sufficient Biodiversity.” Science Advance 4 (8): 1–7. doi:https://doi.org/10.1126/sciadv.aat2616.
- Pojar, I., C. Kochleus, G. Dierkes, S. M. Ehlers, G. Reifferscheid, and F. Stock. 2021. “Quantitative and Qualitative Evaluation of Plastic Particles in Surface Waters of the Western Black Sea.” Environment Pollution 268 (A): 146–162. doi:https://doi.org/10.1016/j.envpol.2020.115724.
- Potapov, P., A. Yaroshenko, S. Turubanova, M. Dubinin, L. Laestadius, C. Thies, D. Aksenov, et al. 2008. “Mapping the World's Intact Forest Landscapes by Remote Sensing.” Ecology and Society 13 (2): 51–73. doi:https://doi.org/10.5751/es-02670-130251.
- Rodrigues, A. S. L., and V. Cazalis. 2020. “The Multifaceted Challenge of Evaluating Protected Area Effectiveness.” Nature Communications 11 (1): 5147–5171. doi:https://doi.org/10.1038/s41467-020-18989-2.
- Santini, L., S. H. M. Butchart, C. Rondinini, A. Benitez-Lopez, J. P. Hilbers, A. M. Schipper, M. Cengicrza, J. A. Tobias, and M. A. J. Huijbregts. 2019. “Applying Habitat and Population-Density Models to Land-Cover Time Series to Inform IUCN Red List Assessments.” Conservation Biology 33 (5): 1084–1093. doi:https://doi.org/10.1111/cobi.13279.
- Stattersfield, A. J., M. Crosby, A. Long, and D. Wege. 1998. Endemic Bird Areas of the World: Priorities for Biodiversity Conservation. Cambridge: Bird Life International.
- Stephenson, P. J., T. M. Brooks, S. H. M. Butchart, E. Fegraus, G. N. Geller, R. Hoft, J. Hutton, N. Kingston, B. Long, and L. Mcrae. 2017. “Priorities for big Biodiversity Data.” Frontiers in Ecology and the Environment 15: 124–125. doi:https://doi.org/10.1002/fee.1473.
- Swann, E. A., A. W. Mackay, E. Vologina, M. D. Jones, V. N. Panizzo, M. J. Leng, H. J. Sloane, A. M. Snelling, and M. Sturm. 2018. “Lake Baikal Isotope Records of Holocene Central Asian Precipitation.” Quaternary Science Reviews 189: 210–222. doi:https://doi.org/10.1016/j.quascirev.2018.04.013.
- Swann, G. E. A., V. N. Panizzo, S. Piccolroaz, V. Pashley, M. S. A. Horstwood, S. Roberts, E. Vologina, N. Piotrowska, M. Sturm, and A. Zhdanov. 2020. “Changing Nutrient Cycling in Lake Baikal, the World's Oldest Lake.” Proceedings of the National Academy of Sciences of the United States of America 117 (44): 27211–27217. doi:https://doi.org/10.1073/pnas.2013181117.
- Thiault, L., S. Gelcich, N. Marshall, P. Marshall, F. Chlous, and J. Claudet. 2020. “Operationalizing Vulnerability for Social-Ecological Integration in Conservation and Natural Resource Management.” Conservation Letters 13 (1): 227–242. doi:https://doi.org/10.1111/conl.12677.
- Thiault, L., P. Marshall, S. Gelcich, A. Collin, F. Chlous, and J. Claudedt. 2018. “Mapping Social-Ecological Vulnerability to Inform Local Decision Making.” Conservation Biology 32: 447–456. doi:https://doi.org/10.1111/cobi.12989.
- Turner, I. I., P. A. Matson, J. J. McCarthy, R. W. Corell, L. Christensen, N. Eckley, J. X. Kasperson, et al. 2003. “A Framework for Vulnerability Analysis in Sustainability Science.” Proceedings of the Natlional Academy of Sciences of the United States of America 100 (14): 8074–8079. doi:https://doi.org/10.1073/pnas.1231335100.
- UNEP. 2020. “Earth Commission Meeting Report to the Convention on Biological Diversity: Synthesizing the Scienfic Enidence to Inform the Development of the Post-2020 Global Framework on Biodiversity.” Twenty-fourth meeting, Montreal, Canada.
- Venter, O., A. Magrach, N. Outram, C. J. Klein, H. P. Possingham, M. Di Marco, and J. E. M. Watson. 2018. “Bias in Protected-Area Location and its Effects on Long-Term Aspirations of Biodiversity Conventions.” Conservation Biology 32 (1): 127–134. doi:https://doi.org/10.1111/cobi.12970.
- Visconti, P., S. H. M. Butchart, T. M. Brooks, P. F. Langhammer, D. Marnewick, S. Vergara, A. Yanosky, O. Crowe, and J. E. M. Watson. 2019. “A Bold Successor to Aichi Target 11—Response.” Science 365 (6454): 650–651. doi:https://doi.org/10.1126/science.aay2768.
- Wang, S. D., X. Y. Zhang, T. X. Wu, and Y. Y. Yang. 2019. “The Evolution of Landscape Ecological Security in Beijing Under the Influence of Different Policies in Recent Decades.” Science of the Total Environment 646: 49–57. doi:https://doi.org/10.1016/j.scitotenv.2018.07.146.
- White, G. F. 1974. Natural Hazards Research: Concepts, Methods, and Policy Implications. Natural Hazards: Local, National, Global. New York: Oxford University Press.
- Woodley, S., N. Bhola, C. Maney, and H. Locke. 2019. “Area-based Conservation Beyond 2020: A Global Survey of Conservation Scientists.” Parks 25: 19–30. doi:https://doi.org/10.2305/IUCN.CH.2019.PARKS-25-2SW1.en.
- Wu, T. X., S. Sang, S. D. Wang, Y. Y. Yang, and M. Y. Li. 2020. “Remote Sensing Assessment and Spatiotemporal Variations Analysis of Ecological Carrying Capacity in the Aral Sea Basin.” Science of the Total Environment 735: 363–374. doi:https://doi.org/10.1016/j.scitotenv.2020.139562.
- Xu, Z. C., S. N. Chau, X. Z. Chen, J. Zhang, Y. J. Li, T. Dietz, J. Y. Wang, et al. 2020. “Assessing Progress Towards Sustainable Development Over Space and Time.” Nature 577 (7788): 74–78. doi:https://doi.org/10.1038/s41586-019-1846-3.
- Xu, Y., Z. H. Shen, L. X. Ying, P. Ciais, H. Y. Liu, S. L. Piao, C. Wen, and Y. X. Jiang. 2016. “The Exposure, Sensitivity and Vulnerability of Natural Vegetation in China to Climate Thermal Variability (1901–2013): An Indicator-Based Approach.” Ecological Indicators 63: 258–272. doi:https://doi.org/10.1016/j.ecolind.2015.12.023.
- Yang, R., Y. Cao, S. Y. Hou, Q. Y. Peng, X. S. Wang, F. Y. Wang, T. H. Tseng, et al. 2020. “Cost-effective Priorities for the Expansion of Global Terrestrial Protected Areas: Setting Post-2020 Global and National Targets.” Science Advances 6 (37): eabc3436–8. doi:https://doi.org/10.1126/sciadv.abc3436.
- Zhang, X. Q., L. K. Wang, X. S. Fu, H. Li, and C. D. Xu. 2017. “Ecological Vulnerability Assessment Based on PSSR in Yellow River Delta.” Journal of Cleaner Production 167: 1106–1111. https://doi.org/doi.org/10.1016/j.jclepro.2017.04.106.
- Zheng, Y. M. 2020. “The Assessment of Conservation Priority of Global Top 500 National Parks”. In: Big Earth Data in Support of the Sustainable Development Goals (2019), edited by H. D. Guo, et al. China: Science Press.
- Zheng, Y. M., Z. G. Niu, P. Gong, and J. Wang. 2015. “A Database of Global Wetland Validation Samples for Wetland Mapping.” Science Bulletin 60: 428–434. doi:https://doi.org/10.1007/s11434-014-0717-4.
- Zheng, Y. M., H. Y. Zhang, Z. G. Niu, and P. Gong. 2012. “Protection Efficacy of National Wetland Reserves in China.” Chinese Science Bulletin 57: 1116–1134. doi:https://doi.org/10.1007/s11434-011-4942-9.
Appendices
Appendix 1. The indicators and the detailed information used to evaluate ecological vulnerability.
Table