
 ?Mathematical formulae have been encoded as MathML and are displayed in this HTML version using MathJax in order to improve their display. Uncheck the box to turn MathJax off. This feature requires Javascript. Click on a formula to zoom.
ABSTRACT
Fire, especially wildfire, which can be considered as one of the main threats to vegetation cover and animals' life, has attracted lots of attention from environmental researchers. To better manage the fire crisis and take the necessary measures to compensate for its damages, it is essential to have detailed information about the burn severity levels. Accordingly, satellite images and their spectral indices have been widely considered in the literature as powerful tools in producing burn severity information. Despite the efficiency of the previously proposed methods, the necessity of ground reference data for their thresholding step faces them with serious challenges. To address this problem, in this study, an automatic procedure based on the change-point analysis is presented for thresholding differenced normalized burn ratio (dNBR) and its another version, dNBR2. In this procedure, a mean-shift based change-point analysis is performed on the dNBR and dNBR2 images for classifying them into burn severity levels. Experiments, conducted on some parts of Alaska and California in the United States, illustrated the high efficiency of the proposed method. Moreover, as an applied experiment, the severity of the fires, occurred in 2020 in the Khaeiz protected area in Iran, was estimated and compared with local reports.
1. Introduction
Every year, millions of hectares of forests and vegetation areas around the world are destroyed by fire, which has a significant impact on the ecosystem and habitat of animals in these areas. These fires often occur in the warm seasons of the year, mainly due to climate change, human factors, and special weather conditions such as drought, strong winds, and heat waves (Fernandez-Manso, Quintano, and Roberts Citation2019). In order to compensate for the loss to the vegetation after the fire, it is very important to determine the location and the severity of the fires. To this end, field-based surveying is the initial strategy. But unlike the high accuracy of this strategy, it is very costly and time-consuming and is not proper for real-time applications. Due to these problems, in recent decades, satellite imagery with sampling from different part of the electromagnetic spectrum, have a lower cost than the field-based method, covering the wide spatial extent, and have time-series images from different regions have been introduced as a suitable alternative to field-based surveying (Quintano, Fernandez-Manso, and Roberts Citation2017). Accordingly, these images have been significantly used in the literature to detect burn severity. In general, models for burn severity mapping can be categorized into two main categories: physical models and empirical models (He et al. Citation2019).
Physical models, like radiative transfer models, simulate the physical interaction between the canopies of the burned vegetation and light radiation (Chuvieco et al. Citation2006). These models have a complex implementation and, as their name implies, require some physical parameters of the scene of imagery. In contrast, empirical models, like spectral indices-based models, are easy to implement and interpret. Due to this simplicity, these models, especially spectral indices-based ones, have been highly considered in a vast extent of studies to detect the burn severity of the burnt areas.
Several spectral indices have been used to detect burned area from satellite images. Burned area index (BAI) (Chuvieco, Martin, and Palacios Citation2002), mid infra-red burn index (MIRBI) (Trigg and Flasse Citation2001), normalized burned ratio (NBR) (Key and Benson Citation2006), normalized burned ration 2 (NBR2) (Lutes et al. Citation2006), normalized burn ratio thermal (NBRT1) (Holden et al. Citation2005) are the most important indices, used for burn detection in the literature. Among these different spectral indices, differenced version of NBR (dNBR) has attracted lots of attention in burn severity level mapping, so that it is known as a reference methodology (Soverel, Perrakis, and Coops Citation2010). Along with dNBR, relative dNBR (RdNBR) (Miller and Thode Citation2007) is another commonly used method for burn severity estimation in different studies.
A multi-temporal dNBR method was proposed in Veraverbeke et al. (Citation2011) based on the MODIS images for the large 2007 Peloponnese Region wildfire in Greece. Chu et al. also proposed a procedure based on the differencing of vegetation indices including dNBR, differenced normalized difference vegetation index (dNDVI), and differenced normalized difference moisture index (dNDMI) to determine the burn severity in the Siberian boreal larch forest in northern Mongolia within different time lags (Chu, Guo, and Takeda Citation2016). Furthermore, Quintano et al. applied dNBR and RdNBR, along with relative burn ratio (RBR) (Parks, Dillon, and Miller Citation2014), to map burn severity in a region in Spain using the combination of Landsat-8 and Sentinel-2 data sets (Quintano, Fernández-Manso, and Fernández-Manso Citation2018). In another study, burned areas and their corresponding burn severity levels of the sugarcane area were extracted using dNBR images in a region in Tarlac, Philippines (Baloloy et al. Citation2016). In 2020, Saulino used Landsat-8 and Sentinel-2 derived dNBR and investigated their performance using field-based spectral indices (Saulino et al. Citation2020). They showed the superiority of Sentinel-2 derived dNBR over Landsat-8 one for burn severity mapping in the Mediterranean wildfire.
As can be inferred from the above studies, dNBR is an important tool for burn severity map generation due to its simplicity and effectiveness. However, to achieve a burn severity map from a dNBR image, some threshold values should be applied to distinguish the different levels of burn severity, which is a challenging procedure. It is noteworthy that the greater the dNBR value is, the greater the level of the burn will be. Accordingly, different thresholding procedures were used in burn monitoring studies.
Key and Benson proposed burn severity ranges based on a field-based matching as (Key and Benson Citation2006). Such a classification has been used in different studies. However, these threshold values are case dependent, and they are not optimal for different scenarios. Like this study, a non-linear regression model between dNBR and field-based burn indices, including composite burn index (CBI) (Key and Benson Citation2006) and its geometrically improved version (GeoCBI) (De Santis and Chuvieco Citation2009), was proposed for the Mediterranean forest type in Saulino et al. (Citation2020). Boucher et al. successfully used a polynomial model between the field data and spectral indices to determine threshold values (Boucher et al. Citation2017). An iterative procedure was also used in Miller and Thode (Citation2007) to classify burn severity levels, in which increasing values for each threshold were combined until the highest proportion of samples was correctly classified. The last two procedure also were used in María Guadalupe, Mundo, and Veblen (Citation2020) for burn severity monitoring in North Patagonian Forests.
Table 1. Threshold values provided by Key and Benson for burn severity determination through dNBR image (Key and Benson Citation2006).
Although the above-mentioned procedure can to some extent properly classify the different levels of burn severity, it requires some training field-based data. As the study area expands, it will be practically impossible to obtain terrestrial data for finding the optimal threshold values. On the other hand, there is no information about the reliability and sufficiency of the field samples. To address the challenging problem of automatically determining proper threshold values, without field-based samples, a burn severity mapping procedure has been proposed in this study based on the satellite-derived dNBR and dNBR2 images and change-point analysis (Eckley, Fearnhead, and Killick Citation2011). It should be noted that the main goal of this study is to demonstrate the potential of change-point analysis for the classification of the difference bands of spectral indices into burn severity levels. To do so, we used two spectral indices, NBR and NBR2, to show the performance of the proposed thresholding process. In the proposed procedure, after masking vegetational increased regions and water bodies, NBR and NBR2 bands for pre- and post-fire images were calculated. Then, the dNBR and dNBR2 bands were generated by differencing the mentioned spectral indices. After that, the change-point analysis method was performed on the dNBR and dNBR2 bands to find three optimal points, in which the mean statistic of the data changed. These three points divided the data range of dNBR and dNBR2 into four intervals: unburned, low severity, medium severity, and high severity.
The remainder of this study is organized as follows. In Section 2, we describe the detailed information of our proposed burn severity mapping procedure. Study areas, data sets, and the results of implementing our proposed procedure are explained in Section 3. The conclusion and future remarks are presented in Section 4.
2. Methodology
The proposed procedure for burn severity mapping consists of two main parts: (1) generate difference bands of spectral indices, and (2) thresholding difference bands using the change-point analysis to classify them into burn severity levels. shows the general workflow of the burn severity mapping in this study. In the following, the detailed steps of the main two parts of the proposed procedure are introduced.
Figure 1. Flowchart of the proposed procedure for burn severity mapping.
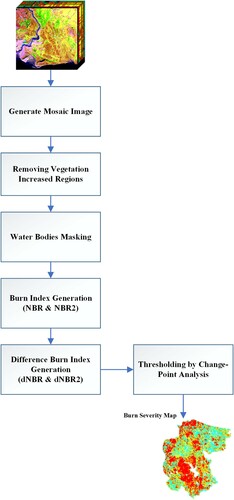
2.1. Generating difference bands of burn indices
As shown in , the first step of the proposed method is generating mosaic pre- and post-fire images. This step is performed due to working with a large study area and probable lack of images at a specified required time. To make sure the produced mosaic images (i.e. pre- and post-fire images) cover the entire study area, two-month period images were collected corresponding to pre- and post-fire.
The second step is removing vegetational-increased regions from the images that implies there is no fire in these areas. To this end, dNDVI between pre- and post-fire mosaic images were produced as follows:
(1)
(1) where
and
are respectively the reflectance of the near-infrared and red bands. Then, for ith pixel of the image:
(2)
(2) Water bodies are masked from the pre- and post-fire images in the third step of the proposed procedure. In this step, the normalized difference water index (NDWI) for mentioned images calculated as follows (McFeeters Citation2013):
(3)
(3) where
is the reflectance in the green band of the image. As stated by McFeeters (Citation2013), pixels with NDWI values more than 0.3 are considered as the water bodies. Our experiments proved that this threshold value is the optimal one for our case studies.
The next step of our proposed burn severity mapping procedure is calculating burn index bands, which are NBR and NBR2 in our study. These two bands are produced by using the following equations (Key and Benson Citation2006; Lutes et al. Citation2006).
(4)
(4) and
(5)
(5) where
and
are the reflectance of the short wave infrared bands, i.e. SWIR1 and SWIR2. It is worth noting that all the satellite images do not have these two bands. Consequently, Equation (Equation5
(5)
(5) ) is used for situations where the satellite has both SIWR bands, such as the Landsat-8 satellite images.
Finally, the differences between pre- and post-fire burn indices bands were calculated as follow:
(6)
(6)
2.2. Change-point analysis based thresholding
Change points analysis is the procedure of extracting some points from a data series, in which the distributional properties of the data series changed. Therefore, this analysis can divide the data series into some statistically homogenous regions (Eckley, Fearnhead, and Killick Citation2011). Basically, change-point analysis is for time-series data, in which a set of data is monitored over time. In this study, this analysis was applied in the spatial domain. A mean-shift based change-point analysis model (Page Citation1955) was performed for burn severity mapping purpose.
Let are increasingly ordered sequence of pixel values of the difference images, i.e. dNBR and dNBR2. The values of the mentioned sequence can be written in the following form:
(7)
(7) where μ is the mean of the sequence, before the unknown change-point occurred in the location c.
is the zero-mean independent random error with unknown variance in the location i. Moreover,
is defined as follows:
(8)
(8) where n is the total number of gray levels in the image. To detect mean shifts, cumulative sum (CUSUM) is the first strategy which is calculated as follows (Page Citation1955):
(9)
(9) where m is a gray level of the image pixels. The expectation of the
is as follows:
(10)
(10) From the above equation, it is inferred that if
is large, the Δ value is non-zero, and therefore, a change-point has occurred in the location m. As a result, it can be said that the change point is the point, in which the CUSUM statistic is maximized. Multiple change points are determined using the points with higher CUSUM statistics.
In this study, three change-points, and
, are extracted as threshold values for burn severity map generation. Based on these threshold values, the burn severity of the jth pixel of the difference image (dNBR or dNBR2) is categorized as follows:
(11)
(11)
3. Experiments and analysis
In this section, to evaluate the performance of the proposed procedure, different experiments have been conducted in two main parts. In the first part of the experiments, the accuracy of the results of the proposed algorithm has been analyzed using reference burn severity maps, generated under the monitoring trends in burn severity (MTBS) project (Eidenshink et al. Citation2007). After revealing the effectiveness of the proposed method for burn severity mapping in the first part, in the second part of the experiments, the burn severity map for the Khaeiz protected area in Iran, which caught fire in the spring of 2020, has been produced and compared to the local reports.
3.1. Experiments using ground truth
Regions in Alaska and California in the United States have been used to evaluate the effectiveness of the proposed burn severity mapping method. In these two regions, several fires have been occurred in 2018 that caused a large amount of vegetation destruction. Landsat-8 satellite images have been used to determine the burn severity in the study regions. To form pre- and post-fire images, we collected all the images with less than %20 cloud coverage, acquired in September and October from the two mentioned regions. September and October are the last months of the warm season of the year, and as a result, the damages of fires of the warm seasons can be monitored in their corresponding images. On the other hand, in these months, the amount of clouds and snow in the images is low enough to efficiently analyze fire-based changes on the earth's surface. After collecting mentioned images, we generated pre- and post-fire mosaic images for the years 2017 and 2018, which reflect the severity of the 2018 burnings. Then, the proposed algorithm was performed on the mosaic images to obtain burn severity maps.
The data, provided under the MTBS project, were used as reference data in this study. This data, which is freely available to users (https://www.mtbs.gov/direct-download), is based on the NBR index and the interpretation of its values, as well as using CBI ground data. The burn severity maps in the MTBS project consist of six classes including unburned, low severity, moderate severity, high severity, increased greenness, and water bodies. In our experiments, we discarded two increased greenness and water bodies classes, because our proposed burn severity mapping method already masked these areas during its procedures.
To provide a competitive qualification for the proposed method, we used the traditional dNBR thresholding method (Key and Benson Citation2006), which is the only available unsupervised option that has a similar purpose to our research. This method simply segments dNBR band with some of the global suggested threshold values as described in .
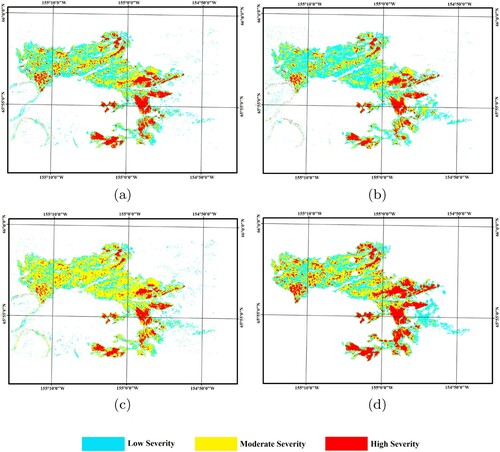
shows the map of the severity of the burn, occurred in 2018 in a region in Alaska. As shown in this figure, there is a high similarity between the obtained maps through the proposed method and the reference map, especially in areas with high burn severity. Since there is no information about the exact study period of the reference burn severity map, the obtained maps and the reference map do not exactly match each other in terms of the study period. Hence the slight differences between these maps are inevitable. Although the dNBR and dNBR2 images were not similar, and also, their threshold values were not the same, however, their obtained burn severity maps are very similar. This indicates the high performance of the proposed methods, regardless of the applied spectral index. The visual interpretation of the maps in also shows that the similarity of the dNBR-based burn severity map to the reference map was higher than the dNBR2-based one. This higher similarity can be seen by comparing the moderate burn severity parts of these maps with the reference map.
Figure 2. Burn severity maps obtained for a region in Alaska through (a) our proposed method by dNBR, (b) our proposed method by dNBR2, (c) traditional dNBR classification proposed by Key and Benson (Citation2006), and (d) the reference burn severity map provided by MTBS project.
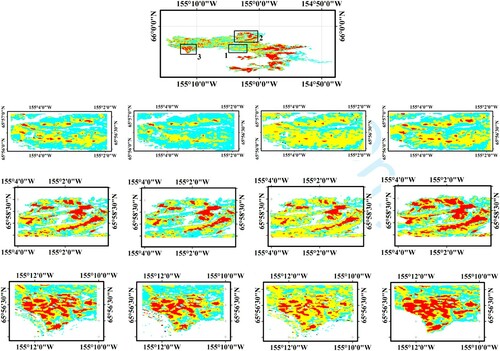
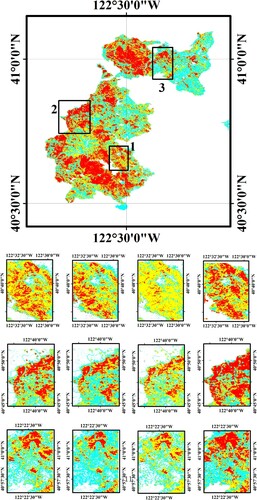
To more detailed examine the differences between the generated maps, three sub-scenes from the Alaska region were selected and the results are shown separately in . As shown in this figure, there are considerable differences between the results of the proposed method with those of traditional dNBR method. In these sub-scenes, the traditional dNBR method places most of the pixels at the moderate severity level. For example, for the first sub-scene (first row), the traditional dNBR method placed a large number of pixels with low burn severity at the moderate burn level. In the second sub-scene, regions with high burn severity located at the moderate level, while the proposed method accurately detected the severity of burns in these areas. This is also the case for the third sub-scene, and unlike the traditional dNBR method, the proposed method had a high accuracy in identifying areas with high burn severity.
Figure 3. Burn severity maps for three sub-scenes of the Alaska region. Upper figure shows the location of the sub-scenes. Rows from the top to the bottom are first to third sub-scenes, and columns from left to right corresponds to: dNBR-based proposed method, dNBR2-based proposed method, traditional dNBR, and reference map.
and show the confusion matrices of burn severity mapping obtained by our proposed method on the dNBR and dNBR2 bands, respectively. As shown in the tables, the highest user's accuracy belonged to the high severity class. Moreover, in both cases, the lowest accuracy values obtained for low severity classes. In practice, there is not much difference between low burn severity and unburned classes. The most important aspect of the burn severity mapping is to distinguish between pixels of low burn severity (or unburned) class and those of high burn severity class. Focusing on and , it can be seen that the number of pixels that are misdiagnosed between these two classes is very small. Totally, with 81.17 % overall accuracy and κ coefficient equals to 0.76, the dNBR-based burn severity map, obtained by our proposed method, outperformed the dNBR2-based one, and also showed a high accuracy for burn severity mapping.
Table 2. Confusion matrix of the burn severity mapping over the Alaska region obtained through the proposed method based on the dNBR image.
Table 3. Confusion matrix of the burn severity mapping over the Alaska region obtained through the proposed method based on the dNBR2 image.
The burn severity map for the fires that occurred in 2018 in an area of California is shown in . As is clear from the comparison of and maps, the accuracy of the burn severity maps obtained by our proposed method in this region is somewhat less than in Alaska. However, there are many similarities between the maps obtained from the proposed algorithm and the reference map in this region. The differences between these images mostly belong to the areas with high burn severity. As can be seen in , parts of the areas with high burn severity are reported as moderate burn severity by the proposed algorithm. The middle part of the region, which is illustrated in (d), is the main focus of fire in this region. In addition to this part, areas with low burn severity are also seen in the generated burn maps around this part. As with the Alaska region, in this region, the mismatch between generated and reference maps can be attributed to the mismatch between our study period and the period in which the reference map was generated. In general, although in some parts of the study area, the generated and reference maps are not the same, however, the high similarity of these maps indicates the proper performance of the proposed method.
Figure 4. Burn severity maps obtained for a region in California through (a) our proposed method by dNBR, (b) our proposed method by dNBR2, (c) traditional dNBR classification proposed by Key and Benson (Citation2006), and (d) the reference burn severity map provided by MTBS project.
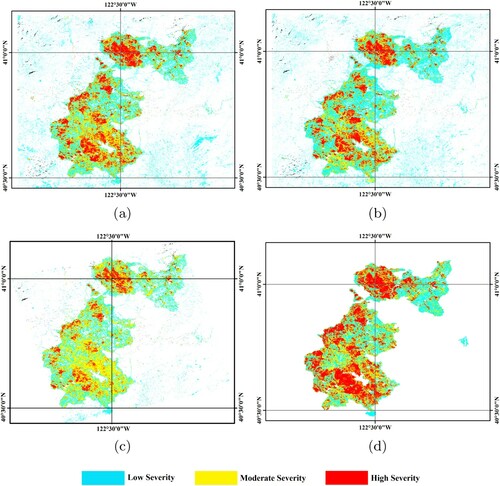
shows three sub-scenes from the California region to closely evaluate the effectiveness of burn severity mapping methods. As for the Alaska region, the main problem with the traditional dNBR method was in finding areas with high burn severity. The various sub-scenes show that the traditional dNBR method generally placed these areas at a moderate severity level, while these areas were accurately extracted through the proposed method.
Figure 5. Burn severity maps for three sub-scenes of the California region. Upper figure shows the location of the sub-scenes. Rows from the top to the bottom are first to third sub-scenes, and columns from left to right corresponds to: dNBR-based proposed method, dNBR2-based proposed method, traditional dNBR, and reference map.
and exhibit the confusion matrices of the maps, generated through implementing proposed burn severity mapping method on the study region of California. In general, a comparison of these tables with and shows that the accuracy of the maps, produced by the proposed method, in the Alaska region was higher than those of in the California region. As in the Alaska region, in the California region had the highest user's accuracy in the high severity class. However, according to these tables, the accuracy values of the maps, obtained based on dNBR and dNBR2 bands, were almost the same. The difference between the overall accuracy values for the mentioned maps is less than 2%, and their κ coefficient values are equal. As stated in the descriptions of and , the number of misdiagnosed pixels between the low and high severity classes for the California region's map is very small, so that only 5% of the low class pixels are in the high class, and for the reverse case, the percentage of these pixels was less than 1%. Finally, a review of and indicates the appropriate accuracy of the proposed method in determining the severity of burns in the California region. Furthermore, a comparison of the two tables shows that, like the maps of the Alaska region, the maps generated from the dNBR band in this region were more accurate than the dNBR2-based ones.
Table 4. Confusion matrix of the burn severity mapping over the California region obtained through the proposed method based on the dNBR image.
Table 5. Confusion matrix of the burn severity mapping over the California region obtained through the proposed method based on the dNBR2 image.
Finally, shows the overall accuracy of the proposed method alongside the traditional dNBR method over the experimental data sets. As can be seen from this table, the accuracy of the maps extracted by the proposed method in both cases of using the dNBR and dNBR2 bands has been significantly higher than those of the traditional dNBR method. Examination of these results along with the analysis of – indicates the high accuracy of the proposed method compared to unsupervised traditional dNBR method.
Table 6. Comparison of overall accuracy values of the burn severity maps, obtained through proposed and traditional dNBR methods.
3.2. Applied experiment
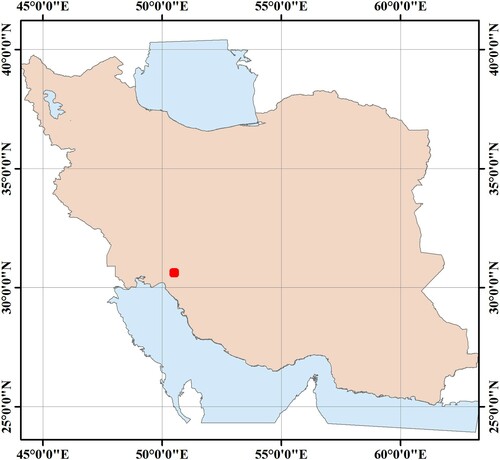
In this part of our experiments, the proposed algorithm has been used to determine the burn severity of the fire that occurred in the Khaeiz protected area. Khaeiz protected area, with an area of about 33,000 hectares, is located on the border of Kohgiluyeh and Boyer-Ahmad and Khuzestan Provinces in Iran. The existence of sufficient water and different species of vegetation has made this region one of the most important wildlife habitats in Iran. Moreover, it is considered an important tourist attraction due to its beautiful nature and environment. The location of this area is shown in .
Figure 6. Location of the Khaeiz protected area (red dot) on the map of Iran.
On 28 May 2020, a fire started in parts of the region's forests that was extinguished four days later on 1 June 2020. The fire caused extensive damage to the region's vegetation and wildlife. In order to determine the burn severity in this area, the proposed procedure was implemented on the Landsat-8 satellite images, acquired on 14 May 2020 (as a pre-fire image) and 15 June 2020 (as a post-fire image). The obtained burn severity maps for the mentioned region are shown in .
Figure 7. Burn severity maps obtained by our proposed method for the fire occurred in the Khaeiz protected area in May 2020 using (a) dNBR image, and (b) dNBR2 image.
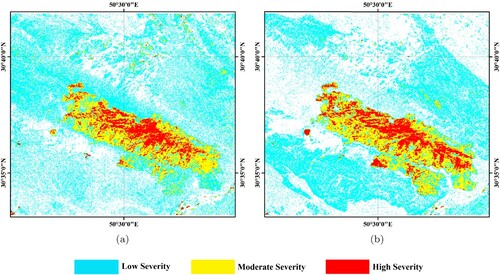
Local reports indicated burn occurrence in areas, shown as moderate and high burn severity in . They also estimated that about 1600 hectares of land in the Khaeiz protected area have been burned. In our maps, the areas of the regions with high burn severity were about 1200 and 1400 hectares by the proposed method on the dNBR and dNBR2 images, respectively. The maps extracted in this area indicate that the results of the proposed method have been somewhat exaggerated in the low burn severity regions. However, the regions with high and medium burn severity are well extracted and are consistent with local reports, prepared by the Iranian Space Agency (https://www.isa.ir/).
4. Conclusion
The necessity for field data to determine the burn severity and the uncertainty in their accuracy is an important challenge in environmental studies. Therefore, it seems necessary to investigate applying unsupervised algorithms for burn severity mapping. Accordingly, in this study, an automatic method was proposed to determine the burn severity in different burned areas. Using the change-point analysis, the proposed method was able to estimate the severity of the burn without any ground reference data using NBR and NBR2 spectral indices.
Experiments, performed in this study, showed that the proposed method can be used effectively to determine the severity of burns in different areas. They also showed that the maps generated based on NBR spectral index (or dNBR band) were more accurate than those of NBR2 index (or dNBR2 band). Moreover, after proving the efficiency of the proposed method in determining different levels of burn severity, we performed our method on the Khaeiz protected area, which caught fire in May 2020, as an applied experiment and extracted its burn severity map.
The proposed method was implemented based on two spectral indices, including NBR and NBR2, which have been widely used in previous studies to detect the burn severity. However, the proposed procedure can be performed and generalized to all available spectral indices in this field. On the other hand, although three levels of the low, medium, and high burn severity were considered, however, these levels can be separated in more detail and their sub-levels can be extracted based on the change-point analysis. Focusing on these issues, i.e. using different spectral indices and examining the burn severity in more detail, will be the subject of our future studies.
Disclosure statement
No potential conflict of interest was reported by the author(s).
References
- Baloloy, A. B., A. C. Blanco, B. S. Gana, R. C. Sta Ana, and L. C. Olalia. 2016. “Landsat-Based Detection and Severity Analysis of Burned Sugarcane Plots in Tarlac, Philippines Using Differenced Normalized Burn Ratio (dNBR).” In International Archives of the Photogrammetry, Remote Sensing & Spatial Information Sciences, Kuala Lumpur, Malaysia, 42. Gottingen: Copernicus GmbH.
- Boucher, Jonathan, André Beaudoin, Christian Hébert, Luc Guindon, and Éric Bauce. 2017. “Assessing the Potential of the Differenced Normalized Burn Ratio (dNBR) for Estimating Burn Severity in Eastern Canadian Boreal Forests.” International Journal of Wildland Fire 26 (1): 32–45.
- Chu, Thuan, Xulin Guo, and Kazuo Takeda. 2016. “Temporal Dependence of Burn Severity Assessment in Siberian Larch (Larix Sibirica) Forest of Northern Mongolia Using Remotely Sensed Data.” International Journal of Wildland Fire 25 (6): 685–698.
- Chuvieco, Emilio, M. P. Martin, and A. Palacios. 2002. “Assessment of Different Spectral Indices in the Red-Near-Infrared Spectral Domain for Burned Land Discrimination.” International Journal of Remote Sensing 23 (23): 5103–5110.
- Chuvieco, E., D. Riaño, F. M. Danson, and P. Martin. 2006. “Use of A Radiative Transfer Model to Simulate the Postfire Spectral Response to Burn Severity.” Journal of Geophysical Research 111: G04S09. doi:10.1029/2005JG000143.
- De Santis, Angela, and Emilio Chuvieco. 2009. “GeoCBI: A Modified Version of the Composite Burn Index for the Initial Assessment of the Short-Term Burn Severity From Remotely Sensed Data.” Remote Sensing of Environment 113 (3): 554–562.
- Eckley, Idris A., Paul Fearnhead, and Rebecca Killick. 2011. “Analysis of Changepoint Models.” In Bayesian Time Series Models, 205–224. Cambridge: Cambridge University Press.
- Eidenshink, Jeff, Brian Schwind, Ken Brewer, Zhi-Liang Zhu, Brad Quayle, and Stephen Howard. 2007. “A Project for Monitoring Trends in Burn Severity.” Fire Ecology 3 (1): 3–21.
- Fernandez-Manso, Alfonso, Carmen Quintano, and Dar A. Roberts. 2019. “Burn Severity Analysis in Mediterranean Forests Using Maximum Entropy Model Trained with EO-1 Hyperion and LiDAR Data.” ISPRS Journal of Photogrammetry and Remote Sensing 155: 102–118.
- He, Yinan, Gang Chen, Angela De Santis, Dar A. Roberts, Yuyu Zhou, and Ross K. Meentemeyer. 2019. “A Disturbance Weighting Analysis Model (DWAM) for Mapping Wildfire Burn Severity in the Presence of Forest Disease.” Remote Sensing of Environment 221: 108–121.
- Holden, Z. A., A. M. S. Smith, P. Morgan, M. G. Rollins, and P. E. Gessler. 2005. “Evaluation of Novel Thermally Enhanced Spectral Indices for Mapping Fire Perimeters and Comparisons with Fire Atlas Data.” International Journal of Remote Sensing 26 (21): 4801–4808.
- Key, Carl H., and Nathan C. Benson. 2006. “Landscape Assessment (LA).” In FIREMON: Fire Effects Monitoring and Inventory System. Gen. Tech. Rep. RMRS-GTR-164-CD, Fort Collins, CO: US Department of Agriculture, Forest Service, Rocky Mountain Research Station. p. LA-1-55, edited by Duncan C. Lutes, Robert E. Keane, John F. Caratti, Carl H. Key, Nathan C. Benson, Steve Sutherland, Larry J. Gangi, 164.
- Lutes, Duncan C., Robert E. Keane, John F. Caratti, Carl H. Key, Nathan C. Benson, Steve Sutherland, and Larry J. Gangi. 2006. “FIREMON: Fire Effects Monitoring and Inventory System.” In Gen. Tech. Rep. RMRS-GTR-164. Fort Collins, CO: US Department of Agriculture, Forest Service, Rocky Mountain Research Station. 1 CD., 164.
- María Guadalupe, Franco, Ignacio A. Mundo, and Thomas T. Veblen. 2020. “Field-Validated Burn-Severity Mapping in North Patagonian Forests.” Remote Sensing 12 (2): 214.
- McFeeters, Stuart K. 2013. “Using the Normalized Difference Water Index (NDWI) Within a Geographic Information System to Detect Swimming Pools for Mosquito Abatement: A Practical Approach.” Remote Sensing 5 (7): 3544–3561.
- Miller, Jay D., and Andrea E. Thode. 2007. “Quantifying Burn Severity in A Heterogeneous Landscape with a Relative Version of the Delta Normalized Burn Ratio (dNBR).” Remote Sensing of Environment 109 (1): 66–80.
- Page, E. S. 1955. “A Test for A Change in A Parameter Occurring At An Unknown Point.” Biometrika 42 (3/4): 523–527.
- Parks, Sean A., Gregory K. Dillon, and Carol Miller. 2014. “A New Metric for Quantifying Burn Severity: The Relativized Burn Ratio.” Remote Sensing 6 (3): 1827–1844.
- Quintano, C., Alfonso Fernández-Manso, and Oscar Fernández-Manso. 2018. “Combination of Landsat and Sentinel-2 MSI Data for Initial Assessing of Burn Severity.” International Journal of Applied Earth Observation and Geoinformation 64: 221–225.
- Quintano, Carmen, Alfonso Fernandez-Manso, and Dar A. Roberts. 2017. “Burn Severity Mapping From Landsat MESMA Fraction Images and Land Surface Temperature.” Remote Sensing of Environment 190: 83–95.
- Saulino, Luigi, Angelo Rita, Antonello Migliozzi, Carmine Maffei, Emilia Allevato, Antonio Pietro Garonna, and Antonio Saracino. 2020. “Detecting Burn Severity Across Mediterranean Forest Types by Coupling Medium-Spatial Resolution Satellite Imagery and Field Data.” Remote Sensing 12 (4): 741.
- Soverel, Nicholas O., Daniel D. B. Perrakis, and Nicholas C. Coops. 2010. “Estimating Burn Severity From Landsat DNBR and RdNBR Indices Across Western Canada.” Remote Sensing of Environment 114 (9): 1896–1909.
- Trigg, S., and S. Flasse. 2001. “An Evaluation of Different Bi-Spectral Spaces for Discriminating Burned Shrub-Savannah.” International Journal of Remote Sensing 22 (13): 2641–2647.
- Veraverbeke, Sander, Stefaan Lhermitte, Willem W. Verstraeten, and Rudi Goossens. 2011. “A Time-Integrated MODIS Burn Severity Assessment Using the Multi-Temporal Differenced Normalized Burn Ratio (dNBRMT).” International Journal of Applied Earth Observation and Geoinformation 13 (1): 52–58.