
 ?Mathematical formulae have been encoded as MathML and are displayed in this HTML version using MathJax in order to improve their display. Uncheck the box to turn MathJax off. This feature requires Javascript. Click on a formula to zoom.
ABSTRACT
Augmented virtual environments (AVE) combine real-time videos with 3D scenes in a Digital Earth System or 3D GIS to present dynamic information and a virtual scene simultaneously. AVE can provide solutions for continuous tracking of moving objects, camera scheduling, and path planning in the real world. This paper proposes a novel approach for 3D path prediction of moving objects in a video-augmented indoor virtual environment. The study includes 3D motion analysis of moving objects, multi-path prediction, hierarchical visualization, and path-based multi-camera scheduling. The results show that these methods can give a closed-loop process of 3D path prediction and continuous tracking of moving objects in an AVE. The path analysis algorithms proved accurate and time-efficient, costing less than 1.3 ms to get the optimal path. The experiment ran a 3D scene containing 295,000 triangles at around 35 frames per second on a laptop with 1 GB of graphics card memory, which means the performance of the proposed methods is good enough to maintain high rendering efficiency for a video-augmented indoor virtual scene.
1. Introduction
Augmented virtual environments (AVE) combine real-time videos with 3D scenes in a Digital Earth System. The combination provides dynamic information about the reality being represented by the virtual scene simultaneously by fusing video images with 3D models and visualizations of moving objects (Neumann et al. Citation2003; Jian et al. Citation2017). A wide field of view AVE created by fusing several separate or overlapping videos into the same virtual scene helps give a complete global view and makes it easier to understand the relationships between these videos and the changing situation in the real scene without using separate monitors to display videos. The fusion of dynamic images and 3D models can also display objects that are not part of the static 3D scene, such as trees, lamp poles, cars, pedestrians, and even their 3D trajectories. In addition to the fusion of video textures and visualization of moving objects in AVEs, object-oriented analysis is gaining more attention in practical applications to provide solutions in the real world, such as continuous tracking of moving objects, camera scheduling, and path planning. The moving objects’ images, 3D coordinates, and trajectories generated in an AVE are all crucial for object identification, 3D location, motion analysis, and 3D spatial analysis, which allow us to do 3D video surveillance, resource management, and decision making in a Digital Earth System.
3D path analysis is a useful method to search for and visualize the optimal path in a 3D scene and is commonly used in path planning, path routing, and navigation of pedestrians, vehicles, and UAVs. Combining path analysis methods and the objects’ coordinates generated in a video-augmented scene can help find the shortest or optimal path dynamically by taking an object’s position as a start or end point. This combination will play a role in predicting moving objects’ future trajectories and scheduling the related cameras in a 3D virtual scene, which is important in saving decision time, camera resources, and computational resources when assisting with decision support for 3D object tracking in an actual environment.
Based on the information in an AVE (foreground images, 3D coordinates, trajectories, object IDs, annotations, etc.), this paper focuses on analyzing the 3D motion of a moving object and predicting the paths it might take in a video-augmented virtual scene so as to schedule surveillance cameras in the real word and track objects continuously. This paper is organized as follows. The next section introduces several related studies, including research on AVEs, path analysis, path prediction and camera scheduling. Section 3 introduces the type, usage, and processing of the data used in this study. Section 4 describes the proposed methods in detail, including 3D motion analysis of moving objects, multi-path prediction and hierarchical visualization, and path-based multi-camera scheduling. Section 5 presents the results of multi-path prediction of a moving object and camera scheduling in an AVE, and analyzes the methods’ efficiency. Finally, the conclusion and future improvements are elaborated in Section 6.
2. Related work
The path prediction in an AVE to be carried out in this research involves video fusion, object-related 3D visualization, path analysis, path prediction, and camera scheduling.
2.1. Video fusion and object visualization in AVEs
Research on augmented virtual environments mostly focuses on the fusion of 3D scenes with video images and moving objects. The concept of AVE was first presented to fuse dynamic imagery with 3D models to support information extraction and analysis for an improved understanding of the scene (Neumann et al. Citation2003). A GIS-based system for augmented video surveillance (Milosavljević, Dimitrijević, and Rančić Citation2010) was developed to register geospatial data to outdoor video surveillance systems and retrieve information about viewed geospatial objects. A further integration of 3D GIS and video surveillance systems using augmented reality (AR) techniques has also been discussed (Milosavljević et al. Citation2016; Ma et al. Citation2018). Two models of integration (GIS-augmented video and video-augmented GIS) have been defined and a prototype has been implemented to serve as a basis for analyzing possible applications of real-world systems based on the integration of GIS and video. A topology-accounting method for multi-video fusion with 3D GIS scenes (Li et al. Citation2021) was proposed to project videos to topological models and rapidly identify rendered objects in 3D scenes.
As an important part of video, moving objects are extracted from videos and visualized as separate models in a 3D scene to prevent video distortions and give a better comprehension of both videos and virtual scenes. In an AVE system (Sebe et al. Citation2003), the moving objects are extracted and visualized as pseudo-3D elements to help observers comprehend videos and images from arbitrary views of the 3D scene. The moving objects were rendered to view-dependent texture-mapped billboards in a multiple sparse camera-based free view video system (Silva, Santos, and Morimoto Citation2011) so as to observe real scenes in a 3D virtual environment from any desired viewpoint. A realistic AVE with a wide field of view (Jian et al. Citation2017) was established by fusing multiple video textures together, visualizing a moving object as a 3D rectangle and drawing its trajectory along with the 3D object in a 3D scene. A prototype of the GIS and Moving Objects (GIS–MOV) system (Xie et al. Citation2017) was constructed using motion detection, moving object extraction, spatial mapping, and fusion patterns for GIS and moving object techniques. The integration of multi-camera video moving objects with GIS (Xie et al. Citation2019) can assist users in browsing video objects from multiple cameras.
The current developments of AVE-related video fusion and moving object visualization are quite good. Most research focuses on how to integrate the 3D scenes with video images or moving objects, subsequently visualizing what they have fused. However, there is a lack of analysis related to moving objects to serve practical solutions in the real world.
2.2. Path analysis and path prediction
Path analysis is a useful procedure in GIS for finding an optimal route between two points through continuous space that minimizes costs, and it can arise in various applications such as indoor and outdoor navigation, emergency evacuation, and path planning (Atila, Karas, and Abdul-Rahman Citation2013; Lin et al. Citation2013; Yang et al. Citation2016). Numerous path analysis algorithms have been implemented, especially in pgRouting, such as Dijkstra, Bi-directional Dijkstra, A* and Bi-directional A* (pgRouting Contributors Citation2018). With rich geospatial information, GIS has inherent resource advantages to carry out spatial path analysis for prediction of moving objects (pedestrian, cyclist, vehicle, metro flows, etc.) and mode choice (Cooper and Chiaradia Citation2020), urban travel behavior analyses and route prediction (Sun et al. Citation2014), and GIS vehicle path selection and routing (Wang and Wang Citation2014; Vu et al. Citation2019). Furthermore, path prediction methods in the field of computer vision have been mainly applied to predict the trajectory of moving objects in camera view for better obstacle avoidance, automatic driving and autonomous navigation (Russakovsky et al. Citation2015; Serrao et al. Citation2015; Li et al. Citation2017; Kooij et al. Citation2019).
However, the practice of using AVEs to conduct path analysis and path prediction remains limited. Combined with moving objects’ trajectories and 3D path networks, path analysis methods can play an important role in a video-augmented virtual scene, such as equivalent cost path analysis and optimal path planning for moving objects.
2.3. Camera scheduling
Camera scheduling is a key part of surveillance systems because the target in a specific area cannot be fully monitored even by a set of smart cameras without camera scheduling decisions at a given point in time (Jaenen et al. Citation2013). Especially in intelligent video surveillance systems that require different kinds of information processing within a strict time limitation, camera scheduling can allow system designers to flexibly assign execution times and application-derived utilities to tasks, track objects simultaneously through multiple cameras, and finally maximize total system utility (de Niz et al. Citation2013; El Maadi and Djouadi Citation2016). In the field of computer vision, camera scheduling methods have been widely used in multiple-object tracking (Ward and Naish Citation2009; Shih et al. Citation2012; Hong et al. Citation2020), surveillance area coverage selection (Guo et al. Citation2015), resource cost minimization (Gao et al. Citation2015; Aghdasi and Abbaspour Citation2016), and effective surveillance (Lin et al. Citation2016; Kumari et al. Citation2020). However, there are few studies on camera scheduling in AVEs and the integration of video and GIS. An AVE has 3D spatial analysis and simulation capabilities, as well as rich data resources such as 3D models and path networks, making it an innovative and helpful tool to schedule cameras and optimize resources in a video-augmented scene.
3. Data preparation and processing
The method in this study begins after the 3D visualization of a moving object, and focuses on motion analysis, path prediction, and camera scheduling guidance. The data used in 3D visualization of a moving object and the output data (coordinates, trajectories, etc.) are all taken as input data for this study. The introduction, usage, and processing of these data are listed in .
Table 1. Introduction, usage, and processing of the data used in this study.
The outdoor and indoor scenes of the test site were digitized into 3D models and loaded on a Digital Earth system according to their geographical coordinates. The surveillance cameras’ parameters (positions, orientations, attributes) were stored in a database and the camera models and annotations were also added to the 3D scene. shows the 3D virtual scene, camera annotations, and the captured video examples on the 5th and 8th floors.
Figure 1. 3D virtual scene, camera annotations, and video examples. (a) 3D models of the test site and the camera annotations. (b) A video frame on the 5th floor. (c) A video frame on the 8th floor.
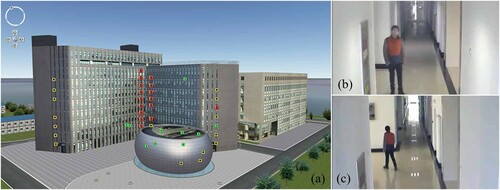
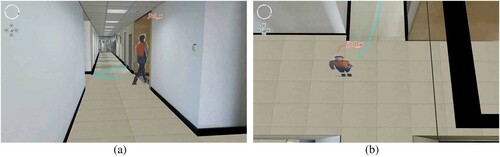
Extracting a moving object and visualizing it in the 3D virtual scene are basic preparations for 3D motion analysis and path prediction. In this study, a moving object was extracted from surveillance videos by a fast video object tracking method composed of a multi-threshold improved Gauss Mixed Model background difference algorithm and a foreground optimization algorithm based on HOG features and the SVM classifier. Then the extracted moving object was visualized as a rectangular polygon model and relocated in the augmented virtual scene by a moving object visualization method, including 3D modeling for the object, 3D coordinate calculation, model transformation, object texture projection, 3D position updates, and drawn trajectories (Jian et al. Citation2017). As shown in , the moving object model with a foreground image was located and updated according to the video data captured from the same place as (b). The sequential geographic coordinates were drawn out as a 3D line (trajectory) while updating the 3D position of the object model, and the object name was annotated along with the object model.
Figure 2. 3D visualization of a moving object. (a) Horizontal view. (b) Top view.
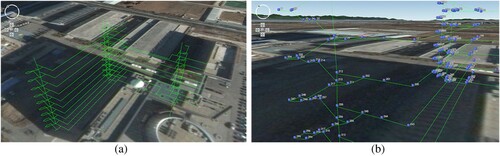
In order to apply 3D path analysis and path prediction, the 3D indoor paths were drawn in the virtual scene and imported into PostGIS (PostGIS Development Group Citation2021), which was used to create the topology of the indoor paths. This indoor path network contained 101 edges and 88 nodes, as shown in with 3D lines and points.
Figure 3. Indoor path network in the 3D virtual scene. (a) Overall view. (b) Edges and nodes.
4. Methodology
4.1. 3d motion analysis of moving objects
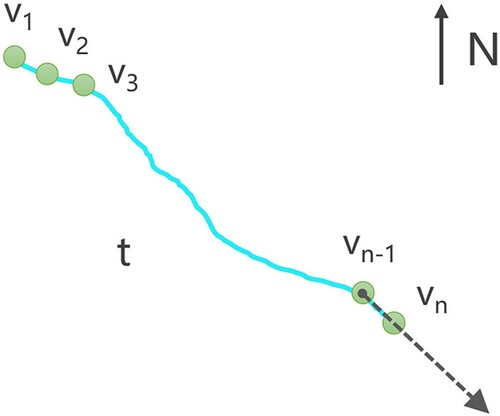
Trajectories generated during the 3D visualization of moving objects contain a lot of motion information, such as the 3D geo-coordinates, velocity, and direction of every moment, which can be used for motion analysis and path prediction of moving objects. As shown in , a 3D trajectory t is composed of n geo-coordinates vi (i=1, 2, … , n) and vn is the 3D geo-coordinates when the moving object left the camera view. The velocity and the vector of movement direction
are calculated as follows:
(1)
(1)
(2)
(2) where x, y are the values of longitude and latitude and Ti (i=1, 2, … , n) is the time of vi. The vector of movement direction
is represented as a dotted arrow line in .
Figure 4. Example of motion analysis of a trajectory.
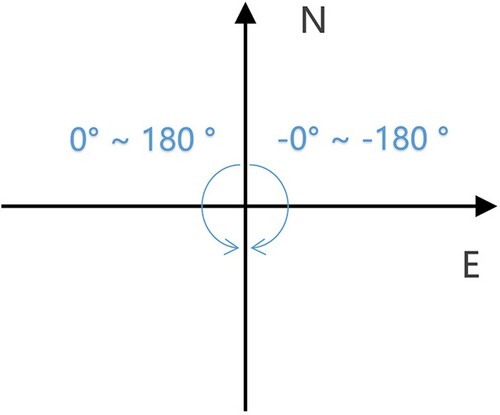
The angle of a movement direction in a 3D scene is represented the same way as a 3D model: the object’s geo-coordinates are taken as the origin, the East direction as the X axis, and the North direction as the Y axis. An angle of a movement direction ranges within [−180, 180], as shown in .
Figure 5. Angle representation of a movement direction.
4.2. Multi-path prediction and hierarchical visualization
Multi-path prediction aims to calculate some possible paths that a moving object may take after leaving the camera view. The 3D path network plays an important role in path prediction because it contains all the places that people can go (e.g. corridors, stairs, and elevator shafts). Combining the 3D trajectories, 3D path network, and results of the motion analysis, this paper proposes a multi-path prediction and hierarchical visualization method to predict some possible paths that a moving object may take after leaving the camera, sort these paths by their probabilities, and visualize them with different colors.
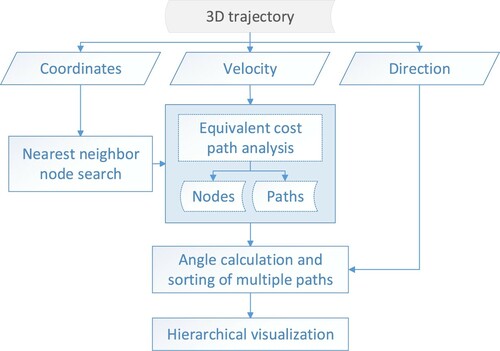
The workflow of multi-path prediction and the hierarchical visualization method is shown in , mainly composed of four parts: nearest neighbor node search, equivalent cost path analysis, angle calculation and sorting of multiple paths, and hierarchical visualization.
Nearest neighbor node search.
Figure 6. Workflow of multi-path prediction and hierarchical visualization.
Path analysis needs a start node that exists in the path network while the last point of a 3D trajectory (last place when the object leaves the camera view) is generally not in the path network. It is necessary to search the node closest to the last point of the trajectory—a 3D nearest neighbor search problem. Nearest neighbor is an important query and analysis method for spatial applications in computer science and geospatial science, and numerous techniques have been developed due to its popularity and potential (Suhaibah et al. Citation2016). In this study the last point of the 3D trajectory is taken as a center and one or more neighbor nodes of the path network is searched in the 3D space. The closest one is kept as the nearest neighbor node.
(2) Equivalent cost path analysis.
Taking the nearest neighbor node as the starting point, the possible paths and nodes that satisfy the condition of equal cost (equal time, equal distance, etc.) are searched in all directions. Since the nearest neighbor node is connected to edge(s) in the path network, there is at least one path that satisfies the condition.
(3) Angle calculation and sorting of multiple paths.
The orientation angles are calculated for the searched paths that start from the nearest neighbor node. The angle representation method is the same as 3D motion analysis of moving objects. The intersection angles between the movement direction and each orientation angle of the possible paths are calculated, and the multiple paths are sorted according to these intersection angles.
(4) Hierarchical visualization.
A hierarchy of classification and visualization is defined for the multiple possible paths. For example, the paths can be classified according to the intersection angles and visualized with different colors.
Hierarchies of classification and visualization for the multiple paths are shown in and . According to the intersection angle between the movement direction and the path orientation, the multiple paths are classified into three groups (Classes S1, S2, and S3) and visualized with different colors (red, magenta, and orange) that indicate the possibility of a path being adopted.
Figure 7. A hierarchy of classification and visualization for multiple paths.
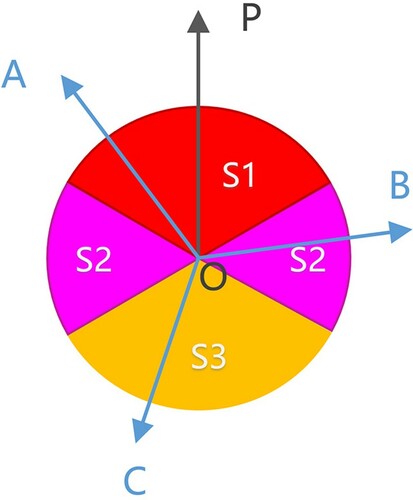
Table 2. A coloring scheme according to intersection angles.
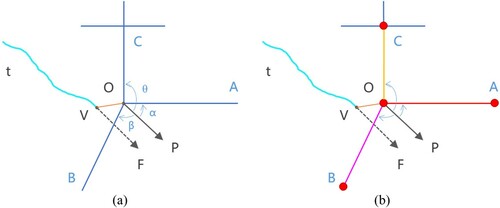
An example of multi-path prediction and hierarchical visualization is shown in , where V is the last point of the trajectory t when a moving object left the camera view; is the vector of the movement direction; node O is the nearest neighbor node to point V;
; and
,
and
are the results of equal cost path analysis, that is, the possible paths which may be taken by the object. According to the classification and visualization rules, the intersection angle of
and
is less than 60 degrees (Class S1), so
is the most likely path that the object may take, visualized as a red line. The intersection angle of
and
is between 60 and 120 degrees so it is classified as Class S2 and colored with magenta. In the same way,
is classified as Class S3 and colored with orange, which means it is the least likely to be chosen.
Figure 8. Example of multi-path prediction and hierarchical visualization. (a) Nearest neighbor node search, equal cost path analysis, and intersection angle calculation; (b) hierarchical visualization of multiple paths.
4.3. Path-based multi-camera scheduling
Camera scheduling and continuous object tracking are important tasks in video surveillance. A good camera scheduling method will help economize resources and track moving objects. Combining the predicted paths and cameras’ 3D coordinates, this paper proposes a path-based multi-camera scheduling method to predict which cameras the object may pass through and dispatch these cameras to detect moving objects specifically.
Establish the visibility relationships of camera positions and nodes of the 3D path network. Calculate which path nodes can be seen by a camera according to its 3D coordinates, attitude angles and field of view, and store the relations of node IDs, camera ID and camera preset angle in a database table. The main attribute fields of the relation table are shown in .
Search the cameras that the moving object may go through. These camera IDs can be queried from the relation table according to the possible path nodes calculated by the multi-path prediction and hierarchical visualization method.
Dispatch the chosen cameras and apply object tracking methods to them. For the static cameras, the attitude angles are fixed; the cameras with pan, tilt, and zoom (PTZ) are adjusted according to the preset angles in the relation table.
Figure 9. The main attribute fields of the relation table.
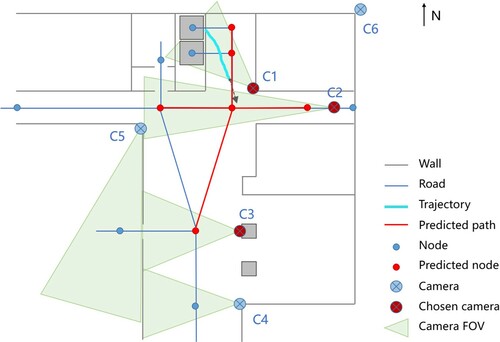
A diagram of this path-based multi-camera scheduling method is shown in . C1 to C6 are cameras and the fields of view (FOV) are drawn as light green; the blue lines and points are paths and nodes; the thick cyan line is a moving trajectory; the vector of movement direction is drawn as a black dashed arrow; and the predicted paths and nodes are colored with red. According to the predicted nodes and the visual relations between cameras and path nodes, the cameras that the moving object may go through are C1, C2, and C3, which are marked as chosen cameras and listed as the focus of object tracking.
Figure 10. Diagram of path-based multi-camera scheduling.
5. Result and discussion
5.1. Motion analysis and multi-path prediction
This study predicted multiple possible paths a moving object might take after leaving a camera’s view using the proposed 3D motion analysis, multi-path prediction, and hierarchical visualization methods, so that they can be used for camera scheduling and continuous object tracking.
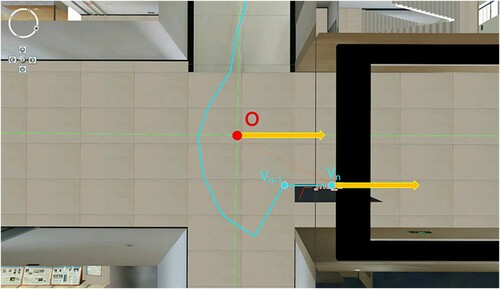
illustrates the process of 3D motion analysis of a moving object at a top view of (a). The cyan polyline is the moving object’s trajectory composed of n geo-coordinates in which and
are the last two points. The vector of the movement direction was carried out by (
,
) and shown as a yellow arrow, which is 22.3 degrees in the 3D scene.
Figure 11. 3D motion analysis of a moving object.
Taking the last point as the center, a 3D nearest neighbor node search method was used to get the 3D path node closest to the center, which is point O shown in . With point O as the starting point (N2), all nodes and paths that meet the condition of equal time cost in all directions were searched in the 3D path network. All angles of the searched paths around point N2 were calculated and compared with the vector of the movement direction, then visualized with different colors by the proposed path sorting and hierarchical visualization method. The paths from point N2 to the end nodes in each direction are listed in as well as the intersection angles and coloring schemes. As shown in , the position where the moving object left the camera’s view is highlighted by a yellow cylinder; the blue point annotations are the end points of the predicted paths that the object might take; and the paths are visualized with red, magenta, and orange according to the angles between the movement direction and start paths (from N2 to the second point in each path). The start angle of red paths (from N2 to an elevator node) is similar to the movement direction so they are most likely to be taken by the moving object, meaning the person will take an elevator up or down. The start angle of magenta paths (to go up or down the stairs) is approximately perpendicular to the movement direction so their possibilities come next. As the yellow paths are opposite to the movement direction, they are the least likely to be chosen.
Figure 12. Hierarchical visualization for multiple predicted paths.
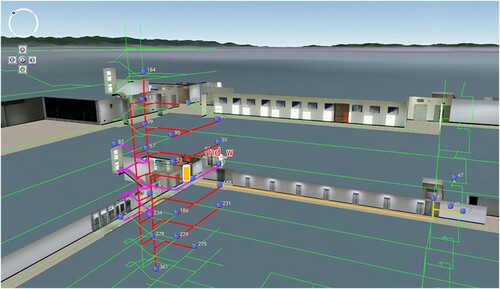
Table 3. Details of multiple predicted paths and coloring schemes.
5.2. Camera scheduling and continuous object tracking
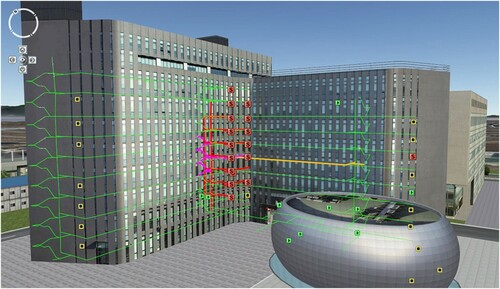
According to the visibility relationships of camera positions and 3D path nodes, the camera nodes that can see the predicted nodes are queried and given special surveillance for moving objects. As shown in , the red icon annotations are the chosen cameras along the predicted paths and nodes.
Figure 13. The cameras corresponding to the predicted path nodes.
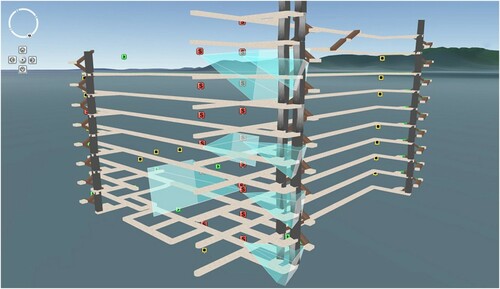
In order to clearly show the visibility relationships between a camera's field of view and a 3D path, this paper uses a translucent pyramid to represent a camera's visual range, and displays it together with the 3D path model created by a quaternion-based piecewise 3D modelling method for indoor path networks (Jian et al. Citation2019). As shown in , the translucent pyramids are created by the cameras’ 3D coordinates and attitude parameters, and the four pyramids on the right represent the cameras monitoring the elevators on the 1st, 3rd, 5th, and 8th floors.
Figure 14. The visibility relationship between the camera's visual range and the 3D path model.
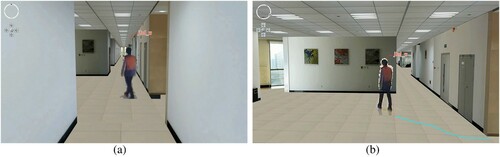
These chosen cameras were arranged to see the predicted paths and nodes, then the object tracking methods were applied to them. When the moving object is detected again in one of these cameras, it is continuously tracked and visualized using the proposed 3D motion analysis, multi-path prediction, hierarchical visualization, and path-based multi-camera scheduling methods. For example, after the object walked out of view of the camera on the 5th floor (), it was detected and re-identified by the camera on the 8th floor, and visualized in the 3D scene as shown in . The above steps are repeated to predict the possible paths and track the moving object continuously, forming a closed loop of 3D path prediction and continuous tracking of moving objects in a video-augmented indoor virtual environment.
Figure 15. Continuous tracking and 3D visualization of the moving object. (a) Camera’s view. (b) Side view.
5.3. Efficiency analysis
Accuracy and time consumption of path analysis as well as the performance of the 3D path prediction methods will affect the fluency of object tracking and the 3D rendering efficiency in a video-augmented indoor virtual environment.
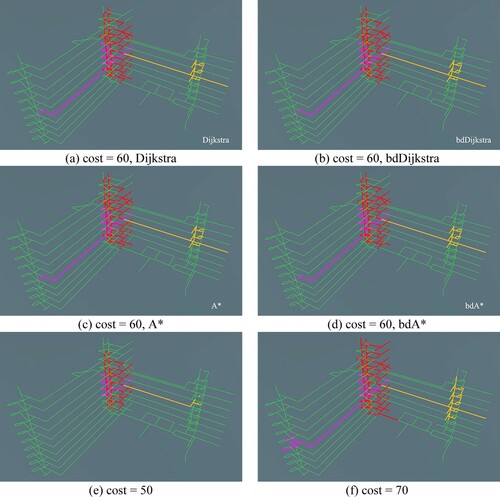
In this study, four path search algorithms, Dijkstra, Bi-directional Dijkstra (bdDijkstra), A* and Bi-directional A* (bdA*), were tested to predict multiple paths under three conditions when the cost equaled 50, 60, and 70 meters. The results showed that all four algorithms searched the same paths in the same cost situation, as shown in (a–d), and obtained the appropriate paths according to different conditions, as shown in (a,e,f). This is because once a weight was assigned to each path in the network, the result of the equivalent cost path analysis could be mathematically certain, and different algorithms could consume different time to obtain the same result.
Figure 16. Multiple path search by four algorithms under three cost conditions.
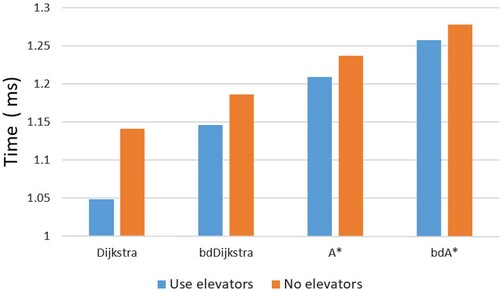
For the time consumption of the path analysis, the algorithms were compared in two situations when elevators were available and unavailable. As shown in , the algorithms cost less than 1.3 ms to get the optimal path, which means the path search algorithms can guarantee accuracy and real-time optimal path searches and not increase the burden of 3D scene rendering.
Figure 17. Time consumption of path search algorithms.
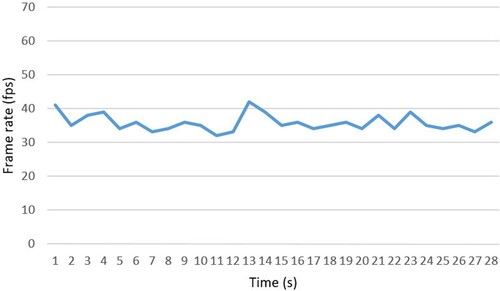
The frame rates of a video-augmented indoor scene with 295,000 triangles were recorded when running the proposed methods on a laptop with an NVIDIA GeForce GT 730M graphics card with 1 GB of memory. As shown in , the frame rate remained around 35 fps during 3D visualization and motion analysis of a moving object, prediction and hierarchical visualization of multiple paths, path-based multi-camera scheduling, and continuous object tracking. This result shows the proposed 3D motion analysis, 3D path prediction, and camera scheduling methods can meet the needs of real-time, efficient rendering of a video-augmented indoor virtual scene.
Figure 18. Frame rates of 3D path prediction and continuous tracking of moving objects in a video-augmented indoor virtual scene with 295,000 triangles.
6. Conclusion
This paper proposed a novel approach for 3D path prediction of moving objects in a video-augmented indoor virtual environment, which includes 3D motion analysis of moving objects, multi-path prediction and hierarchical visualization, and path-based multi-camera scheduling. These methods take video and 3D trajectories of a moving object as input data, analyze the moving object’s motion, predict and visualize the possible paths the moving object may take, and schedule the cameras in the virtual scene to provide solutions for continuous object tracking in the real world. The results show that these methods can give a closed-loop process, from 3D visualization of a moving object to 3D motion analysis, path prediction, camera scheduling, and 3D visualization of the moving object again. The path analysis algorithms proved to be accurate and fast, and the performance of the proposed method is good enough to maintain high rendering efficiency of a video-augmented indoor virtual scene.
The proposed approach was implemented with a test in this study, so there is still a long way to go before it can be applied in practice. As input conditions, the precision of the 3D path network and the accuracy of moving object localization determine the reliability of the predicted path. In practical applications, it is necessary to ensure that the 3D path network can cover all the entrances and exits and indoor paths, and that the algorithms for tracking and extracting moving objects from video are as accurate and efficient as possible. Furthermore, multiple objects should be taken into consideration because it is a common situation to track multiple objects at the same time or to track specific targets in a crowd. The authors are currently referring to mask-based deep learning object tracking methods such as Mask R-CNN (He et al. Citation2017) and SiamMask (Wang et al. Citation2019) to track and extract multiple objects accurately, and this will be discussed in future work.
Acknowledgements
The authors would like to thank the editors and anonymous reviewers for their valuable comments and suggestions. We also would like to thank Xiaoping Du, Jian Liu, Qin Zhan and Junjie Zhu for helpful discussions.
Disclosure statement
No potential conflict of interest was reported by the authors.
Data availability statement
Supplemental data for this article can be accessed at https://doi.org/10.6084/m9.figshare.14999175.v2.
Additional information
Funding
References
- Aghdasi, H. S., and M. Abbaspour. 2016. “Energy Efficient Area Coverage by Evolutionary Camera Node Scheduling Algorithms in Visual Sensor Networks.” Soft Computing 20 (3): 1191–1202. doi:https://doi.org/10.1007/s00500-014-1582-4.
- Atila, Umit, Ismail Rakip Karas, and Alias Abdul-Rahman. 2013. “Integration of CityGML and Oracle Spatial for Implementing 3D Network Analysis Solutions and Routing Simulation Within 3D-GIS Environment.” Geo-Spatial Information Science 16 (4): 221–237. doi:https://doi.org/10.1080/10095020.2013.867102.
- Cooper, C. H. V., and A. J. F. Chiaradia. 2020. “sDNA: 3-d Spatial Network Analysis for GIS, CAD, Command Line & Python.” Softwarex 12:100525. doi:https://doi.org/10.1016/j.softx.2020.100525.
- de Niz, D., L. Wrage, A. Rowe, R. Rajkumar, and Ieee. 2013. “Utility-Based Resource Overbooking For Cyber-Physical Systems.” 2013 IEEE 19th International Conference on Embedded and Real-Time Computing Systems and Applications (RTCSA), 217–226.
- El Maadi, A., and M. S. Djouadi. 2016. “Large-Scale Surveillance System: Detection and Tracking of Suspicious Motion Patterns in Crowded Traffic Scenes.” Automatika 57 (1): 173–187. doi:https://doi.org/10.7305/automatika.2016.07.881.
- Gao, Y. H., H. D. Ma, H. T. Zhang, X. D. Yang, N. Cao, and Ieee. 2015. “Minimizing Resource Cost for Camera Stream Scheduling in Video Data Center.” 2015 Ieee 7th International Conference on Cloud Computing Technology And Science, 210–217.
- Guo, L., Y. Q. Zhu, D. Y. Li, D. Kim, and Ieee. 2015. “PTZ Camera Scheduling for Selected Area Coverage in Visual Sensor Networks.” 2015 Ieee 35th International Conference on Distributed Computing Systems, 379–388.
- He, K. M., G. Gkioxari, P. Dollar, and R. Girshick. 2017. “Mask R-CNN.” 2017 Ieee International Conference on Computer Vision (ICCV):2980-8. doi:https://doi.org/10.1109/Iccv.2017.322.
- Hong, Y., Y. C. Wang, Y. Q. Zhu, D. Y. Li, Z. B. Chen, and J. Li. 2020. “3D Camera Sensor Scheduling Algorithms for Indoor Multi-Objective Tracking.” Journal Of Combinatorial Optimization 39 (3):899-914. doi:https://doi.org/10.1007/s10878-020-00532-0.
- Jaenen, U., H. Spiegelberg, L. Sommer, S. von Mammen, J. Brehm, J. Haehner, and Ieee. 2013. “Object Tracking as Job-Scheduling Problem.” 2013 seventh International Conference on Distributed Smart Cameras (ICDSC).
- Jian, Hongdeng, Xiangtao Fan, Jian Liu, Qingwen Jin, and Xujie Kang. 2019. “A Quaternion-Based Piecewise 3D Modeling Method for Indoor Path Networks.” Isprs International Journal of Geo-Information 8 (2): 89.
- Jian, Hongdeng, Jingjuan Liao, Xiangtao Fan, and Zhuxin Xue. 2017. “Augmented Virtual Environment: Fusion of Real-Time Video and 3D Models in the Digital Earth System.” International Journal of Digital Earth 10 (12): 1177–1196. doi:https://doi.org/10.1080/17538947.2017.1306126.
- Kooij, Jfp, F. Flohr, Eai Pool, and D. M. Gavrila. 2019. “Context-Based Path Prediction for Targets with Switching Dynamics.” International Journal of Computer Vision 127 (2): 1–24.
- Kumari, P., N. Nandyala, A. K. S. Teja, N. Goel, M. Saini, and Ieee Comp Soc. 2020. “Dynamic Scheduling of an Autonomous PTZ Camera for Effective Surveillance.” 2020 Ieee 17th International Conference on Mobile Ad Hoc And Smart Systems, 437–445.
- Li, C. M., Z. D. Liu, Z. J. Zhao, and Z. X. Dai. 2021. “A Fast Fusion Method for Multi-Videos with Three-Dimensional GIS Scenes.” Multimedia Tools and Applications 80 (2): 1671–1686. doi:https://doi.org/10.1007/s11042-020-09742-4.
- Li, Y. K., M. L. Mekhalfi, M. M. Al Rahhal, E. Othman, and H. Dhahri. 2017. “Encoding Motion Cues for Pedestrian Path Prediction in Dense Crowd Scenarios.” IEEE Access 5: 24368–24375. doi:https://doi.org/10.1109/ACCESS.2017.2772029.
- Lin, K. J., T. K. Hou, R. J. Chiu, and Ieee. 2016. “Jitter-Constrained Camera Scheduling in CCTV Surveillance Networks.” 2016 Ieee International Conference on Signal And Image Processing.
- Lin, Y. H., Y. S. Liu, G. Gao, X. G. Han, C. Y. Lai, and M. Gu. 2013. “The IFC-Based Path Planning for 3D Indoor Spaces.” Advanced Engineering Informatics 27 (2): 189–205.
- Ma, W., H. J. Xiong, X. F. Dai, X. W. Zheng, and Y. Zhou. 2018. “An Indoor Scene Recognition-Based 3D Registration Mechanism for Real-Time AR-GIS Visualization in Mobile Applications.” Isprs International Journal of Geo-Information 7 (3), doi:https://doi.org/10.3390/ijgi7030112.
- Milosavljević, A., A. Dimitrijević, and D. Rančić. 2010. “GIS-augmented Video Surveillance.” International Journal of Geographical Information Science 24 (9): 1415–1433. doi:https://doi.org/10.1080/13658811003792213.
- Milosavljević, Aleksandar, Dejan Rančić, Aleksandar Dimitrijević, Bratislav Predić, and Vladan Mihajlović. 2016. “Integration of GIS and Video Surveillance.” International Journal of Geographical Information Science, 1–19. doi:https://doi.org/10.1080/13658816.2016.1161197.
- Neumann, U., You Suya, Hu Jinhui, Jiang Bolan, and Lee JongWeon. 2003. “Augmented Virtual Environments (AVE): Dynamic Fusion of Imagery and 3D Models.” Paper presented at the IEEE virtual reality, 2003. proceedings, 22-26 March 2003.
- pgRouting Contributors. 2021. “pgRouting Manual Release v2.6.0.” pgRouting Contributors. Retrieved 10:20, June 10, 2021, from https://docs.pgrouting.org/pdf/en/pgRoutingDocumentation-2.6.0.pdf, Accessed June 10, 2021.
- PostGIS Development Group. 2021. “PostGIS 3.1.4dev Manual.” The PostGIS Development Group. Tue 06 Jul 2021 01:47:05 PM UTC, from http://postgis.net/docs/, Accessed July 9, 2021.
- Russakovsky, O., J. Deng, H. Su, J. Krause, S. Satheesh, S. Ma, Z. H. Huang, et al. 2015. “ImageNet Large Scale Visual Recognition Challenge.” International Journal of Computer Vision 115 (3): 211–252. doi:https://doi.org/10.1007/s11263-015-0816-y.
- Sebe, Ismail Oner, Jinhui Hu, Suya You, and Ulrich Neumann. 2003. “3D Video Surveillance with Augmented Virtual Environments.” First ACM SIGMM international workshop on Video surveillance, 107–112. Berkeley, California: ACM.
- Serrao, M., S. Shahrabadi, M. Moreno, J. T. Jose, J. I. Rodrigues, J. M. F. Rodrigues, and J. M. H. du Buf. 2015. “Computer Vision and GIS for the Navigation of Blind Persons in Buildings.” Universal Access in the Information Society 14 (1): 67–80. doi:https://doi.org/10.1007/s10209-013-0338-8.
- Shih, H. C., H. W. Lee, C. L. Huang, Y. C. Liu, and Ieee. 2012. “Collaborative Real-Time Scheduling for Multiple Objects Tracking in PTZ Camera Network.” IEEE International Symposium on Intelligent Signal Processing And Communications Systems.
- Silva, J. R., T. T. Santos, and C. H. Morimoto. 2011. “Automatic Camera Control in Virtual Environments Augmented Using Multiple Sparse Videos.” Computers & Graphics-UK 35 (2): 412–421. doi:https://doi.org/10.1016/j.cag.2011.01.012.
- Suhaibah, A., A. A. Rahman, U. Uznir, F. Anton, and D. Mioc. 2016. “Improving Nearest Neighbour Search In 3d Spatial Access Method.” 3rd International Geoadvances Workshop 42-2 (W1), 69–73. doi:https://doi.org/10.5194/isprs-archives-XLII-2-W1-69-2016.
- Sun, D., C. Zhang, L. H. Zhang, F. X. Chen, and Z. R. Peng. 2014. “Urban Travel Behavior Analyses and Route Prediction Based on Floating Car Data.” Transportation Letters-the International Journal Of Transportation Research 6 (3): 118–125. doi:https://doi.org/10.1179/1942787514y.0000000017.
- Vu, H. L., D. Bolingbroke, K. T. W. Ng, and B. Fallah. 2019. “Assessment of Waste Characteristics and Their Impact on GIS Vehicle Collection Route Optimization Using ANN Waste Forecasts.” Waste Management 88: 118–130. doi:https://doi.org/10.1016/j.wasman.2019.03.037.
- Wang, M. L., and X. P. Wang. 2014. “Study on UGV Path Selection Method Based on GIS Database.” 2014 International Conference on Connected Vehicles And Expo, 705–710.
- Wang, Q., L. Zhang, L. Bertinetto, W. M. Hu, and P. H. S. Torr. 2019. “Fast Online Object Tracking and Segmentation: A Unifying Approach.” 2019 ieee/Cvf Conference on Computer Vision And Pattern Recognition (Cvpr 2019), 1328–1338. doi:https://doi.org/10.1109/Cvpr.2019.00142.
- Ward, C. D. W., and M. D. Naish. 2009. “Scheduling Active Camera Resources for Multiple Moving Targets.” 2009 Ieee 22nd Canadian Conference on Electrical And Computer Engineering, Vols 1 And 2.
- Xie, Y. J., M. Z. Wang, X. J. Liu, B. Mao, and F. Y. Wang. 2019. “Integration of Multi-Camera Video Moving Objects and GIS.” Isprs International Journal of Geo-Information 8 (12), doi:Artn 561 https://doi.org/10.3390/Ijgi8120561.
- Xie, Y. J., M. Z. Wang, X. J. Liu, and Y. G. Wu. 2017. “Integration of GIS and Moving Objects in Surveillance Video.” Isprs International Journal of Geo-Information 6 (4), doi:Artn 94 https://doi.org/10.3390/Ijgi6040094.
- Yang, Liang, Juntong Qi, Dalei Song, Jizhong Xiao, Jianda Han, and Yong Xia. 2016. “Survey of Robot 3D Path Planning Algorithms.” Journal of Control Science & Engineering 2016 (pt.1): 7426913.1-.22.