
 ?Mathematical formulae have been encoded as MathML and are displayed in this HTML version using MathJax in order to improve their display. Uncheck the box to turn MathJax off. This feature requires Javascript. Click on a formula to zoom.
ABSTRACT
As one of the most severe natural disasters in the world, floods caused substantial economic losses and casualties every year. Timely and accurate acquisition of flood inundation extent could provide technical support for relevant departments in the field of flood emergency response and disaster relief. Given the accuracy of existing research works extracting flood inundation extent based on Synthetic Aperture Radar (SAR) images and deep learning methods is relatively low, this study utilized Sentinel-1 SAR images as the data source and proposed a novel model named flood water body extraction convolutional neural network (FWENet) for flood information extraction. Then three classical semantic segmentation models (UNet, Deeplab v3 and UNet++) and two traditional water body extraction methods (Otsu global thresholding method and Object-Oriented method) were compared with the FWENet model. Furthermore, this paper analyzed the water body area change situations of Poyang Lake. The main results of this paper were as follows: Compared with other five water body extraction methods, the FWENet model achieved the highest water body extraction accuracy, its F1 score and mean intersection over union (mIoU) were 0.9871 and 0.9808, respectively. This study could guarantee the subsequent research on flood extraction based on SAR images.
1. Introduction
As one of the most devastating natural disasters globally, floods caused a large number of casualties and economic losses worldwide (Liang and Liu Citation2020; Chen Citation2017). According to the ‘Bulletin of Flood and Drought Disasters in China' released by the Ministry of Water Resources of the People's Republic of China, from 1998 to 2019, the average annual direct economic loss caused by floods in China was as high as 168.288 billion yuan and 1288 death per year (http://www.mwr.gov.cn). Apparently, floods have brought massive losses to China's economic development and people's lives. Therefore, timely and accurate acquisition of the spatial and temporal distribution of flood inundation is of great importance for relevant departments to formulate disaster relief plans and post-disaster damage assessment (Kang et al. Citation2018).
At present, the main methods of flood monitoring include hydrological station monitoring and remote sensing monitoring. Among them, the hydrological station monitoring method has a high accuracy rate, however, with the shortage of the number of stations, this method could not monitor the spatial distribution situation in a large area. Remote sensing technology has gradually become the primary method of flood monitoring due to its advantages, such as high temporal resolution and the ability to monitor spatial distribution (Guo and Zhao Citation2018; Rattich, Martinis, and Wieland Citation2020). However, due to the bad weather when floods occur, optical sensors tend to be affected by thick clouds and rain, therefore, it is difficult to provide high-quality optical images without clouds during floods (Li et al. Citation2017; Zhang et al. Citation2020). Recently, Synthetic Aperture Radar (SAR) plays an increasingly important role in flood monitoring because of its ability to all-day working, and its insusceptibility of bad weather conditions such as clouds and rain (Zhang et al. Citation2016; Sun et al. Citation2017; Rahman and Thakur Citation2015).
To date, flood extraction methods based on SAR images mainly include thresholding-based methods (Chen, Liu, and Zhang Citation2014; Pang Citation2016), object-oriented method (Tang et al. Citation2018), active contour method (Tong et al. Citation2018; Zhan Citation2020) and data fusion methods (Xiong et al. Citation2012; Addabbo et al. Citation2016). However, due to the defects of SAR images such as speckle noise and uneven gray-scale distribution (Hu and Hua Citation2020), when it comes to the large area, the traditional SAR data flood monitoring methods can't well meet the requirements. In this context, the combination of SAR data and intelligent water body extraction algorithms has gradually become a hot issue.
Till now, deep learning algorithms are mainly applied in numerous tasks such as semantic segmentation, target detection and image classification, and have achieved good results. With the advantage of avoiding the complex feature selection process, the deep learning methods have strong applicability in the process of multi-band remote sensing images information extraction (Guo et al. Citation2020). In 2015, Long, Shelhamer, and Darrell (Citation2015) proposed a semantic segmentation method based on fully convolutional network (FCN), which solved image segmentation at the semantic level and classified images at the pixel level. FCN was the first convolutional neural network for semantic segmentation. However, the network had flaws, such as simple up-sampling operation and loss of detailed information. Afterward, Ronneberger, Fischer, and Brox (Citation2015) improved the FCN network and proposed a U-Net network with encoding and decoding structure, which could merge the features of low resolution and high resolution and improved the accuracy of image segmentation has been greatly improved. Now, scholars globally have proposed many classic semantic segmentation models to improve the accuracy and performance of semantic segmentation, such as Deeplab v3 (Chen et al. Citation2017), UNet++ (Zhou et al. Citation2018), HRNet (Sun et al. Citation2019) and other models.
In recent years, deep learning models have been gradually applied in water body extraction from remote sensing images. For example, Chen et al. (Citation2015) used convolutional neural networks to extract water body, and demonstrated the effectiveness of deep learning methods in water body extraction by comparing with traditional methods such as the normalized difference water index (NDWI). Chen et al. (Citation2018) designed a new convolutional neural network to extract urban surface water body from high-resolution remote sensing images, and obtained high water body extraction accuracy. Wang et al. (Citation2020) proposed a multi-scale lake water body extraction network, which performed well in extract small lake water body. Nemni et al. (Citation2020) designed a convolutional neural network for flood mapping, which realized fully automatic rapid flood monitoring. Peng et al. (Citation2021) proposed a self-supervised learning framework for urban flood mapping, which improved the accuracy of urban flood monitoring. However, these existing deep learning models in water body extraction mainly focused on the optical remote sensing images. In addition, the water body extraction accuracy in using SAR images is relatively low. Furthermore, defeats including the difficulty in distinguishing water body and shadows, small water body and rivers extracted incompletely also limit the application of water body extraction products. Same as optical remote sensing images, the key of SAR images in flood monitoring also lies in the identifying and extracting of water body information (Zhou Citation2018).
In response to these problems, this study proposed a novel flood water body extraction convolutional neural network (FWENet) based on SAR images. Specifically, this model was composed of an encoding-decoding network. In the encoder, the Residual Network (ResNet) was firstly utilized. Then, the encoded feature maps were input into the dilated convolution under different dilation rates, and the different scales were used to extract deep semantic features. In the decoder, the small-size feature maps were decoded to the original size. What's more, the FWENet model adopted the spatial and channel squeeze & excitation (Scse) attention mechanism, which further improved the accuracy of the model prediction. Finally, the flood information from multi-period SAR data was extracted based on the FWENet model.
2. Materials and methods
2.1. Study area
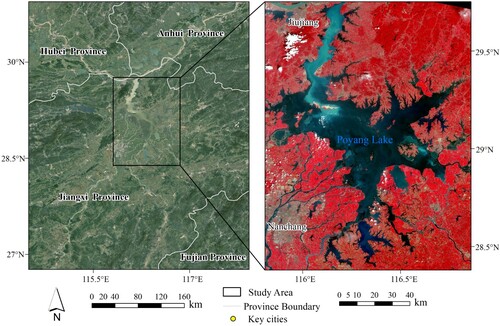
Poyang Lake is the largest freshwater lake in China, which is located in the north of Jiangxi Province and the south bank of the middle and lower reaches of the Yangtze River, with the geographical range of 28°22′N∼29°45′N and 115°47′E∼116°45′E (). The shoreline of Poyang Lake is about 1200 km, covering a basin area of about 162,000 km2 (Wang et al. Citation2019). There are five major rivers in the basin, Ganjiang, Fuhe, Xinjiang, Raohe, and Xiuhe (five rivers), which are injected into Poyang Lake from east, west and south, and then injected into the Yangtze River from the river-lake junction of Hukou after impounding (Wang and Liao Citation2010), thus formed a complete water system of Poyang Lake. When the Yangtze River basin encounters continuous heavy rainfall, the water-level of Poyang Lake will rise rapidly with the injection of upstream river water and the backflow of Yangtze River water, and floods are prone to occur. In addition, Poyang Lake is one of the most important wetlands in China, which plays an essential role in flood and drought prevention, species conservation, water purification, and climate regulation in the middle and lower reaches of the Yangtze River (Huang, Xu, and Li Citation2018; Zheng et al. Citation2021).
Figure 1. The location of Poyang Lake in China. The left image is Google Earth Image. The right image is Landsat 8 Image on 6 September 2020.
2.2. Data pre-processing
The Sentinel-1 SAR satellites, developed by the European Space Agency (ESA), consisting of two satellites (A and B), have a minimum revisit period of 6 days, a maximum width of 400 km, and a maximum spatial resolution of 5 m. It has four imaging modes (Yang, Yang, and Jiang Citation2015). Sentinel-1 SAR images have gradually become an important data source in monitoring the spatial and temporal distribution of floods due to the advantages of good data quality and high resolution. From July to August 2020, influenced by the incoming water from the upstream of the Yangtze River and continuous heavy rainfall, the water level of Poyang Lake rose rapidly, and severe floods occurred in the basin. The floods inundated large areas of farmland and infrastructure and caused severe damage to the Poyang Lake basin. Combined with the related reports of the Poyang Lake flood disaster in 2020, the study selects 6 dual-polarized Sentinel-1 SAR images, the product type is GRD, the imaging time was from 20 June 2020 to 31 August 2020. The detailed information of Sentinel-1 SAR images was shown in . After that, this study adopted the Sentinel data processing software SNAP provided by ESA to pre-process the Sentinel-1 SAR images to obtain the backscatter distribution map of the study area with 10 m spatial resolution dual polarization. The specific pre-processing steps included orbit correction, thermal noise removal, radiometric calibration, filtering, topography correction, clipping and mosaic processing.
Table 1. Detailed information of Sentinel-1 SAR images used in this study.
2.3. Methods
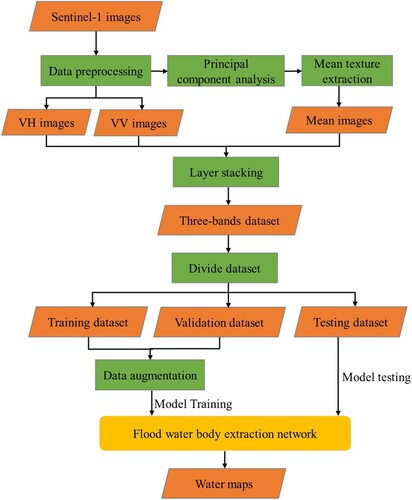
After the SAR images pre-processing was completed, firstly, the Sentinel-1 dual-polarization images and the derived mean texture image were combined into a new image with three bands. Secondly, the obtained new image was divided into training dataset, validation dataset and testing dataset, the data-augmented training dataset and validation dataset were input into the FWENet model for training. Finally, a variety of evaluation indicators were used to quantitatively evaluate the water body extraction accuracy of the FWENet model in the testing dataset. The specific flowchart of this study is shown in .
Figure 2. Flowchart of this study.
2.4. Model structure
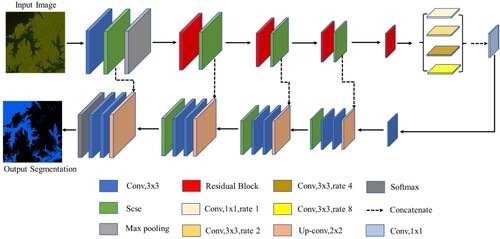
In this study, the FWENet model was proposed for flood information extraction of SAR images, and its model structure was shown in . Inspired by the U-Net model, the FWENet model adopted an encoding and decoding structure, in which the encoding part used the Resnet18 network, and then the feature maps obtained from the encoder were input into the dilated convolution with dilated rates of 1, 2, 4, and 8, respectively, with four types scale to extract deep semantic features. The decoding part restored the small size feature maps to original size, thereby obtaining water body segmentation maps. During the encoding and decoding process, the output of each layer was input into the Scse attention mechanism, which further improved the accuracy of the model prediction. Each convolutional layer was connected to a batch normalization (BN) layer (Badrinarayanan, Kendall, and Cipolla Citation2017), accelerating the speed of model learning.
Figure 3. The structure of the FWENet model.
2.4.1. Residual network
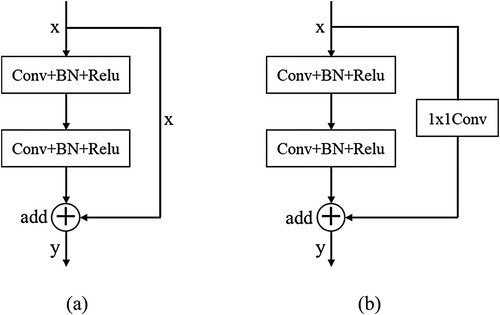
The deep network could obtain rich semantic features. However, increasing the network depth simply will cause the gradient loss or gradient explosion problem. Meantime, as the network depth increases, the network performance will degrade. To solve this problem, He et al. (Citation2017) proposed the residual neural network (Resnet). The core of Resnet is the residual learning module. shows two typical residual learning modules. By inputting the feature maps into the residual learning module, the channels are summed with the original feature maps after convolution to compensate for the vanishing gradients, as shown in (a). The feature maps are input into the residual learning module, and the size of the feature maps and the number of channels change after convolution, so 1 × 1 convolution is required to adjust the size and number of channels of the original feature maps, as shown in (b). Nowadays, the Resnet network has become the main feature extraction network in the field of semantic segmentation. There are mainly five Resnet networks: Resnet18, Resnet34, Resnet50, Resnet101 and Resnet152. In order to reduce the complexity of the network model and speed up the model processing, the Resnet18 network is used to extract the main features in this study.
Figure 4. The structure of two typical residual learning modules.
2.4.2. Dilated convolution
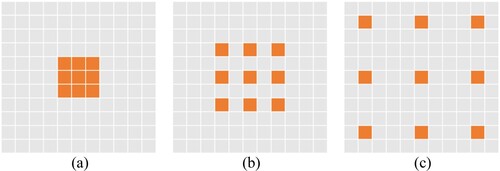
In order to solve the problem of the feature map resolution reduction and information loss caused by down-sampling operations in convolutional neural networks, Yu and Koltun (Citation2016) proposed dilated convolution. Dilated convolution expands the receptive field of the convolution kernel by filling a certain number of 0 elements between the convolution kernels. The number of filling depends on the parameter of the dilation rate. Dilated convolution with different dilation rates is shown in , where the convolution kernel with the dilation rate of 1 can be regarded as a standard convolution kernel. Dilated convolution with different dilation rates has different receptive fields, and different receptive fields are vital for distinguishing mountain shadows and water body with similar spectral features. In the atrous spatial pyramid pooling (ASPP) module of the Deeplab v3 network, dilation rates of the dilated convolution are set to 1, 6, 12, and 18, respectively. The dilation rate is too large and too much feature information is lost for the small water body. In this study, dilated convolution with dilation rates of 1, 2, 4, and 8 are combined to extract semantic features at different scales. Appropriately reducing the dilation rate can capture more feature information of small water body and rivers, and the extraction of water body edges is more complete.
Figure 5. Dilated convolution kernels with different dilation rates. (a) Dilation rate = 1 (b) Dilation rate = 2 (c) Dilation rate = 4.
2.4.3. Scse
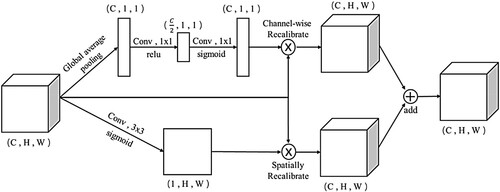
The attention mechanism aims to make the computer ignore irrelevant information and focus on the key information just like the human brain does. Because attention can extract more semantic features, it is widely used in semantic segmentation tasks. There are not only vast lakes, but also small water body and ponds in remote sensing images. The different sizes of the water body and the complex inundation scenes during flood disasters have extensively tested the robustness and generalization of convolutional neural networks. Consequently, this study introduces the Scse (Roy, Navab, and Wachinger Citation2018) attention mechanism to improve the accuracy of network model prediction further. The structure of the Scse module is shown in . The upper part of is the channel attention (CSE) module, which first performs a global average pooling operation on the input feature map, then the feature maps obtained after two 1 × 1 convolutions are activated using Relu and Sigmoid functions, respectively, and finally information correction utilizing channel multiplication. The bottom part of is the spatial attention (SSE) module, which first performs a 3 × 3 convolution operation on the input feature map, followed by activation using the Sigmoid function, and finally spatial information correction using spatial multiplication n. The Scse module combines the SSE module with the CSE module. The feature map of size C × H × W is input to the Scse module, and the size of the output feature map remains C × H × W. The Scse module is added after each convolution layer without changing the dimensionality of the feature map. The purpose is to fine-tune the water body edge of the feature map.
Figure 6. The structure of Scse module.
2.5. Accuracy assessment
In this study, we select five indicators: Precision, Recall rate, F1 score, Intersection over Union (IoU) and mIoU to evaluate the water body extraction accuracy of the FWENet model. The F1 score comprehensively considers the Precision and Recall rate, and the higher the value, the better the model extraction effect. The mIoU comprehensively considers the model extraction water body IoU and non-water body IoU, and the higher value indicates the better model extraction effect. Both the F1 score and mIoU are the comprehensive evaluation indicators to measure the network model.
(1)
(1)
(2)
(2)
(3)
(3)
(4)
(4)
(5)
(5) where n refers to the number of model prediction categories, TP refers to the number of ground water body pixels, which the network model also predicts as water body, FP refers to the number of ground non-water body pixels predicted by the network model as water body, FN refers to the number of ground actual water body pixels which predicted by the network model as non-water body.
3. Experiment and result
3.1. Samples generation
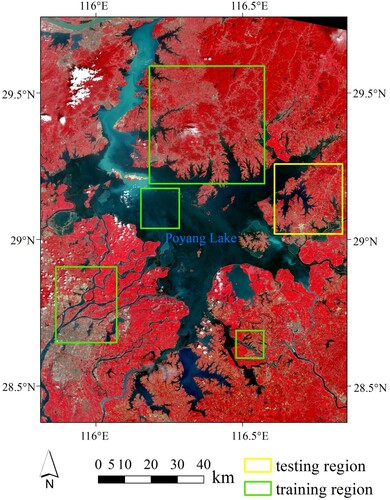
The randomly distributed speckle noise on SAR images affects the production of experimental samples. Therefore, this study obtains water samples by visual interpretation with high-resolution optical remote sensing images. In addition, it is challenging to have high-quality optical remote sensing images due to cloudy weather and heavy rainfall during floods. The commonly used high-resolution optical remote sensing images include GF-1, GF-2, Sentinel-2 images, etc. This study uses Sentinel-2 images covering the study area on 23 July 2020 to assist visual interpretation to make samples. In addition, considering the limited polarization data of Sentinel-1, this study introduces a mean texture feature to enrich the model features. First, principal component analysis was performed on the dual-polarization data of Sentinel-1 (Liu et al. Citation2019), and then performed mean filtering on the first principal component of the principal component analysis, which contained the most information, with a window size of 3 × 3, in order to obtain the mean texture feature. The mean feature reflected the regularity of the texture and alleviated the noise on the SAR image to a certain extent. Since the VH, VV and mean texture images were in a different intensity scale, this study stretched these images linearly to the gray range of 0–255. Then the Sentinel-1 dual-polarization data and the derived mean texture data were combined into a new image with three bands. In the study, specific regions were clipped from the obtained three-band images as training and testing images, and the training and testing regions were shown in . Samples from multiple training regions could improve the generalization of the network model. Afterwards, the training images and testing images were marked with water samples in ArcMap 10.4 software, followed by regular grid clipping and data augmentation of the images and corresponding labeled images. Data augmentation included horizontal flip, vertical flip and diagonal mirroring operations on images and corresponding label images. Data augmentation was to obtain sufficient samples and avoid over-fitting during model training. Finally, 1808 training samples, 452 validation samples and 132 testing samples with 256 × 256 resolution were obtained in this study.
Figure 7. Training region and testing region.
3.2. Model training
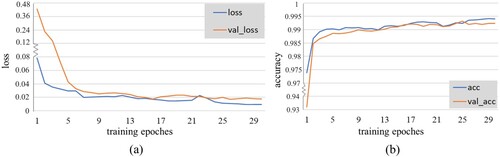
Due to a large amount of computation and numerous deep learning parameters, the software for experiments has high requirements. In terms of the software environment, the programming language used in the experiment is Python, and the Keras deep learning framework is selected as the tool to build the network model. The dependent libraries used in the programming process mainly included CUDA and GDAL. Through multiple iterative experiments, the experiment finally got the appropriate hyperparameters. Namely, the number of iterations was set to 30, the batch size was set to 8, Adam was selected as the optimizer, the initial learning rate was set to 10–4, and the Relu activation function was selected. The cross-entropy loss function was used for model training. The model finally converged after iterative training, and achieved 99.18% and 99.34% classification accuracy on the training and validation dataset, respectively, and the training curves were shown in .
Figure 8. The training loss curves and accuracy curves. (a) Loss curves (b) accuracy curves.
3.3. Model testing
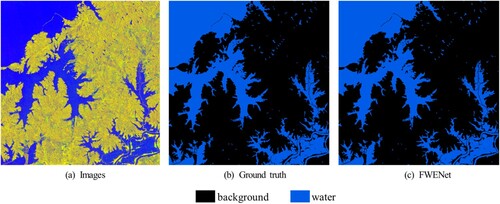
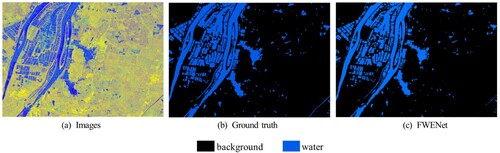
The study chose a testing region with 2661 × 2584 resolution () to measure the water body extraction capability of the FWENet model. The testing dataset was input into the trained FWENet model to generate a water body segmentation binary map, as shown in (c). The water body result map predicted by the FWENet model was compared with the corresponding labeled images, the precision of the FWENet model in the testing dataset was 98.99%, the recall rate was 98.42%, the F1 score was 98.71%, and the IoU was 97.44%, the mIoU was 98.08%. It could be seen that deep learning has strong potential in flood information extraction. The water body extraction results of the FWENet model in the testing area were shown in . As can be seen from , the FWENet model could extract not only an extensive range of water body, but also small rivers and water body. That’s to say, the model has strong robustness.
Figure 9. The extract results of FWENet in the testing region.
3.4. Model application
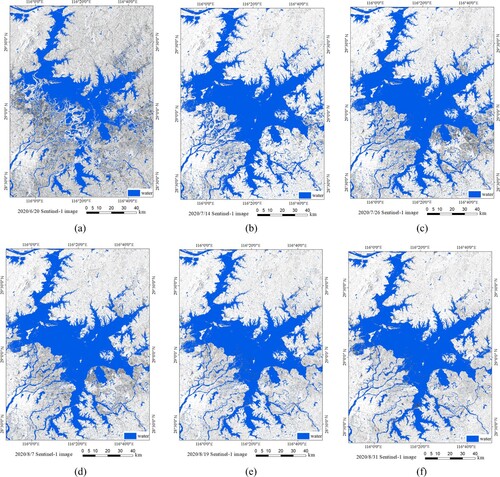
Based on the FWENet model, this study inputted the multiple temporal Poyang Lake Sentinel-1 SAR images into the trained deep learning model for prediction, and obtained the water body information spatial distribution map of six phases of Poyang Lake. Due to the influence of image noise, wind and waves, bridges, ships and other factors, the extracted water body contained some holes or voids. For this reason, this study used mathematical morphological operations to postprocess the water body extraction results, the specific morphological operations mainly included corrosion, expansion, etc. The final processing of six-phase water body extraction results was shown in .
Figure 10. The water body extraction results of FWENet in Poyang Lake.
3.5. Water area analysis
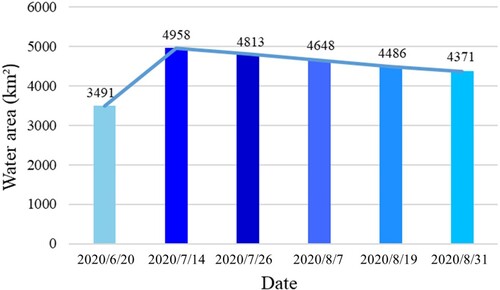
was the water area change diagram of Poyang Lake in each period. It could be found that the water body area in the study area showed the changing trend of ‘steep rise and slow fall’ in the whole period. The water body area firstly increased rapidly from 3491 km² on 20 June to 4958 km² on 14 July, and then decreased slowly to 4371 km² on 31 August due to the influence of the high water-level of Yangtze River, flooding was not smooth. Regarding the temporal rate of change, during 20 June and 14 July, the water body area increased by 1487 km², with an average daily increase of 61.1 km². During 14 July and 31 August, the water body area decreased 587 km², with an average daily fall of 12.2 km². The slow fall in the water-level of Poyang Lake brought tremendous pressure to the flood fighting and disaster relief in Jiangxi Province.
Figure 11. The changes of water area in the study area.
3.6. Model generalizability
Hongze Lake is the fourth largest freshwater lake in China, which is located in the lower reaches of the Huai River and the west of Jiangsu Province. In July 2020, flood in the upper reaches of the Huai River continued to enter Hongze Lake, causing the water level of Hongze Lake to rise rapidly. This paper collected Sentinel-1 image during the Hongze Lake flood disaster on 22 July 2020 to test generalization of the FWENet model. After the same processing, input the Sentinel-1 image in Hongze Lake into the previously trained FWENet model, and the model prediction result was shown in .
Figure 12. The water body extraction result of FWENet in Hongze Lake.
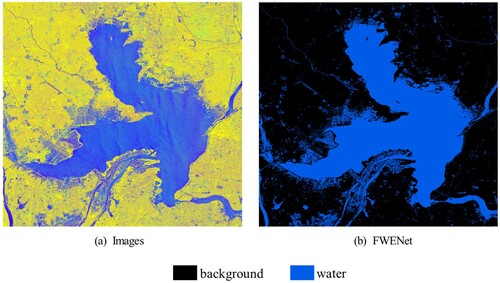
The study chose a testing region with 1383 × 1926 resolution () to evaluate the generalization of the FWENet model. The water body result () predicted by the FWENet model was compared with the labeled image (), the F1 score and mIoU of the FWENet model in the testing region was 94.52% and 93.58%, respectively. It can be seen from and the model has a strong generalization.
Figure 13. The extract results of FWENet in the testing region.
4. Discussion
4.1. Comparison of different methods
In order to validate the water body extraction accuracy of the FWENet model, this study compares its results with the extraction results of the Otsu global threshold method and object-oriented method. The extraction accuracy evaluation of different methods in the testing area was shown in . The results showed that the Otsu global thresholding method had the highest precision and better water body extraction result. However, when the thresholding method extracted large area remote sensing images, the water body results were relatively fragmented, and it was difficult to extract small water body. The F1 score and mIoU of the object-oriented method were both the lowest, and the segmentation rules and classification rules of the object-oriented method required much prior knowledge and were challenging to find suitable rules. The FWENet model had the highest F1 score and mIoU, and the best extraction of the water body.
Table 2. Accuracy comparison of different methods in the testing region.
4.2. Comparison of different models
In order to compare FWENet model with classic semantic segmentation models such as UNet, Deeplab v3, and UNet++, this study used the same training samples to train these convolutional neural networks, the quantitative evaluation results were shown in . The results showed that the precision of the FWENet model was second only to UNet++, and the recall rate was second only to UNet, and had the highest accuracy in the three indicators of F1 score, IoU and mIoU. It could be seen that the FWENet model was superior to other methods in flood extraction ability and had the highest extraction accuracy.
Table 3. Accuracy comparison of different models in the testing region.
4.3. Comparison of different features
Considering the limited dual-polarization data of Sentinel-1, this study introduced the mean texture feature to enrich the model features. In this study, the variance texture, skewness texture, elevation, slope and SDWI (Jia et al. Citation2019) features were superimposed with Sentinel-1 dual-polarization data to form three-band images to compare the water body extraction accuracy of different features in the testing dataset. The quantitative evaluation results were shown in . The results showed that the mean texture feature introduced in this study had the highest extraction accuracy, followed by the variance texture feature, slope feature, skewness feature, elevation feature, and SDWI feature in order.
Table 4. Accuracy comparison of different features in the testing region.
4.4. Ablation experiment
Although the FWENet model had the highest extraction accuracy among other water body extraction methods, what is the key element in improving the performance? Therefore, we designed an ablation experiment. The experimental results were shown in . The results showed that the F1 score and mIoU of the FWENet model without Dilated Convolution were 0.9737 and 0.9612, respectively. The Dilated Convolution helps the FWENet model to have a great performance improvement; The F1 score and mIoU of the FWENet model without Scse were 0.9851 and 0.9779, respectively. The Scse further improves the prediction accuracy of the FWENet model. Generally, The Dilated Convolution has a greater improvement in model performance than Scse.
Table 5. Accuracy comparison of different elements in the testing region.
4.5. Limitations and implications
Although the FWENet model proposed in this study had the highest water body extraction accuracy, some shortcomings still existed. The first was the image quality. The image used in this study is Sentinel-1, which is challenging to meet the requirements for large-scale flood disasters. In the future, GF-3 images can be further combined to solve image quality problems. The second was the deep learning method, deep learning is developed rapidly, many excellent classic network models have appeared. In the future, the FWENet model and other classic models will be compared. The third was distinction of the FWENet model between water body and mountain shadows, the water body extraction accuracy of the FWENet model in the testing area is slightly higher than that of the Otsu method. The testing region selected in this paper is relatively flat and has no shadows formed by tall mountains. Therefore, the Otsu method could obtain high extraction accuracy. Compared with the Otsu method, one of the advantages of the FWENet model lies in the effective distinction between water body and shadows. In the future, the FWENet model will be studied in areas with mountain shadows. In addition, it is difficult to have appropriate optical remote sensing images to assist SAR images interpretation during flood disasters to produce water samples. In the future, unmanned aerial vehicle images will be introduced to improve the water body interpretation accuracy of SAR images. Finally, this study only selected a specific area to test the water body extraction accuracy of the FWENet model, and research should be carried out in more areas in the future.
5. Conclusions
This study used Sentinel-1 SAR images as the data source. Aiming the existing research works that extract flood inundation extent from SAR images using deep learning method were relatively low extraction accuracy, this study proposed the FWENet model, taking the flood disaster of Poyang Lake in 2020 as the research object, quantitative analysis of the flooding situation of Poyang Lake. The results showed that: (1) Compared with the traditional methods such as the Otsu global thresholding method and object-oriented method, the F1 score of the FWENet model improved 0.59% and 0.96% respectively, and the mIoU improved 0.85% and 1.39% respectively. (2) Compared with the classical network models such as UNet, DeepLab v3 and UNet++, the FWENet model had the highest water body extraction accuracy, and its accuracy evaluation indexes F1 score and mIoU were 0.9871 and 0.9808, respectively. (3) The water body area of Poyang Lake showed a trend of ‘steep rise and slow fall’ throughout the study period, and it reached its peak on 14 July 2020, and its water body area is 4958 km2.
Disclosure statement
No potential conflict of interest was reported by the author(s).
Data availability statement:
The Sentinel-1 SAR data were obtained from ESA. The results of this study can be asked by corresponding email.
Additional information
Funding
References
- Addabbo, D., R. Alberto, P. Guido, F. Lovergine, C. Domenico, and M. Salvatore. 2016. “A Bayesian Network for Flood Detection Combining SAR Imagery and Ancillary Data.” IEEE Transactions on Geoscience and Remote Sensing 6 (10): 3612–3625. doi:10.1109/TGRS.2016.2520487.
- Badrinarayanan, V., A. Kendall, and R. Cipolla. 2017. “SegNet: A Deep Convolutional Encoder-Decoder Architecture for Image Segmentation.” In Proceedings of IEEE Conference on Computer Vision and Pattern Recognition, 1511–1525. doi:10.1109/TPAMI.2016.2644615
- “Bulletin of flood and drought disasters in China.” Ministry of Water Resources of the People's Republic of China, 1998–2019. http://www.mwr.gov.cn.
- Chen, Z. 2017. “Flooded Area Classification by High-Resolution SAR Images.” PhD diss., Wuhan University.
- Chen, Y., R. Fan, X. Yang, J. Wang, and L. Aamir. 2018. “Extraction of Urban Water Bodies from High-Resolution Remote-Sensing Imagery Using Deep Learning.” Water 10 (5): 585–605. doi:10.3390/w10050585.
- Chen, L., Z. Liu, and H. Zhang. 2014. “SAR Image Water Extraction Based on Scattering Characteristics.” Remote Sensing Technology and Application 29 (6): 963–969. doi: CNKI:SUN:YGJS.0.2014-06-011.
- Chen, L. C., G. Papandreou, F. Schroff, and H. Adam. 2017. “Rethinking Atrous Convolution for Semantic Image Segmentation.”
- Chen, Q., L. Zheng, X. Li, C. Xu, Y. Wu, D. Xie, and L. Liu. 2015. “Water Body Extraction from High-Resolution Satellite Remote Sensing Images Based on Deep Learning.” Geography and Geo-Information Science 35 (4): 43–49. doi:CNKI:SUN:DLGT.0.2019-04-007.
- Guo, H., G. He, W. Jiang, R. Yin, L. Yan, and W. Leng. 2020. “A Multi-Scale Water Extraction Convolutional Neural Network (MWEN) Method for GaoFen-1 Remote Sensing Images.” ISPRS International Journal of Geo-Information 9 (4): 189–207. doi:10.3390/ijgi9040189.
- Guo, X., and Y. Zhao. 2018. “Flood Inundation Monitoring in Ningxiang of Hunan Province Based on Sentinel-1A SAR.” Remote Sensing Technology and Application 33 (4): 646–656. doi:CNKI:SUN:YGJS.0.2018-04-009.
- He, K., X. Zhang, S. Ren, and J. Sun. 2017. “Deep Residual Learning for Image Recognition.” In Proceedings of IEEE Conference on Computer Vision and Pattern Recognition, 770–778. doi:10.1109/CVPR.2016.90
- Hu, C., and G. Hua. 2020. “A Study on CV Segmentation Model for Flood SAR Images.” Computer Science and Application 11 (3): 751–759. doi:10.12677/CSA.2021.113077.
- Huang, P., X. Xu, and D. Li. 2018. “Rapid Extraction of Water Area in Poyang Lake Based on Sentinel-1 Satellite Images.” Journal of Water Resources Research 7 (5): 483–491. doi:10.19547/j.issn2152-3940.2019.05.012.
- Jia, S., D. Xue, C. Li, J. Zheng, and W. Li. 2019. “Study on new Method for Water Area Information Extraction Based on Sentinel-1 Data.” Yangtze River 50 (2): 213–217. doi:10.16232/j.cnki.1001-4179.2019.02.038.
- Kang, W., Y. Xiang, F. Wang, L. Wan, and H. You. 2018. “Flood Detection in Gaofen-3 SAR Images via Fully Convolutional Networks.” Sensors 18 (9): 2915–2937. doi:10.3390/s18092915.
- Li, S., Z. Xu, Z. Chen, A. Zhang, and W. Yu. 2017. “Application of GF-3 Satellite Remote Sensing Image on Yellow River Flood Monitoring.” Water Resources Informatization 5: 22–26 + 72. doi:10.19364/j.1674-9405.2017.05.005.
- Liang, J., and D. Liu. 2020. “A Local Thresholding Approach to Flood Water Delineation Using Sentinel-1 SAR Imagery.” ISPRS Journal of Photogrammetry and Remote Sensing 159: 53–62. doi:10.1016/j.isprsjprs.2019.10.017.
- Liu, L., Z. Jia, J. Yang, and N. Kasabov. 2019. “SAR Image Change Detection Using Double Difference Images and PCA Algorithm.” Computer Engineering and Design 40 (7): 2002–2006. doi:10.16208/j.issn1000-7024.2019.07.033.
- Long, J., E. Shelhamer, and T. Darrell. 2015. “Fully Convolutional Networks for Semantic Segmentation.” In IEEE Conference on Computer Vision and Pattern Recognition, 3431–3440. doi:10.1109/CVPR.2015.7298965
- Nemni, E., J. Bullock, S. Belabbes, and L. Bromley. 2020. “Fully Convolutional Neural Network for Rapid Flood Segmentation in Synthetic Aperture Radar Imagery.” Remote Sensing 12 (16): 2532–2562. doi:10.3390/rs12162532.
- Pang, K. 2016. “Research of High-Resolution SAR Image Water Extraction Algorithms.” PhD diss., Changsha University of Science & Technology.
- Peng, B., Q. Huang, J. Vongkusolkit, S. Gao, D. B. Wright, Z. N. Fang, and Y. Qiang. 2021. “Urban Flood Mapping with Bi-Temporal Multispectral Imagery via a Self-Supervised Learning Framework.” IEEE Journal of Selected Topics in Applied Earth Observations and Remote Sensing 14: 2001–2016. doi:10.1109/JSTARS.2020.3047677.
- Rahman, M. R., and P. K. Thakur. 2015. “Detecting, Mapping and Analysing of Flood Water Propagation Using Synthetic Aperture Radar (SAR) Satellite Data and GIS: A Case Study from the Kendrapara District of Orissa State of India.” The Egyptian Journal of Remote Sensing and Space Sciences 21: 37–41. doi:10.1016/j.ejrs.2017.10.002.
- Rattich, M., S. Martinis, and M. Wieland. 2020. “Automatic Flood Duration Estimation Based on Multi-Sensor Satellite Data.” Remote Sensing 12 (4): 643–661. doi:10.3390/rs12040643.
- Ronneberger, O., P. Fischer, and T. Brox. 2015. “U-Net: Convolutional Networks for Biomedical Image Segmentation.” In International Conference on Medical Image Computing & Computer-Assisted Intervention, 234–241. Springer. doi:10.1007/978-3-319-24574-4_28
- Roy, A. G., N. Navab, and C. Wachinger. 2018. “Concurrent Spatial and Channel ‘Squeeze & Excitation’ in Fully Convolutional Networks.” In International Conference on Medical Image Computing and Computer-Assisted Intervention. doi:10.1007/978-3-030-00928-1_48
- Sun, Y., S. Huang, J. Li, X. Ling, J. Ma, and W. Qu. 2017. “The Downstream Flood Monitoring Application of Myanmar Irrawaddy River Based on Sentinel-1A SAR.” Remote Sensing Technology and Application 32 (2): 282–288. doi:CNKI:SUN:YGJS.0.2017-02-012.
- Sun, K., B. Xiao, D. Liu, and J. Wang. 2019. “Deep High-Resolution Representation Learning for Human Pose Estimation.” In Proceeding of the IEEE, 5693–5703. doi:10.1109/CVPR.2019.00584.
- Tang, L., W. Liu, D. Yang, L. Chen, Y. Su, and X. Xu. 2018. “Flooding Monitoring Application Based on the Object-Oriented Method and Sentinel-1A SAR Data.” Journal of Geo-Information Science 20 (3): 377–384. doi:CNKI:SUN:DQXX.0.2018-03-013.
- Tong, X., X. Luo, S. Liu, H. Xie, W. Chao, S. Liu, A. N. Makhinov, et al. 2018. “An Approach for Flood Monitoring by the Combined Use of Landsat 8 Optical Imagery and COSMO-SkyMed Radar Imagery.” ISPRS Journal of Photogrammetry and Remote Sensing 136: 144–153. doi:10.1016/j.isprsjprs.2017.11.006.
- Wang, Z., X. Gao, Y. Zhang, and G. Zhao. 2020. “MSLWENet: A Novel Deep Learning Network for Lake Water Body Extraction of Google Remote Sensing Images.” Remote Sensing 12 (24): 4140–4159. doi:10.3390/RS12244140.
- Wang, Q., and J. Liao. 2010. “Water Area Extraction and Change Detection of the Poyang Lake Using SAR Data.” Remote Sensing For Land & Resources 4: 91–97. doi:CNKI:SUN:GTYG.0.2010-04-020.
- Wang, Y., J. Ma, X. Xiao, X. Wang, and B. Zhao. 2019. “Long-Term Dynamic of Poyang Lake Surface Water: a Mapping Work Based on the Google Earth Engine Cloud Platform.” Remote Sensing 11 (3): 313–334. doi:10.3390/rs11030313.
- Xiong, J., L. Wang, S. Wang, and Y. Zhou. 2012. “Microwave Water Extraction Supported by Multi-Spectral Images.” Journal of China Institute of Water Resources and Hydropower Research 10 (1): 23–28 + 35. doi:10.13244/j.cnki.jiwhr.2012.01.001.
- Yang, K., J. Yang, and B. Jiang. 2015. “Sentinel-1 Satellite Overview.” Urban Geotechnical Investigation & Surveying 2: 24–27. doi:CNKI:SUN:CSKC.0.2015-02-006.
- Yu, F., and V. Koltun. 2016. “Multi-Scale Context Aggregation by Dilated Convolutions.” In International Conference on Learning Representations, 1–4. doi: arXiv:1511.07122
- Zhan, N. 2020. “Research on Remote Sensing Monitoring and Evaluation of “Typhoon-Storm” Flood Disaster.” PhD diss., University of Electronic Science and Technology of China.
- Zhang, M., F. Chen, D. Liang, B. Tian, and A. Yang. 2020. “Use of Sentinel-1 GRD SAR Images to Delineate Flood Extent in Pakistan.” Sustainability 12 (14): 5784–5803. doi:10.3390/su12145784.
- Zhang, M., L. Zhen, B. Tian, J. Zhou, and P. Tang. 2016. “The Backscattering Characteristics of Wetland Vegetation and Water-Level Changes Detection Using Multi-Mode SAR: A Case Study.” International Journal of Applied Earth Observations and Geoinformation 45: 1–13. doi:10.1016/j.jag.2015.10.001.
- Zhou, H. 2018. “Flood Extent Mapping from the Sentinel-1 and Sentinel-2 Data in Sri Lanka.” PhD diss., Institute of Remote Sensing and Digital Earth, Chinese Academy of Science.
- Zhou, Z., M. Siddiquee, N. Tajbakhsh, and J. Liang. 2018. “UNet++: A Nested U-Net Architecture for Medical Image Segmentation.” In Deep Learning in Medical Image Analysis and Multimodal Learning for Clinical Decision, 3–11. doi: arXiv:1807.10165
- Zheng, Y., W. Shu, C. Yue, S. Jin, Q. Yi, L. Li, Z. Tian, et al. 2021. “Assessing the ecological vulnerability of protected areas by using Big Earth Data” International Journal of Digital Earth, doi: 10.1080/17538947.2021.1962995.