
 ?Mathematical formulae have been encoded as MathML and are displayed in this HTML version using MathJax in order to improve their display. Uncheck the box to turn MathJax off. This feature requires Javascript. Click on a formula to zoom.
ABSTRACT
Public medical facilities that are closely related to the health of residents have been recognised as one of the most crucial elements in sustainable urban planning. For the sake of social equality of medical services (especially for emergency medical conditions), the spatial distributions of medical resources need to be accurately measured and continuously optimized. This study presents an effective method to examine night emergency hospital visit and analyse its spatiotemporal characteristics using float car data (FCD). By extracting the hospital service areas, the two-step floating catchment area (2SFCA) methodology was improved to calculate hospital accessibility. Then, the balance between hospital accessibility and population density was analysed. In addition, we investigated the relationship between individual hospital choice preferences and hospital level and analysed several factors that affect individual choices. These results help us understand the special requirements and need of emergency hospital travel in cities and identify areas where medical resources are scarce. They can be used as guidance for urban hospital planning and construction. And the approach of hospital access behaviour investigation and the improved 2SFCA method can also provide insights for other activity-based travel behaviour research.
1. Introduction
Analysing the use and spatial allocation of medical facilities may provide guidance to the patients in choosing their preferred hospital and may also reduce the time cost of hospital travel (Barber et al. Citation2017). In particular, with respect to the shortage of medical resources during a public health situation (e.g. the COVID-19 pandemic), the efficiency and equity of using public medical resources are very important for residents to seek medical treatment. Whenever healthcare resources are scarce, patients either incur long waits in local hospitals or travel to distant ones for healthcare services (Jackson et al. Citation2002). In this case, patients cannot receive timely assistance, which is not conducive to establishing a good hospital atmosphere or doctor-patient relationship (Jones et al. Citation2008; Yang, Chen, and Wang Citation2020). The reasonable allocation of medical resources is related to not only the quality of life of residents but also to the stability of society (Jia, Xierali, and Wang Citation2015; Nakamura et al. Citation2017). In developing countries, especially in metropolitan areas, rapid urban growth vastly exceeds the capability of municipalities to provide basic infrastructure and services for their citizens (Cohen Citation2006).
Public medical facilities have been recognised as one of the most crucial elements in sustainable urban planning worldwide (Jin et al. Citation2019; Wang et al. Citation2019). To help city planners evaluate and analyse the effectiveness of public facility configuration, many studies have been conducted to delineate the service areas (Hu, Wang, and Xierali Citation2018; Jia, Wang, and Xierali Citation2017b), analyse equity issues (Liu, Qin, and Xu Citation2019; Yin et al. Citation2018; Gong et al. Citation2021), investigate hospital bypass behaviour (Yang et al. Citation2016), and help formulate hospital relocation plans (Wang et al. Citation2019). For instance, Wang et al. (Citation2019) conducted research to provide reasonable suggestions for the optimal location of hospitals in Beijing, China, considering traffic congestion and hospital accessibility. Previous studies have shown that the accessibility of medical service facilities—a measure of the residents’ opportunities to obtain medical services in a specific area—is regarded as a valid method for evaluating medical service distribution in urban regions (Tao and Cheng Citation2019; Wang Citation2018, Citation2020).
Traditionally, the analysis of the spatial allocation of healthcare resources is mainly based on static data, such as census data, hospital records, etc. (Jia, Wang, and Xierali Citation2017a; Jia, Xierali, and Wang Citation2015; Kong et al. Citation2017; Tao et al. Citation2014). However, since these data sets are likely to involve patients’ privacy information and the time span of these data sets is usually long (that is, the availability and timeliness of the data are poor), it is difficult to accurately investigate the medical behaviour of residents (Wang et al. Citation2020). With the advancement of sensor technologies, the availability of float car data (FCD) has been widely studied (Liu et al. Citation2016; van Weerdenburg et al. Citation2019). FCD data contain not only the location and time information but also the information about the origin and destination of passengers. This can help us analyse the relationship between positions from the perspective of spatial interaction, which can help in many related research fields, such as the analysis of urban spatial structure (Gong, Lin, and Duan Citation2017; Zhong et al. Citation2014) and the exploration of human activities (Liu et al. Citation2015; Mao, Ji, and Liu Citation2016). Using taxi data in Beijing, Kong et al. (Citation2017) extracted hospital trips from the perspective of spatial interaction and classified hospitals in Beijing based on travel characteristics (e.g. travel distance and patient distribution). Taxi data were used by Yang et al. (Citation2016) to analyse hospital detour behaviour by constructing bypass indicators. To provide suggestions for the rational allocation of urban hospital resources, Wang et al. (Citation2020) evaluated the rationality of the spatial distribution of medical resources in Beijing by calculating the accessibility of hospitals. Chen and Song (Citation2014) investigated the travel modes of residents in Shenzhen (a big city in China), and found that taxi travels account for 20–30% of the total travel to general hospitals. According to a survey (Haynes et al. Citation2006), more than 80% of people choose to drive (including private cars and taxis) to the hospital. While individual patient travel data are more ideal (private car data), considering that the data is not available due to privacy issues, the taxi dataset are used in our study as a proxy to estimate hospital visits.
Although previous studies have contributed important information in the domain of hospital travel identification and accessibility of medical facilities, a research gap still remains. First, in the process of identifying hospital travel, hospitals are usually identified based on point elements, ignoring the area attributes of medical facilities (Wang et al. Citation2019; Wang et al. Citation2020), which can lead to large errors in the identification results. Second, owing to the different scales of the supply areas, the service radii provided by the supply areas are not the same. However, in previous studies, a threshold was arbitrarily set as a hospital catchment area, without considering the spatial heterogeneity of the service range. This affects the accuracy of the calculation results. Third, previous studies often used long-term static data (e.g. hospital records and census data) or all-day taxi travel data, rather than focusing on hospital travel at night. This study aims to explore hospital travel at night (emergency medical travel) for the following reasons. At night, only the emergency department works in a hospital, therefore, due to the staff shortage, many non-urgent patients would choose to go to the hospital during the daytime the next day. Thus, most cases received by the hospital at night tend to be in an urgent condition. In this context, patients pay more attention to time and distance when choosing hospitals, which brings greater challenges for the rationality of local medical resource allocation. In addition, during the day, the patient's choice of hospital is affected by many socio-economic factors, such as traffic conditions, hospital level, and hospitalisation cost. Thus, compared with the travel patterns during the day, the exploration of hospital travel patterns at night in cities can more accurately assess the rationality of the spatial distribution of medical resources.
Aiming to solve the abovementioned problems, we have considered Shanghai, China as our case study and attempted to provide a framework for exploring the accessibility of urban hospitals in this region. First, combined with an online map, a visualisation method was adopted to draw the boundaries of the hospitals. Second, spatial data mining methods were used to identify hospital travel from massive taxi trajectory data, while delineating the actual service areas of each hospital. To a certain extent, this solved the problem of inconsistent service radii for different hospitals. Third, the spatiotemporal information of the trajectory data is used to analyse the characteristics of hospital travel at night and combine urban population data to calculate and evaluate the spatial accessibility of urban medical resources.
It is worth noting that in metropolises, such as Shanghai, China, the large number of private cars has increased the travel radius of the residents; corresponding to this, an increasing number of people choose to live in suburban and rural areas because of the growing suburbanisation process that provides better living environments. However, most hospitals are located in the city centre, which intensifies the contradiction between medical demand and the shortage of medical resources. Consequently, from the perspective of spatial interaction, exploring the spatial and temporal characteristics of night-time hospital visits in big cities has important theoretical and practical significance for understanding the status of medical resources. This will also aid in the identification of areas that suffer from a lack of medical infrastructure and the optimisation of the spatial layout of medical facilities. In addition, the approach we developed to identify hospital travel and delineate hospital service areas (HSAs) can be applied to other types of public facilities, such as parks and train stations. The findings of this study can benefit urban hospital planning and management and help optimise the spatial allocation of medical resources.
The remainder of this study proceeds as follows. Section 2 provides a summary of the progress of the study. Section 3 introduces the study area, datasets, and methods used in this study (e.g. identification of hospital travels and delineation of HSAs). Section 4 presents the details of the spatiotemporal patterns of emergency hospital travel, distribution of hospital accessibility, and evaluation of rationality of medical resources. Section 5 presents a discussion, including the analysis of residents’ choice preferences and factors affecting the accessibility of urban hospitals; and Section 6 offers the concluding remarks and future research directions.
2. Related work
The relationship between urban residents’ mobility patterns and urban spatial structure has always been a focus of human geography research. The movement of crowds can reflect the characteristics of the urban spatial structure. In turn, the spatial structure of the city also restricts and influences the movement behaviour of its residents. The emergence of massive individual trajectory data provides new opportunities and challenges for examining human mobility. Medical treatment activities are an important part of the lives of residents. Thus, analysing the temporal and spatial characteristics of medical treatment activities can deeply explore the rationality of urban infrastructure construction, which may provide important guidance for the optimisation of medical resources. Meanwhile, spatial accessibility, as an effective indicator of rationality assessment, has been widely studied by scholars in different fields. Consequently, this section reviews the research progress from two aspects: applications of FCD to study and evaluate human activities and viable methods for evaluating hospital accessibility.
2.1. Analysis of human activities
The widespread use of global navigation satellite system (GNSS) devices makes it possible to gather large volumes of individual trajectory data at a low cost (Cao et al. Citation2015; Neutens Citation2015; Ríos and Muñoz Citation2017). Each trajectory is composed of a series of spatiotemporal sampling points. From a macro point of view, the massive individual trajectory data contain the patterns and laws of crowd movement (Liu et al. Citation2012; Liu et al. Citation2015), which provides a viable method for examining the mobility of citizens. The analysis of trajectory data and knowledge discovery provides new opportunities for solving urban traffic congestion (Kan et al. Citation2019; Wang et al. Citation2019), traffic pattern detection (Wang, Lu, and Li Citation2020), traffic navigation (Park et al. Citation2020), and other social problems (Zhang et al. Citation2015; Levy and Benenson Citation2015).
In addition, taxi travel accounts for a considerable share of urban traffic flow. Notably, parking points are flexible, and passengers tend to leave the taxi as close to the destination as possible. Consequently, the pick-up and drop-off points in the taxi trajectory data are important for identifying the activities of citizens and play an important role in understanding the urban spatial structure and human activity patterns (Zhang et al. Citation2015). For instance, Wang et al. (Citation2019) used taxi trajectory data to determine traffic congestion near a hospital and identify hospitals that need to be relocated to ease urban traffic conditions. Gong et al. (Citation2016) designed a research framework to infer the activity types of taxi passengers. Huang et al. (Citation2018) concentrated on inferring activities from individual trajectory data by combining nearby points of interest (POIs).
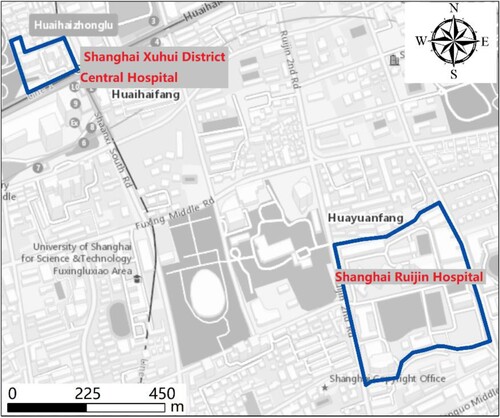
At present, FCD data have made significant progress in the research of medical activities, such as extracting medical activities (Wang et al. Citation2019; Gong et al. Citation2021), dividing the scope of medical services (Jia, Shi, and Xierali Citation2019), etc. However, the existing research mainly treat hospitals as point element data and extracts hospital trips by analysing the location relationship between the pick-up/drop-off points and the hospital (Gong et al. Citation2021). For example, Kong et al. (Citation2017) consider the trips where the pick-up and drop-off points are within a 200-m buffer zone of the hospital as hospital trips. Pan et al. (Citation2018) used a buffer zone threshold of 50 m from the entrance of the hospital, and used taxi trip data from Shenzhen to detect hospital trips. To date, few studies have fully considered the spatial difference of the hospital boundary in the process of extracting hospital trips, which affects the accuracy of the extraction results significantly. For instance, the Shanghai Ruijin Hospital covers an area of 120,000 m2, while the Shanghai Xuhui District Central Hospital has an area of only 12,672 m2, as shown in . For these two hospitals (having different ranges), if the same buffer zone is set to extract hospital trips, many trips will be misidentified, thereby reducing the accuracy of the results. This also leads to larger errors in the subsequent analysis results.
Figure 1. Example of two hospitals.
2.2. Methods for evaluating hospital accessibility
Accessibility is an important indicator for evaluating whether the service of public facilities is reasonable (Panagiotopoulos and Kaliampakos Citation2018). It refers to the degree of interconnection between a given point and all other points on the same surface (Hansen Citation1959; Ingram Citation1971). As an important part of public service facilities, research on the accessibility of medical facilities has received extensive attention and several major findings have been made. The main methods for estimating hospital accessibility are the nearest distance (Ingram Citation1971), cumulative chance (Mitchell and Town Citation1977; Wachs and Kumagai Citation1973), gravity (Hansen Citation1959), and two-step floating catchment area (2SFCA) methods (Luo and Wang Citation2003). The 2SFCA model is the most commonly used measurement of hospital spatial accessibility because it takes into account the population demands, hospital resources, and travel costs calculated based on geographic distance or travel time (Cheng et al. Citation2016). The original model can be expressed as follows:
Step 1. For each service supply location j (i.e. hospital j), all population locations (k) (i.e. demand locations) within a threshold distance (d0) of hospital j are searched. The area within this distance threshold (d0) is defined as the service catchment of hospital j. Then, the supply to-demand ratio Rj can be calculated according to the following formula:
(1)
(1)
where Sj is the service capacity of the supply location j, dkj is the distance from the demand location (k) to the supply location j, and Pk is the population count at demand point k that lies within a threshold distance (d0).
Step 2. For each demand location i (i.e. population location i), all the hospitals that can be used (within a threshold distance d0) are searched, and all the supply to-demand ratios Rj to obtain the accessibility of each demand location are summed up.
(2)
(2) However, the original 2SFCA technique adopts a strictly dichotomous model, ignoring spatial resistance. For instance, for a hospital, locations within a travel threshold are equally accessible, and locations beyond the threshold are equally inaccessible (Langford, Fry, and Higgs Citation2012). Haynes et al. (Citation2006) found that the time of hospital travel and the number of patient registrations in medical institutions showed a distance-decay relationship. To model this effect, some scholars have extended the 2SFCA algorithm by introducing a distance-decay function (Bauer et al. Citation2018; Fransen et al. Citation2015; Gong et al. Citation2021; McGrail and Humphreys Citation2009; Tao, Cheng, and Liu Citation2020). For example, Luo and Qi (Citation2009) improved the 2SFCA algorithm by segmenting the distance between the supply and demand points and assigning weights to each distance segment. Delamater (Citation2013) explored the accessibility of primary healthcare in Michigan with the help of the kernel density 2SFCA (KD2SFCA). Dai (Citation2010) used a continuous Gaussian function to analyse the accessibility of medical facilities and conducted a sensitivity analysis of the travel time of the watershed threshold. Gong et al. (Citation2021) used the frequency distribution of trips to redefine the decay weight and calculated the accessibility of the hospital.
These extended methods provide important information for the distance decay in the accessibility calculation, which greatly promotes the development and popularisation of 2SFCA. However, two issues need to be considered when using the 2SFCA model and its modified version to analyse spatial accessibility effectively.
The first issue is the delineation of the catchment areas of the population. Catchment areas are usually delineated by concentric circles within a given travel time or distance (Apparicio et al. Citation2008; McGrail Citation2012), or within the closest administrative or geographic regions in the cluster area (Jamtsho, Corner, and Dewan Citation2015). Although the current methods of delimiting water catchment areas are representative, there are still some limitations observed. Because the size of the catchment area of a hospital is related to its type and scale, patients usually cross the state or county border for treatment (Jia, Shi, and Xierali Citation2019). In addition, the population is unevenly distributed in the geographical space. Consequently, it is unreasonable to use a circular area or administrative boundary to delimit the service area of a hospital; additionally, it cannot represent the actual distribution of patients.
The second issue is the use of the distance-decay function. In the existing literature, when using the distance-decay function to calculate the weight of the service catchment area, the linear distance between the supply and demand points is used instead of the trajectory distance, ignoring the actual resistance (Luo Citation2014; Wan, Zou, and Sternberg Citation2012). Gong et al. (Citation2021) used the actual travel time in the decay function and improved the original algorithm to make it more realistic. However, they did not consider the spatial differences in the influence of different levels of hospitals and adopted the same decay weight for all hospitals. Consequently, considering these two problems, it is necessary to adjust the existing 2SFCA algorithm to reduce the errors in the accessibility calculation process and provide a more accurate method and technology to calculate and evaluate the accessibility of public service facilities.
3. Materials and methods
This section details the process and main methods of data processing and analysis. First, the research framework is described. Second, the study area and datasets are introduced. Then, a method for identifying hospital travel from massive trajectory data is proposed. Finally, the accessibility calculation model (2SFCA) is improved to calculate hospital accessibility in a better way.
3.1. Research framework
A flowchart of our study methodology is presented in . It mainly includes three parts: data processing, hospital trip detection, and urban hospital resource analysis.
Figure 2. Methodology flowchart.
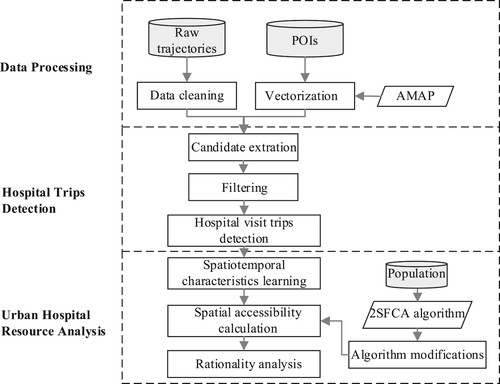
(1) Data processing
The two datasets of taxi trajectory data and hospital data were required in our study. Owing to the recording errors of the raw trajectory data, such as missing fields and drift points, it is necessary to pre-process the trajectory data. Consequently, in this component, the processing of FCD data includes data cleaning (i.e. deleting unnecessary fields and wrong track records) and identifying the original and destination points of the trajectory to construct a taxi route. Then, AutoNavi MAP (AMAP) was used to visualise and vectorise the hospital data and delineate the boundary to convert hospital point data into area data. In this part, AMAP is one of China's three Internet giants, providing powerful navigation services.
(2) Hospital trip detection
This is used to extract candidate trajectories from a large number of original trajectories, identify night hospital trips through spatial statistics and filtering algorithms, and construct a hospital emergency trip data set.
(3) Urban hospital resource analysis
First, descriptive statistical methods, correlation analysis, and spatial autocorrelation analysis were adopted to analyse the spatial and temporal characteristics of medical travel. Second, the accessibility algorithm (2SFCA) was improved by delineating the HSA and extracting the trajectory distance, using it to calculate hospital accessibility. Finally, combined with population data, the rationality of the spatial distribution of urban medical resources was analysed.
3.2. Study area and data description
3.2.1. Study area
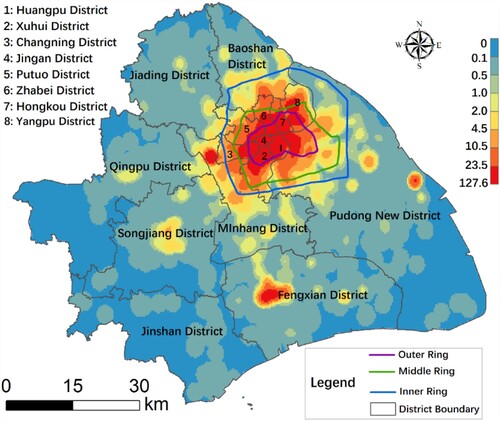
Shanghai is the centre of economic, financial, trade, and technological innovation, and is one of the biggest cities in China, with a very high population density. Chongming District is a suburban county in Shanghai that is far from the city centre. The taxis in this area are rarely accessible due to the natural environment, resulting in its isolation from mainland Shanghai. According to the statistics of our FCD, less than 1% of the data is related to Chongming District. Therefore, in this study, mainland Shanghai was selected as a case study (). We evaluated the characteristics and accessibility of urban medical resources and how planning processes can influence the improvement of such accessibility.
Figure 3. Study area of Shanghai.
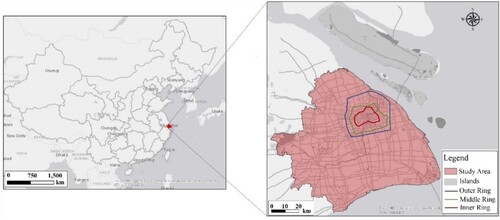
In Shanghai, there are three main transport rings, namely the inner, middle, and outer rings (). The population of Shanghai is mainly distributed within the outer ring road, which is the central area of the city, having high living expenses. With a significant increase in transportation accessibility to distant areas in the city, more people now tend to live in the suburbs and rural areas to pursue a better quality of life. However, most hospitals are located in the city centre, which intensifies the contradiction between medical demand and the shortage of medical resources. Therefore, from the perspective of spatial interaction, exploring the spatial and temporal characteristics of medical resources in Shanghai has important theoretical and practical significance for understanding the status of medical resources in an urban setting.
3.2.2. General information to float car data (FCD)
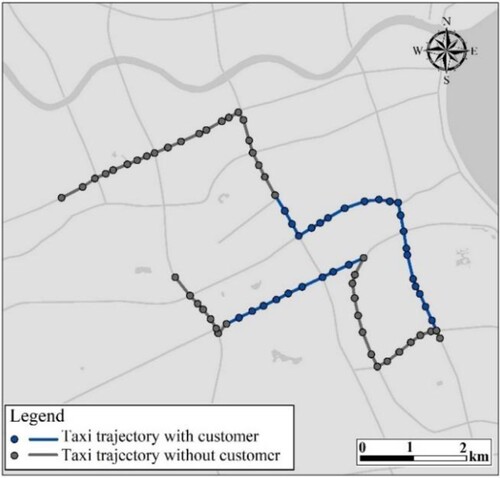
Taxis are an important mode of urban public transportation in Shanghai. The trajectory is a series of chronological position records, which are collected from approximately 6000 GPS (global positional system)-equipped taxis, and the time range is from 1 June to 30 June 2018. In addition, this information is recorded approximately every 10 s with a position accuracy of approximately 10 m, which is acceptable for research on hospital access behaviour. In the database, each record has nine fields: taxi ID, day, time, speed, direction, longitude, latitude, vehicle status, and company. illustrates the GPS trajectory of a taxi. Geographically, the raw GPS trajectories are a series of discrete points. The blue line and point indicates that the taxi is occupied, and the grey line and point represents the cruise status.
Figure 4. Trajectory of a taxi.
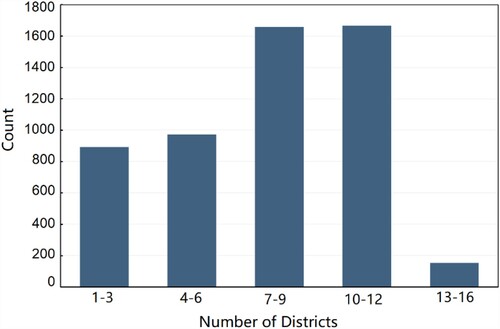
Although the data of 6000 GPS-equipped taxis used in this study is only a part of all the taxis in Shanghai, the trajectory data is considered representative. This is mainly because the data is collected by a technology company from several taxi companies, and its data collection is not limited by regions. And all vehicles included in the data are not restricted by a specific area and can operate freely across the city. We have counted the number of service districts for each vehicle as shown in the , the x-axis represents the number of districts per taxi travelled in a day, and the y-axis represents the number of vehicles. The results show that the number of operating areas of most taxis is mainly distributed in 7–12 districts (16 in total), which can further illustrate that the taxis selected in this study are not restricted by specific areas and the dataset can serve as a good proxy in our research.
Figure 5. Number of service districts per taxi.
3.2.3. Hospital data description
Hospital data (such as hospital name, type, location, and number of beds, etc.) were obtained from the Shanghai Public Open Data System (https://data.sh.gov.cn/index.html) and OpenStreetMap (https://download.geofabrik.de). In China, according to factors such as hospital size, technical level, and equipment quantity, hospitals are classified into three levels: first, second, and third-class hospitals. Among them, the medical level and service scope of the third-class hospitals are much better than those of the second-class hospitals, with the most primary services being offered in the first-class hospitals.
In this study, we consider the spatial heterogeneity of the hospital and combined it with spatial visualisation processing to convert hospital point attribute data to area attribute data. The pre-processing of the hospital data is as follows: First, the point data of the hospital are spatially superimposed with the AMAP through a coordinate transformation. Then, through data vectorisation processing, point features are converted to area features data (e.g. point to polygon). Finally, the areas of all hospitals are calculated, and some smaller hospitals are excluded. These small hospitals are often private clinics. According to the requirements of the ‘Basic Standards for Medical Institutions’ promulgated by the National Health Commission of the people's Republic of China (http://www.nhc.gov.cn/), the construction area of the clinic is not less than 40 m2, and the area of the treatment room is not less than 10 m2. Thus, we discard these small hospitals (less than 50 m2) due to the irregular construction and limited service scope.
In addition, we conducted a detailed investigation on the business hours of all selected hospitals by manually checking the information on the official websites or by telephone consultations. Some hospitals that do not operate at night, such as those private specialist hospitals, are also excluded. Ultimately, we selected 239 medical facilities, of which 78 were third-class hospitals, 119 were second-class hospitals, and 42 were first-class hospitals. It is worth mentioning that, to provide better services to urban residents, some high-quality medical resources in Shanghai have established multiple branches in other areas of the city. In this section, all branches are regarded as independent hospitals.
3.3. Algorithm to identify hospital visit travels
By mapping the moving locations of a vehicle to the boundary of a hospital, hospital travel can be easily discovered. However, because of the signal error of GPS devices and the prohibition of taxis entering the hospitals, this direct approach cannot be applied to perfect matching. As such, this section introduces an approach to identify hospital emergency travel from a large number of raw trajectories. First, a travel trajectory dataset is constructed. Then, spatial interaction was adopted to filter the candidate objects. A three-step approach was adopted, as follows:
Step 1. Construction of origin-destination (OD) trips:
To extract medical travel, we first construct an origin-destination (OD) matrix of trajectories. The OD matrix is denoted by a vector from (xo, yo, to) → (xd, yd, td), where (x, y) represents the geographical coordinates of an OD point, and t represents the sampling time. There were ∼4.65 million taxi trips between 1 June 2018 and 30 June 2018. In addition, affected by the positioning accuracy and data recording errors, the trajectory data may have an error of about 10 metres or even drift. And combined with the speed limit requirements of the ‘Implementation Regulations of the Road Traffic Safety Law of the People's Republic of China’ (http://www.gov.cn/gongbao/content/2019/content_5468932.htm), invalid trips such as driving distances less than 10m and speeds exceeding 130km/h are cleared. This setting is also consistent with the study of Wang et al. (Citation2020).
Step 2. Determination of hospital boundary
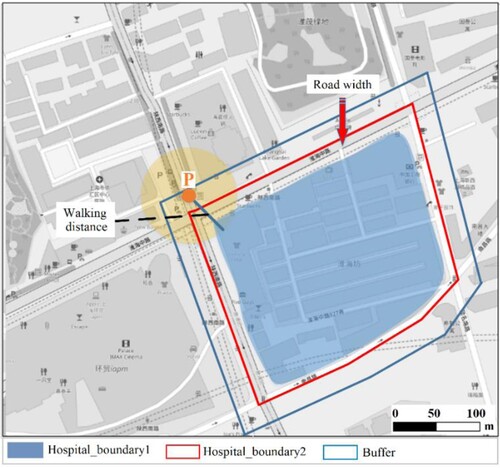
Since most of the OD points are located on the road network around the hospital, in order to accurately identify hospital travel activities, road width information should be considered in determining the boundary of the hospital. The process of determining the hospital boundary is shown in . First, we mapped the hospital data to the AMAP and expanded the boundary of the hospital according to the road network around the hospital (i.e. Hospital_boundary2 in ). Second, for the data that have a 10–20 m error due to unstable signals, and the actual destination point are located within a walking distance from the OD points in common sense, we performed a buffer processing on hospital_boundary2. According to previous studies, 50 metres is a reasonable threshold from the pick-up or drop-off point to hospitals (Wang et al. Citation2020; Pan et al. Citation2018). Consequently, the threshold of a 50-m buffer area form hospital_boundary2 is used as the boundary for identifying the hospital trips in our research.
Figure 6. Example of hospital boundaries. The blue area represents the real hospital boundary; red line represents the hospital boundary, including the road width; and the blue line is the final virtual boundary of the hospital.
Step 3. Extraction of emergency hospital travels
In the process of filtering candidate trajectory datasets, it is necessary to pay attention to the spatial and temporal characteristics of trajectories to reduce data interference. Notably, the following spatiotemporal features are required: (1) Trips that take place at night, as most of the working hours of experts in Shanghai hospitals are between 7:00 am and 5:30 pm (Pudong Headlines Citation2019); therefore, only the emergency department of the hospital remains to work normal shifts after the experts are off work. Considering the need to queue up in the hospital in advance, among other reasons, the study time period was determined to be 0–6 am and 18–24 pm; (2) Travel where the pick-up point or drop-off point is within the hospital boundary is considered a hospital visit (Wang et al. Citation2019). However, for the trajectories with pick-up points within the hospital boundary, the corresponding drop-off points are relatively random (e.g. shopping, entertainment, home, work); thus, it cannot accurately show where the patients come from (e.g. patient distribution). Consequently, in this step, trajectories with drop-off points within the boundary of the hospitals are needed, and the time range is 0–6 am and 18–24 pm In addition, we filtered out unreasonable travels comprising less than 500 m (i.e. too-short trips) (Gong et al. Citation2021) or more than 100 km (i.e. the maximum radius of activity for residents) (Shi and Jiang Citation2017). These travels are usually caused by operating errors or data transmission errors. In the end, there were approximately 120,000 emergency medical trips taken between 1 June 2018 and 30 June 2018.
3.4. Modified two-step floating catchment area (2SFCA) method for hospital accessibility
In the specific context of hospital accessibility, as stated earlier, it is reasonable to assume that hospitals located nearby are more desirable and that the farther away a hospital is located, the less preferred it is. Consequently, we adopted the Gaussian-based 2SFCA of Dai (Citation2010), which simply requires that the demand population in Step 1 and the service provision-to-population ratios in Step 2 are multiplied by a geographical weighting based on the Gaussian distance-decay function [EquationEq. (1(1)
(1) ) and (Equation2
(2)
(2) )]. This function produces a flat pass-band region with no spatial impedance, followed by a smooth decay in the transition zone, in such a way that zero weighting is approximated at the threshold distance. Thus, this function satisfies our assumptions.
Two issues of the original 2SFCA algorithm has been pointed out in Section 2.2, that is, the delineation of the catchment areas of the population and the selection of distance parameters in the distance-decay function. In order to solve these two issues, we mainly modify the algorithm from the two aspects of dynamically delineating the catchment areas of the population and obtaining the trajectory distance between the patient and the hospital. In Section 3.4.1, an approach for delineating the HSAs is integrated into the Gaussian-based 2SFCA model to address the problem of inaccurate catchment thresholds. In addition, we used the path planning data of the AMAP to obtain the actual trajectory distance and then calculate the weight according to the distance-decay function. In Section 3.4.2, HSAs and trajectory distances are embedded in the model to calculate the accessibility of urban hospitals.
3.4.1. Adjustment of algorithm parameters
The population catchment areas of the hospital are also called HSAs, which portray hospital choices by patients. The HSAs, an important spatial feature reflecting the attractiveness of a hospital, is related to the type of hospital, distribution of patients, and existence of competitors. Patients often cross state or county boundaries for hospital services. Consequently, considering the spatial differences in population distribution, it is necessary to delineate the HSAs according to the actual distribution of patients to solve the first issue (i.e. the delineation of the catchment areas of the population). In general, the most widely used measures to describe the daily activity space of an individual are standard circles, standard distances, ellipses, etc. (Yin et al. Citation2013; Zhou and Fang Citation2017). However, due to the social-economic factors such as transportation and urban functional areas, individuals do not play within a uniform radius around their homes equally in all directions (Yin et al. Citation2013). What’s more, there are some problems with these methods, such as the enlargement of the space scope and the difficulty of parameter determination, as shown in .
Figure 7. Two ways to depict activity space: (a) standard circle; (b) standard distance ellipse.
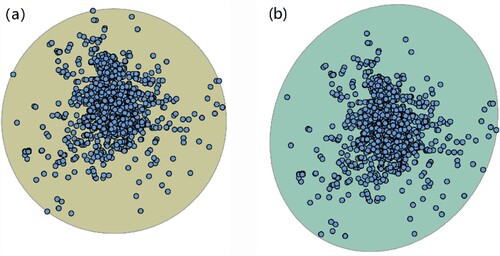
In order to solve these problems, the alpha-shape algorithm have been developed to extract the data boundary from a set of unordered points ((a)) (Asaeedi, Didehvar, and Mohades Citation2013). The algorithm has a simple structure and only needs one parameter, namely the radius α of a circle. The principle of obtaining a reasonable contour of the point set is briefly described as follows. For point set S, in order to obtain its reasonable contour, the algorithm adaptively selects a parameter α to represent the radius of a circle. Next, any two points in S are traversed to distinguish whether they are in boundary or not. If the selected two points can form a circle with radius α and the circle contains no other points, the two points are considered to be a part of contour. Obtain points on all edges of S in turn, until they form a closed loop, then the algorithm ends. This method can effectively avoid the space expansion problem of the data boundary (Mu and Liu Citation2011; Jiao, Fan, and Wang Citation2020).
Figure 8. Polygon boundary based on the (a) original alpha algorithm and (b) alpha algorithm combined with iForest.
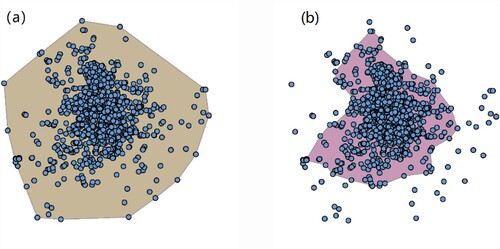
However, owing to sampling point errors or some accidental factors, a small number of points that are significantly different from other data objects thus often appear in the dataset, which are called outliers, as shown in . Geographically, it appears to exist in isolation or far from the overall data object. These outliers have a significant influence on the boundary shape during the boundary extraction process. Consequently, it is necessary to solve the problem of outliers in the sampling point data before extracting the boundary.
The isolated forest (iForest) algorithm was adopted to solve this issue. Because it is based on the ensemble idea, it has a linear time complexity with a low constant and low memory requirement (Liu, Ting, and Zhou Citation2008). There are two phases of anomaly detection using the iForest. The first phase (training) builds isolation trees using the subsamples of the training set. The second phase (testing) passes the test instances through isolation trees to obtain an anomaly score for each instance. The main part of the iForest algorithm is as follows. iForest is similar to a decision tree, which uses a tree structure to separate the instances. An iForest consists of multiple isolation trees, namely iTree, which are created by randomly choosing attributes and attribute values. The details of the procedure for creating the iTree algorithm can be found in a study conducted by Liu, Ting, and Zhou (Citation2008). Finally, by removing the outliers in the sampling point data, the alpha-shape algorithm is further used to obtain the boundary, as shown in (b).
For the acquisition of the trajectory distance (i.e. the second issue), the route planning data of the AMAP are used. The AMAP route planning data were derived via the application programming interface (API) (https://lbs.amap.com/) and collected in June 2020. These data contain indexes such as the length and time of different paths between two points. In this section, we choose the shortest distance between the patient and the hospital as the trajectory distance between the two points.
3.4.2. Improved two-step floating catchment area (2SFCA) method
In the first step, for each service supply location hospital j, search all population locations k (i.e. demand points) that lie within the service area catchment j (i.e. HSAs). Then, using the Gauss equation to assign weight to the population number of each demand point, and summing up all the weighted population as the potential demanders of the supply area (hospital j). Finally, the service capacity (i.e. number of hospital beds) of supply area j was divided by the total number of potential demanders to calculate the supply-demand ratio, Rj:
(3)
(3) where Sj is the service capacity of the hospital j, and Pk is the population count at demand point k that lies within service area catchment j (i.e. demand point k in HSAs). The Gridded Population of the World version 4 from NASA (GPWv4, 1 km × 1 km spatial resolution) (https://sedac.ciesin.columbia.edu/data/sets/browse) is adopted in this formula. G is the Gaussian distance-decay function, dkj is the trajectory distance between the two points obtained by the AMAP, and d0 is the maximum trajectory distance between hospital j and all population locations. G is defined as follows:
(4)
(4) In the second step, for each demand population location i, we found all hospitals whose HSAs covered this demand point i, discounting each Ri using the Gaussian function (G), and summing up all discounted Ri to obtain the spatial accessibility at demand population location i (i.e. Ai). This is defined as follows:
(5)
(5) where j denotes all hospitals within the catchment of demand population location i, and all the other notations are the same as in EquationEq. (1
(2)
(2) ). The higher the accessibility score (Ai), the better the accessibility of population location i has.
In this algorithm, step 1 measures the availability of service via a supply to-demand ratio at each hospital j, while step 2 measures the cumulative opportunity reporting the total availability of this weighted service at each population demand point i. The spatial accessibility calculated by the Gaussian-based 2SFCA can be explained as the number of medical service facilities per capita in the population unit.
4. Results
We used descriptive analysis and spatial autocorrelation analysis to reveal the spatial and temporal characteristics of medical travel at night. Then, spatial analysis and visualisation methods were adopted to analyse the spatial distribution characteristics of the accessibility of medical resources. Finally, combined with population data, we estimated the rationality of the spatial distribution of urban medical resources.
4.1. Spatiotemporal characteristics of hospital trips
We discretized the study area into 1 km × 1 km grids, and then the number of pick-up points (i.e. where patients came from) within each grid was counted to depict the geographic distribution of a hospital's patients. As shown in , geographically, the grid unit with the largest number of pick-up points is mainly captured in the central area of the city (i.e. the area within the rings), which corresponds to low temporal and spatial impedance. In the areas outside the ring, there are also a few street blocks showing a high density of pick-up points, such as the central areas of the Songjiang and Fengxian districts.
Figure 9. Heat map of pick-up locations.
Furthermore, travel volume, departure time, travel time consumption and distance are adopted for quantitative analysis to help people better understand the patterns of hospital emergency travel activities at night. The results for the trip departure times are shown in (a). The y-axis represents the trip departure times, and the x-axis represents the dates, where 2, 3, 9, 10, 16, 17, 23, and 24 are weekends and marked in red, and 16, 17, and 18 are traditional Chinese festival-dragon boat festivals. Obviously, the heat map shows that the number of trips before midnight is significantly higher than the one after midnight. The number of trips between 18:00 h and 24:00 h remains at a stable high level, while the one after midnight shows a significant drop. After 5:00 h, this number tends to rise. In addition, the curve shown in (b) implies that the change of the number of trips presents a cyclical fluctuation, where the number of trips on weekends (especially on Sundays) and holidays is lower than that on weekdays.
Figure 10. Temporal characteristics of hospital travel activities at night: (a) Departure time of a trip; (b) Number of trips.
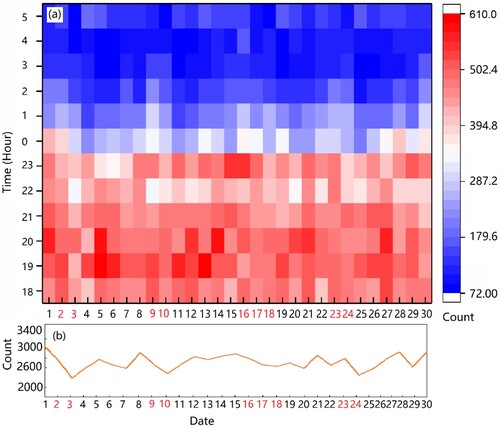
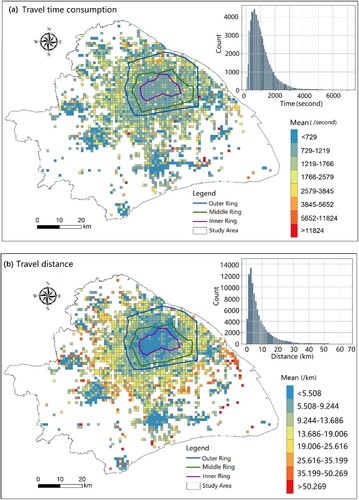
For medical travel at night, travel time consumption and travel distance are very important indicators for patients. The shorter the travel time/distance, the easier it is for patients to receive timely treatment. Among them, the travel time consumption refers to the time spent to complete a trip, and the travel distance refers to the road network distance travelled during a trip. A trajectory T is a sequence of sample points, i.e. T = (p1, p2, p3, … ,pn),where pi is a sample point containing longitude, latitude, time and other information, i.e. pi = (xi, yi, ti). The travel time consumption is obtained by subtracting the time attribute between point p1 and point pn, i.e. tn-t1. And the length of a trajectory T (travel distance) is the sum of the lengths of each adjacent pair of points (pi, pi+1), i.e. .
The statistical results in terms of travel time are shown in the histogram in (a), where the travel time is mainly distributed between 500s and 1000s (approximately 8–17 min). Overall, 75% of trips are less than 1500s (25 min). In addition, as shown in the histogram in (b), the travel distance is mainly distributed between 3 and 5 km. Overall, 75% of the trips are within 10 km. From the perspective of spatial distribution, the patterns of travel distance are consistent with the pattern of travel time, showing a ‘core-edge’ pattern. Low values are mainly distributed in the area within the rings and some streets in the suburbs. However, compared with the travel distance, the travel time consumption in the central areas within the rings is not shortest. This outcome may be related to the traffic congestion and relatively old traffic facilities in the central area.
Figure 11. (a) Travel time consumption and (b) Travel distance characteristics of hospital travel activities at night.
4.2. Results of accessibility evaluation
The results of the hospital accessibility analysis showed a clear central structure ((a)). Areas with high accessibility are mainly distributed in the central area of the city (within the outer ring), and the accessibility from the inner city to the outer area shows a decreasing trend. In addition, accessibility to the urban periphery has large internal differences. Most districts and towns in this area severely lack medical services, although there are a few towns or streets with better medical facilities (represented by the small red area in (a)).
Figure 12. Spatial distribution of (a) hospital accessibility and (b) local correlation of accessibility.
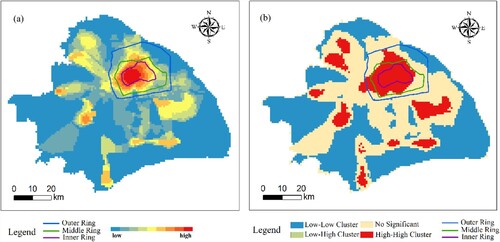
Furthermore, to quantitatively describe the spatial distribution characteristics of hospital accessibility, Moran’s I index, a classical global spatial autocorrelation index, is calculated in this section. Moran's I index was 0.97 (p <0.001). This result implies that hospital accessibility presented a strong clustering intensity in space. In addition, the local indicators of spatial association (LISA) were adopted to understand the relationship between adjacent space units and identify the hot and cold spots in the study area. As shown in (b), the high-high cluster presents an obvious agglomeration pattern, which was mainly distributed within the outer ring of Shanghai and the centre of the suburbs, accounting for 12% of the study area. The low-low cluster type occupied a large area in the suburbs, accounting for 45% of the study area.
This phenomenon might be caused by a hospital cluster in the central region, especially the centripetal distribution of high-level medical resources. Meanwhile, from the city centre to the periphery, the accessibility of hospitals showed a gradual decrease, indicating that the distance between the patients and the hospital cluster is a significant factor in restricting their hospital choice.
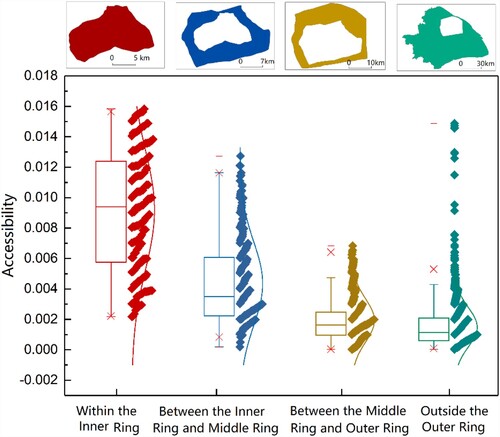
We also conducted a statistical analysis on the dispersion of different regions to intuitively understand the variation in the spatial distribution of hospital accessibility. As shown in , the study area is divided into four sub-regions from the centre to the edge by the ring roads (Outer Ring, Middle Ring and Inner Ring). By comparing the accessibility of the four regions, it is found that the accessibility from the city centre to the edge shows a downward trend, and the area within the inner ring is significantly higher than the other areas. In addition, the coefficient of variation (CV) is adopted to quantitatively evaluate the spatial difference of accessibility. The CV is a statistic, the ratio of standard deviation to mean value, which is used to measure the degree of dispersion of a data set. A higher CV indicates a poorer balance and vice versa. After calculation, the CVs of the four regions (i.e. the region within the Inner Ring, region between the Inner Ring and Middle Ring, region between the Middle Ring and Outer Ring and region outside the Outer Ring) are 0.42, 0.63, 0.74 and 0.87 respectively. This result implies that the balance of the two regions within the Middle Ring road is generally better than that of the other two regions. For regions with large CV, relevant departments should take corresponding intervention measures to improve the equalisation level of internal medical services.
Figure 13. The dispersion of hospital accessibility among different regions.
4.3. Evaluation of rationality of medical resources
To better understand the equality of the accessibility of medical resources in residential areas, we further examined the relationship between population density and hospital accessibility. The best scenario is that areas with high population density should have high hospital accessibility and vice versa.
The gridded population data from NASA (GPWv4, 1 km×1 km spatial resolution) (Warszawski et al. Citation2017) and hospital accessibility calculated in our research were adopted to evaluate the rationality of urban medical resources ( and ). First, Z-score standardisation was performed on population density data and hospital accessibility data to convert them into normal distribution data between −1 and 1. Second, we generated a Boolean variable. When the value was between −1 and 0, the grid was assigned a value of ‘low value’, and between 0 and 1, the grid was assigned a value of ‘high value’. Finally, a spatial matching analysis was performed on the corresponding grid of population and hospital accessibility data.
Figure 14. Population density of study area.
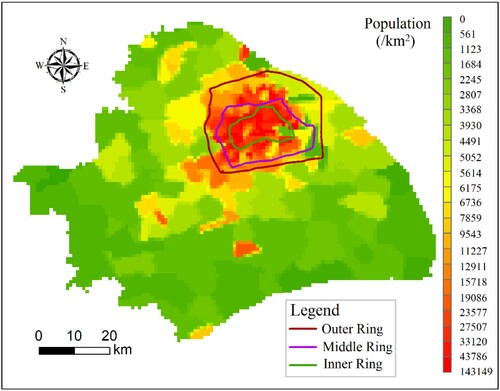
Figure 15. Balance evaluation between hospital accessibility and population density.
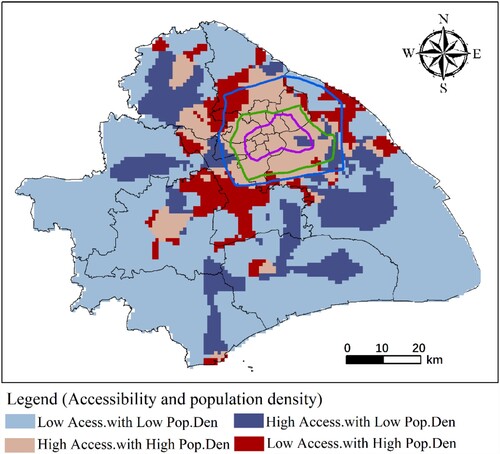
There are four situations for matching these two data: low hospital accessibility with low population density, high hospital accessibility with high population density, high hospital accessibility with low population density, and low hospital accessibility with high population density (). For each spatial unit, when high hospital accessibility was accompanied by low population density or low hospital accessibility was accompanied by high population density, the distribution of medical resources in this region was considered to be unequal, and vice versa.
The first type, low accessibility with low population density, accounted for 60% of the study area. It was mainly located in the urban periphery, with a small population, accounting for 20.9% of the population of Shanghai. The second type, high accessibility with high population density, accounted for 14% of the study area. This area is densely populated and accounted for 54.2% of the total population. It was mainly distributed in the areas within the outer ring line and was sparsely distributed in the centre of the suburbs (such as the Songjiang District and the centre of Jiading District). The third type, high accessibility along with a low population, was scattered around the periphery of the city, accounting for 17% of the study area. The fourth type, low accessibility with high population, was mainly distributed in the suburbs of cities, accounting for 9% of the study area. These areas are densely populated, accounting for 16.3% of the total population; however, medical facilities were extremely limited.
Overall, the accessibility of medical facilities in Shanghai presents strong spatial differences. In central urban areas having high hospital accessibility and high population density, the distribution of medical facilities is more reasonable to meet the medical needs of the people. In the suburbs, there are also some streets having a relatively reasonable distribution of medical facilities. In recent years, Shanghai has promoted the development of urban-rural integration through the establishment of secondary and tertiary hospitals and other forms to guide the diffusion of high-quality medical resources to the suburbs. The medical resources in the suburbs are concentrated on densely populated streets, which makes the allocation of medical facilities in this part relatively reasonable. Notably, there are obvious unbalanced characteristics of medical facilities in the suburbs around the city centre, that is, certain areas that have low hospital accessibility have a high population density. The manufacturing industry in this area is being developed, which has attracted many new immigrants, leading to a relatively high population density. However, the transportation infrastructure in the newly developed areas is still under construction, resulting in poor accessibility to medical facilities.
5. Discussion and limitations
5.1. Hospital service radius and individual hospital preference
According to existing related research, the higher the hospital level, the more likely it is to attract patients farther from the hospital (Jin et al. Citation2019). Wu, Gu, and Li (Citation2017) concluded that the time tolerance threshold for motor vehicles to visit third-class hospitals, second-class hospitals, and first-class hospitals is 60, 30, and 10 min, respectively. To explore whether the service radius and time tolerance threshold of night hospital travel are consistent with the above results, a statistical analysis method is adopted to analyse the service radius in this section. The 75th percentile is a statistically important point, which can represent the overall level of the sample data to a certain extent. Consequently, the 75th percentile was used for the statistical analysis of sample data in many fields (Gresenz, Rogowski, and Escarce Citation2004). In our study, the 75th percentile was used to analyse the service radius of hospitals.
According to , 75% of hospital trips take less than 25 min. The travel time of the first-class hospital was 24.2 min, second-class hospital was 22.3 min, and third-class hospital was the lowest at 22.5 min (). The average speed of motor vehicles in Shanghai is 25 km/h (People's Daily Online Citation2017), and the 25-min distance of motor vehicles should be approximately 10.4 km, which is consistent with the 75th percentile of hospital-home distance in this study (). This is related to the fact that people tend to choose the hospital closest to their home in the case of emergency hospital travel (Ulak et al. Citation2017), while during the day, they are willing to visit the hospitals located far away if they have enough time.
Table 1. Hospital service radius of different hospital levels.
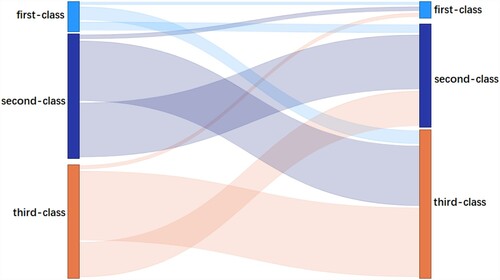
To understand the hospital choice preferences of people travelling at night, AMAP route planning data were analysed. By using the application programming interface (API), the nearest hospital from the patient's location was extracted and compared with the actual hospital selected by the patient. The hospitals we chose in this part were all comprehensive hospitals, excluding some specialised hospitals, such as psychiatric hospitals and maternal and child health hospitals. For all hospital trips, if the level of the hospital closest to home was a first-class hospital, we called the trip a first-class hospital trip; if the level of the nearest hospital was a second-class hospital, we called the trip a second-class hospital trip; and if the level of the hospital closest to home was a third-class hospital, we called it a third-class hospital trip. The difference between the nearest hospital (i.e. source) and the actual selected hospital (i.e. target) is shown in and .
Table 2. Transfer matrix of different class of hospital trips.
As shown in , among the patients who were close to the first-class hospitals, the rates of choosing first-class, second-class, and third-class hospitals were 10.86%, 34.24%, and 54.90%, respectively. Among the second-level hospital trips, the proportions of the first, second, and third-class hospitals were 3.45%, 45.88%, and 50.68%, respectively. For the third-level hospital trips, the proportions of the first, second, and third-class hospitals were 3.37%, 32.28%, and 64.35%, respectively. We used a visual graph to illustrate this result (). Overall, people tend to choose second-class and third-class hospitals for medical treatment at night. Among the first-class trips, 89.14% of the trips go to higher-level hospitals. In the second-class hospital trips, only 3.45% of the trips were associated with lower-level hospitals, 45.88% trips were made to the corresponding second-class hospital, and 50.86% bypassed the second-class hospital and choose a higher-level hospital for treatment. For the third-class hospital trips, most of them would choose the nearest hospital for treatment, with a proportion of 64.35%, and 35.65% of the trips chose lower-level hospitals. Consequently, in addition to distance/time, the factors affecting individual hospital preferences for night hospital travel were also related to other factors. First, hospital characteristics (e.g. hospital grade, reputation, service, and size) affect people’s preferences (Xue et al. Citation2007). Second, higher-level hospitals have higher medical expenses (Zeng and Ma Citation2009); therefore, some patients prefer lower-level hospitals with similar distances when their condition is not very serious. Third, medical insurance also affects individual hospital preferences (Victoor et al. Citation2012). Fourth, transport accessibility and traffic jam risk are also vital factors influencing individual hospital visits.
Figure 16. Visualisation of individual hospital preference. The source represents the class of the nearest hospital; target represents the class of the hospital actually selected.
5.2. Strengths and limitations
In this study, taxi trajectory data were used to identify emergency hospital travel and where patients come from, thus, analysing the spatial–temporal characteristics of hospital travel and evaluating the accessibility of hospitals. The developed approach can be extended to other applications (e.g. parks and commercial centres) and applied to other cities. Overall, FCD data have great potential for research in evaluating individual hospital activities. First, the volume of FCD data is considerably large; thus, the information is much more representative, and the bias caused by the small sample size is fairly small. Second, by utilising the FCD data, useful information can be extracted effectively and efficiently, avoiding issues caused by data privacy. In addition, according to the time information of the FCD trajectory data, the utilisation of hospital resources in different time periods can be used to find and solve problems more effectively, for instance, analysing hospital travel characteristics and resource utilisation in different time periods (e.g. weekdays and weekends, peak and off-peak hours, day and night, etc.). However, it is very challenging to accurately identify hospital travel based on FCD data and the boundary of the hospital, and it is difficult to verify the identification results, especially in urban centres having high POI density.
There are still some limitations in our research. First, this study did not consider the travel characteristics of some special hospitals (e.g. dental hospitals and psychiatric hospitals), which have unique service radii and characteristics compared with general hospitals. Second, the FCD data used were provided by a technology company in Shanghai. It neither includes all motor vehicle data nor considers the impact of public transportation in Shanghai. As a result, our analysis results can only be used to reveal the spatial travel characteristics of hospitals. More hospital evaluation indicators cannot be extracted only through this study (for example, the hospital visits collected by taxi cannot represent the whole visits data). Ideally, the accessibility of hospitals should be evaluated by comprehensively considering different transportation modes and even the conditions of supply and demand points. Integrating multi-source big geo-data to explore hospital visits and accessibility should be a direction for the future research.
6. Conclusion
Utilising FCD, this study proposes an approach to identify night emergency hospital travel and the locations of the patient’s home. The boundary extraction algorithm is used to delineate HSAs, and the 2SFCA algorithm is further improved to calculate and evaluate the spatial accessibility of medical facilities in Shanghai. The results indicate that 75% of the hospital travel was within 15 km. The number of night hospital trips on weekends was less than that on weekdays, and the number of trips before midnight was significantly higher than that after midnight. From the perspective of spatial distribution, urban hospital accessibility presents a strong spatial difference, showing a ‘core-edge’ pattern. Areas with higher accessibility were mainly distributed in the city centre (within the outer ring). From the inner city to the urban periphery, regional accessibility showed a downward trend, and accessibility in the urban periphery had large internal differences. In addition, this study explores the relationship between individual hospital preferences and the level of hospitals. The findings imply that people tend to choose second and third-level hospitals for medical treatment at night. These findings can provide direct inspiration for urban planning and related research. For patients to obtain high-level medical services in a timely manner, it is necessary to strengthen cooperation among tertiary, secondary, and primary hospitals. In addition, it is necessary to pay attention to the traffic conditions near the hospital (e.g. congestion) and strengthen the improvement of public transportation facilities near medical facilities. Nevertheless, the rationality of medical resource allocation is a complex social issue, and the use of medical resources is affected by many factors (discussed in Section 5.2). Unlike traditional data (e.g. patient registrations), the FCD data lacks detailed information about the travel destination; thus, it may be less effective in explaining patients’ location of residence. Consequently, future studies involving traditional survey data and various influencing factors must be considered to propose a comprehensive method for analysing and evaluating the rationality of urban public facilities. In addition, hospital travel in multiple transportation means should also be taken into consideration, which may be helpful to supplement the results of this study.
Acknowledgement
The current study was supported by National Natural Science Foundation of China [Grant No. 42171452]. The authors would like to thank the editors and anonymous reviewers for the valuable comments, which helped improve this paper. And the authors wish to thank ‘Yiren (Shanghai) Technology Co., Ltd’ for the supply of the taxi trajectory data.
Disclosure statement
No potential conflict of interest was reported by the author(s).
Data availability statement
The data that support the findings of this study are available from the corresponding author upon reasonable request.
Additional information
Funding
References
- Apparicio, P., M. Abdelmajid, M. Riva, and R. Shearmur. 2008. “Comparing Alternative Approaches to Measuring the Geographical Accessibility of Urban Health Services: Distance Types and Aggregation-Error Issues.” International Journal of Health Geographics 7 (1): 1–14.
- Asaeedi, S., F. Didehvar, and A. Mohades. 2013. “Alpha-Concave Hull, a Generalization of Convex Hull.” Journal of Clinical Oncology Official Journal of the American Society of Clinical Oncology 5 (4): 562–573.
- Barber, R. M., N. Fullman, R. J. Sorensen, T. Bollyky, M. McKee, E. Nolte, A. A. Abajobir, K. H. Abate, C. Abbafati, and K. M. Abbas. 2017. “Healthcare Access and Quality Index Based on Mortality from Causes Amenable to Personal Health Care in 195 Countries and Territories, 1990–2015: a Novel Analysis from the Global Burden of Disease Study 2015.” The Lancet 390 (10091): 231–266.
- Bauer, J., R. Müller, D. Brüggmann, and D. A. Groneberg. 2018. “Spatial Accessibility of Primary Care in England: A Cross-Sectional Study Using a Floating Catchment Area Method.” Health Services Research 53 (3): 1957–1978.
- Cao, G., S. Wang, M. Hwang, A. Padmanabhan, Z. Zhang, and K. Soltani. 2015. “A Scalable Framework for Spatiotemporal Analysis of Location-Based Social Media Data.” Computers, Environment and Urban Systems 51: 70–82.
- Chen, J., and Y. Song. 2014. “Research on Traffic Problems and Solving Strategies of Polyclinics in the City of Shenzhen.” Transportation Science and Technology 3: 186–189.
- Cheng, G., X. Zeng, L. Duan, X. Lu, H. Sun, T. Jiang, and Y. Li. 2016. “Spatial Difference Analysis for Accessibility to High Level Hospitals Based on Travel Time in Shenzhen, China.” Habitat International 53: 485–494.
- Cohen, B. 2006. “Urbanization in Developing Countries: Current Trends, Future Projections, and key Challenges for Sustainability.” Technology in Society 28 (1-2): 63–80.
- Dai, D. 2010. “Black Residential Segregation, Disparities in Spatial Access to Health Care Facilities, and Late-Stage Breast Cancer Diagnosis in Metropolitan Detroit.” Health and Place 16 (5): 1038–1052.
- Delamater, P. 2013. “Spatial Accessibility in Suboptimally Configured Health Care Systems: A Modified two-Step Floating Catchment Area (M2SFCA) Metric.” Health and Place 24: 30–43.
- Fransen, K., T. Neutens, P. De Maeyer, and G. Deruyter. 2015. “A Commuter-Based two-Step Floating Catchment Area Method for Measuring Spatial Accessibility of Daycare Centers.” Health and Place 32: 65–73.
- Gong, S., Y. Gao, F. Zhang, L. Mu, C. Kang, and Y. Liu. 2021. “Evaluating Healthcare Resource Inequality in Beijing, China Based on an Improved Spatial Accessibility Measurement.” Transactions in GIS 25 (3): 1504–1521.
- Gong, Y., Y. Lin, and Z. Duan. 2017. “Exploring the Spatiotemporal Structure of Dynamic Urban Space Using Metro Smart Card Records.” Computers, Environment and Urban Systems 64: 169–183.
- Gong, L., X. Liu, L. Wu, and Y. Liu. 2016. “Inferring Trip Purposes and Uncovering Travel Patterns from Taxi Trajectory Data.” Cartography and Geographic Information Ence 43 (2): 103–114.
- Gresenz, C., J. Rogowski, and J. Escarce. 2004. “Updated Variable-Radius Measures of Hospital Competition.” Health Services Research 39 (2): 417–430.
- Hansen, Walter G. 1959. “How Accessibility Shapes Land Use.” Journal of the American Institute of Planners 25 (2): 73–76.
- Haynes, R., A. Jones, V. Sauerzapf, and H. Zhao. 2006. “Validation of Travel Times to Hospital Estimated by GIS.” International Journal of Health Geographics 5 (1): 40.
- Hu, Y., F. Wang, and I. Xierali. 2018. “Automated Delineation of Hospital Service Areas and Hospital Referral Regions by Modularity Optimization.” Health Services Research 53 (1): 236–255.
- Huang, J., D. Levinson, J. Wang, J. Zhou, and Z. Wang. 2018. “Tracking job and Housing Dynamics with Smartcard Data.” Proceedings of the National Academy of Sciences 115 (50): 12710–12715.
- Ingram, D. 1971. “The Concept of Accessibility: a Search for an Operational Form.” Regional Studies 5 (2): 101–107.
- Jackson, C. A., K. P. Derose, J. Chiesa, and J. J. Escarce. 2002. Hospital Care for the Uninsured in Miami-Dade County. Hospital Finance and Patient Travel Patterns. Santa Monica, CA: RAND Corporation. http://www.rand.org/pubs/monograph_reports/MR1522.html.
- Jamtsho, S., R. Corner, and A. Dewan. 2015. “Spatio-temporal Analysis of Spatial Accessibility to Primary Health Care in Bhutan.” ISPRS International Journal of Geo-Information 4 (3): 1584–1604.
- Jia, P., X. Shi, and I. M. Xierali. 2019. “Teaming up Census and Patient Data to Delineate Fine-Scale Hospital Service Areas and Identify Geographic Disparities in Hospital Accessibility.” Environmental Monitoring and Assessment 191 (2): 303.
- Jia, P., F. Wang, and I. M. Xierali. 2017a. “Delineating Hierarchical Hospital Service Areas in Florida.” Geographical Review 107 (4): 608–623.
- Jia, P., F. Wang, and I. M. Xierali. 2017b. “Using a Huff-Based Model to Delineate Hospital Service Areas.” The Professional Geographer 69 (4): 522–530.
- Jia, P., I. M. Xierali, and F. Wang. 2015. “Evaluating and re-Demarcating the Hospital Service Areas in Florida.” Applied Geography 60: 248–253.
- Jiao, W., H. Fan, and Y. Wang. 2020. “Analyzing the Spatiotemporal Patterns of Emergency Medical Travels from Fcd Data.” ISPRS Annals of the Photogrammetry, Remote Sensing and Spatial Information Sciences 3: 751–756.
- Jin, M., L. Liu, D. Tong, Y. Gong, and Y. Liu. 2019. “Evaluating the Spatial Accessibility and Distribution Balance of Multi-Level Medical Service Facilities.” International Journal of Environmental Research and Public Health 16 (7): 1150.
- Jones, A., R. Haynes, V. Sauerzapf, S. Crawford, H. Zhao, and D. Forman. 2008. “Travel Time to Hospital and Treatment for Breast, Colon, Rectum, Lung, Ovary and Prostate Cancer.” European Journal of Cancer 44 (7): 992–999.
- Kan, Z., L. Tang, M. Kwan, C. Ren, D. Liu, and Q. Li. 2019. “Traffic Congestion Analysis at the Turn Level Using Taxis’ GPS Trajectory Data.” Computers, Environment and Urban Systems 74: 229–243.
- Kong, X., Y. Liu, Y. Wang, D. Tong, and J. Zhang. 2017. “Investigating Public Facility Characteristics from a Spatial Interaction Perspective: A Case Study of Beijing Hospitals Using Taxi Data.” ISPRS International Journal of Geo-Information 6 (2): 38.
- Langford, M., R. Fry, and G. Higgs. 2012. “Measuring Transit System Accessibility Using a Modified two-Step Floating Catchment Technique.” International Journal of Geographical Information Ence 26 (2): 193–214.
- Levy, N., and I. Benenson. 2015. “GIS-based Method for Assessing City Parking Patterns.” Journal of Transport Geography 46: 220–231.
- Liu, X., L. Gong, Y. Gong, and Y. Liu. 2015. “Revealing Travel Patterns and City Structure with Taxi Trip Data.” Journal of Transport Geography 43: 78–90.
- Liu, X., C. Kang, L. Gong, and Y. Liu. 2016. “Incorporating Spatial Interaction Patterns in Classifying and Understanding Urban Land use.” International Journal of Geographical Information Science 30 (2): 334–350.
- Liu, S., Y. Qin, and Y. Xu. 2019. “Inequality and Influencing Factors of Spatial Accessibility of Medical Facilities in Rural Areas of China: A Case Study of Henan Province.” International Journal of Environmental Research and Public Health 16 (10): 1833.
- Liu, F. T., K. M. Ting, and Z. Zhou. 2008. “Isolation Forest.” 2008 eighth IEEE International Conference on data mining 413-422. doi:10.1109/ICDM.2008.17.
- Liu, Y., F. Wang, Y. Xiao, and S. Gao. 2012. “Urban Land Uses and Traffic ‘Source-Sink Areas’: Evidence from GPS-Enabled Taxi Data in Shanghai.” Landscape and Urban Planning 106 (1): 73–87.
- Luo, J. 2014. “Integrating the Huff Model and Floating Catchment Area Methods to Analyze Spatial Access to Healthcare Services.” Transactions in GIS 18 (3): 436–448.
- Luo, W., and Y. Qi. 2009. “An Enhanced two-Step Floating Catchment Area (E2SFCA) Method for Measuring Spatial Accessibility to Primary Care Physicians.” Health and Place 15 (4): 1100–1107.
- Luo, W., and F. Wang. 2003. “Measures of Spatial Accessibility to Health Care in a GIS Environment: Synthesis and a Case Study in the Chicago Region.” Environment and Planning B Planning and Design 30 (6): 865–884.
- Mao, F., M. Ji, and T. Liu. 2016. “Mining Spatiotemporal Patterns of Urban Dwellers from Taxi Trajectory Data.” Frontiers of Earth Science 10 (2): 205–221.
- McGrail, M. R. 2012. “Spatial Accessibility of Primary Health Care Utilising the two Step Floating Catchment Area Method: an Assessment of Recent Improvements.” International Journal of Health Geographics 11 (1): 50.
- McGrail, M. R., and J. S. Humphreys. 2009. “Measuring Spatial Accessibility to Primary Care in Rural Areas: Improving the Effectiveness of the two-Step Floating Catchment Area Method.” Applied Geography 29 (4): 533–541.
- Mitchell, C., and S. W. Town. 1977. “Accessibility of Various Social Groups to Different Activities.” Crowthorne Berks 24 (5): 29–35.
- Mu, L., and R. Liu. 2011. “A Heuristic Alpha-Shape Based Clustering Method for Ranked Radial Pattern Data.” Applied Geography 31 (2): 621–630.
- Nakamura, T., A. Nakamura, K. Mukuda, M. Harada, and K. Kotani. 2017. “Potential Accessibility Scores for Hospital Care in a Province of Japan: GIS-Based Ecological Study of the two-Step Floating Catchment Area Method and the Number of Neighborhood Hospitals.” BMC Health Services Research 17 (1): 1–7.
- Neutens, T. 2015. “Accessibility, Equity and Health Care: Review and Research Directions for Transport Geographers.” Journal of Transport Geography 43: 14–27.
- Pan, X., M. P. Kwan, L. Yang, S. Zhou, Z. Zuo, and B. Wan. 2018. “Evaluating the Accessibility of Healthcare Facilities Using an Integrated Catchment Area Approach.” International Journal of Environmental Research and Public Health 15 (9): 2051.
- Panagiotopoulos, G., and D. Kaliampakos. 2018. “Accessibility and Spatial Inequalities in Greece.” Applied Spatial Analysis and Policy 12 (3): 567–586.
- Park, Y., J. Mount, L. Liu, N. Xiao, and H. J. Miller. 2020. “Assessing Public Transit Performance Using Real-Time Data: Spatiotemporal Patterns of bus Operation Delays in Columbus, Ohio, USA.” International Journal of Geographical Information Science 34 (2): 367–392.
- People's Daily Online. 2017. “Shanghai traffic rectification has achieved initial results, the annual average speed increased. by 4.1%.” 2017. https://www.sohu.com/a/124188282_114731 (Accessed 20 June, 2020).
- Pudong Headlines. 2019. “The time, department, address and phone number of all community hospitals in Shanghai are here!” https://www.sohu.com/a/340289253_120054679 (Accessed 28 February 2021).
- Ríos, S. A., and R. Muñoz. 2017. “Land use Detection with Cell Phone Data Using Topic Models: Case Santiago, Chile.” Computers, Environment and Urban Systems 61: 39–48.
- Shi, Y., and W. Jiang. 2017. “Point-of-interest Recommendations: Capturing the Geographical Influence from Local Trajectories.” 2017 IEEE International symposium on parallel and distributed processing with applications and 2017 IEEE International Conference on ubiquitous computing and communications (ISPA/IUCC), 1122-1129.
- Tao, Z., and Y. Cheng. 2019. “Modelling the Spatial Accessibility of the Elderly to Healthcare Services in Beijing, China.” Environment and Planning B: Urban Analytics and City Science 46 (6): 1132–1147.
- Tao, Z., Y. Cheng, T. Dai, and M. W. Rosenberg. 2014. “Spatial Optimization of Residential Care Facility Locations in Beijing, China: Maximum Equity in Accessibility.” International Journal of Health Geographics 13 (1): 33.
- Tao, Z., Y. Cheng, and J. Liu. 2020. “Hierarchical two-Step Floating Catchment Area (2SFCA) Method: Measuring the Spatial Accessibility to Hierarchical Healthcare Facilities in Shenzhen, China.” International Journal for Equity in Health 19 (1): 1–16.
- Ulak, M. B., A. Kocatepe, E. E. Ozguven, M. W. Horner, and L. Spainhour. 2017. “Geographic Information System–Based Spatial and Statistical Analysis of Severe Crash Hotspot Accessibility to Hospitals.” Transportation Research Record 2635 (1): 90–97.
- van Weerdenburg, D., S. Scheider, B. Adams, B. Spierings, and E. van der Zee. 2019. “Where to go and What to do: Extracting Leisure Activity Potentials from Web Data on Urban Space.” Computers, Environment and Urban Systems 73: 143–156.
- Victoor, A., D. M. Delnoij, R. D. Friele, and J. J. Rademakers. 2012. “Determinants of Patient Choice of Healthcare Providers: a Scoping Review.” BMC Health Services Research 12 (1): 1–16.
- Wachs, M., and T. G. Kumagai. 1973. “Physical Accessibility as a Social Indicator.” Socio-Economic Planning Sciences 7 (5): 437–456.
- Wan, N., B. Zou, and T. Sternberg. 2012. “A Three-Step Floating Catchment Area Method for Analyzing Spatial Access to Health Services.” International Journal of Geographical Information Science 26 (6): 1073–1089.
- Wang, F. 2018. “Inverted two-Step Floating Catchment Area Method for Measuring Facility Crowdedness.” The Professional Geographer 70 (2): 251–260.
- Wang, F. 2020. “Why Public Health Needs GIS: A Methodological Overview.” Annals of GIS 26 (1): 1–12.
- Wang, J., F. Du, J. Huang, and Y. Liu. 2020. “Access to Hospitals: Potential vs. Observed.” Cities 100: 102671.
- Wang, Q., M. Lu, and Q. Li. 2020. “Interactive, Multiscale Urban-Traffic Pattern Exploration Leveraging Massive GPS Trajectories.” Sensors 20 (4): 1084.
- Wang, Y., D. Tong, W. Li, and Y. Liu. 2019. “Optimizing the Spatial Relocation of Hospitals to Reduce Urban Traffic Congestion: A Case Study of Beijing.” Transactions in GIS 23 (2): 365–386.
- Warszawski, L., K. Frieler, V. Huber, F. Piontek, O. Serdeczny, X. Zhang, Q. Tang, M. Pan, Y. Tang, and Q. Tang. 2017. “Center for International Earth Science Information Network—CIESIN—Columbia University.(2016). Gridded Population of the World, Version 4 (GPWv4): Population Density. Palisades. NY: NASA Socioeconomic Data and Applications Center (SEDAC).” Atlas of Environmental Risks Facing China Under Climate Change 228, doi:10.7927/H4NP22DQ.
- Wu, C., J. Gu, and L. Li. 2017. “Judgment Method of Spatial Service Radius of Graded Hospitals—Taking Luzhou City as an Example.” Chinese Jounal of Hospital Statistics 24: 277–279.
- Xue, D., Y. Deng, J. Fan, H. Yuan, P. Zhou, Z. Zhou, Z. Chen, E. Gu, and Y. Lu. 2007. “Investigation of Medical Treatment Behavior and Flow in a Certain Area of Shanghai.” Chinese Journal of Hospital Administration 23: 441–444.
- Yang, W., H. Chen, and W. Wang. 2020. “The Path and Time Efficiency of Residents’ Trips of Different Purposes with Different Travel Modes: An Empirical Study in Guangzhou, China.” Journal of Transport Geography 88: 102829.
- Yang, G., C. Song, H. Shu, J. Zhang, T. Pei, and C. Zhou. 2016. “Assessing Patient Bypass Behavior Using Taxi Trip Origin–Destination (OD) Data.” ISPRS International Journal of Geo-Information 5 (9): 157.
- Yin, C., Q. He, Y. Liu, W. Chen, and Y. Gao. 2018. “Inequality of Public Health and its Role in Spatial Accessibility to Medical Facilities in China.” Applied Geography 92: 50–62.
- Yin, L., S. Raja, X. Li, Y. Lai, L. Epstein, and J. Roemmich. 2013. “Neighbourhood for Playing: Using GPS, GIS and Accelerometry to Delineate Areas Within Which Youth are Physically Active.” Urban Studies 50 (14): 2922–2939.
- Zeng, F., and W. Ma. 2009. “Analysis of the Characteristics of Patients in Different Hospitals.” China Modern Medicine 16: 156–159.
- Zhang, F., N. J. Yuan, D. Wilkie, Y. Zheng, and X. Xie. 2015. “Sensing the Pulse of Urban Refueling Behavior: A Perspective from Taxi Mobility.” ACM Transactions on Intelligent Systems and Technology (TIST) 6 (3): 1–23.
- Zhong, C., S. M. Arisona, X. Huang, M. Batty, and G. Schmitt. 2014. “Detecting the Dynamics of Urban Structure Through Spatial Network Analysis.” International Journal of Geographical Information Science 28 (11): 2178–2199.
- Zhou, Y., and Z. Fang. 2017. “Labeling Residential Community Characteristics from Collective Activity Patterns Using Taxi Trip Data.” The International Archives of Photogrammetry, Remote Sensing and Spatial Information Sciences 42: 1481.