
ABSTRACT
This paper introduces an improved convolutional neural network based on the conventional U-Net for simulating built-up land expansion. The proposed method hires a pixel-wise semantic segmentation approach considering the spatial drivers affecting urbanization as data cubes. Independent variables including altitude, slope, and distance from barren, crop, greenery, roads, and urban areas for 1998, 2008, and 2018 were considered as covariates for the simulation of built-up land expansion in Tehran and Karaj regions in Iran. The proposed method was compared with the random forest (RF) algorithm as the baseline model. Evaluation using the area under the total operating characteristic indicated the superiority of our modified U-Net (0.87) over the RF (0.82) algorithm. Furthermore, evaluation using the percent correct metric indicated that our proposed model is capable of learning neighborhood effects effectively leading to simulate built-up land expansion accurately, independent from applying a cellular automata (CA) model. Therefore, the modified U-Net independent from the CA which can consider the neighborhood effects is recommended for the simulation of built-up land expansion precisely.
1. Introduction
Land use and land cover change management, unbalanced built-up land expansion prevention, and providing the facilities for balanced development of cities, require information about the future amount and pattern of built-up land expansion. Land use and land cover change (LULCC) arises mostly from human effects, such as agriculture activities on the earth (Lambin, Rounsevell, and Geist Citation2000; Turner, Lambin, and Reenberg Citation2007; Sumari et al. Citation2017). Even changes occurring locally can affect the environment on a global scale (Lambin and Geist Citation2008), including global changes in climate (Kalnay and Cai Citation2003), carbon cycling (Offerman et al. Citation1995; Li et al. Citation2019), and ecosystem services (Trinder and Liu Citation2020; Shao et al. Citation2021). Built-up land expansion is one of the most common types of LULCC, which has led to the destruction of natural resources and threatened the health of humans and other organisms (Weng Citation2001; Yulianto, Maulana, and Khomarudin Citation2019). In addition to environmental goals, a wide range of urban decisions require a view of future built-up development. Built-up land expansion researchers have used a wide range of LULCC models to simulate and predict built-up land expansion, but achieving high accuracy is still a challenging issue (He et al. Citation2019).
LULCC models can be categorized into statistical models, machine learning (ML) models, and tree-based models (Pontius et al. Citation2008; Shafizadeh-Moghadam et al. Citation2017). A variety of studies have used and compared the LULCC modeling performance of different methods (Kamusoko and Gamba Citation2015; Tayyebi and Pijanowski Citation2014; Shafizadeh-Moghadam et al. Citation2017; Goetz et al. Citation2015; Tayyebi et al. Citation2014; Zare Naghadehi et al. Citation2021). Shafizadeh-Moghadam et al. (Citation2017) compared two widely used methods from each category. The investigated methods including logistic regression (LR) and multivariate adaptive regression splines (MARS) from statistical, artificial neural networks (ANNs) and support vector machine (SVM) from ML and classification and regression trees (CART) and random forest (RF) from tree-based models. Their results showed that the performance of ANNs surpass the five other models (Shafizadeh-Moghadam et al. Citation2017). The same results have also been reported by several other studies (Pijanowski, Hyndman, and Shellito Citation2001; Islam, Rahman, and Jashimuddin Citation2018). Although ANNs achieve the best results in built-up land expansion simulation, the limitation of these methods in considering the neighborhood effect in simulating built-up land expansion has forced researchers to combine them with cellular automata (CA) to address this issue.
Research on ANNs led to the genesis of deep neural networks, which are the basis of deep learning methods (Schmidhuber Citation2015). Advancements in deep learning methods and successful results reported by various studies on satellite image classification and segmentation have opened the way to their use in land use change detection (He et al. Citation2019; Huang and Wang Citation2020; Boulila et al. Citation2021; Liu et al. Citation2021). Zhou et al. (Citation2017) simulated built-up land expansion from 2000 to 2015 using multi-temporal Landsat images of Jiaxing city and integrating the heuristic bat algorithm (BA) and deep belief network (DBN) with CA. The researchers compared the proposed models with the ANN-CA model and reported some enhancements in the stability and accuracy of built-up land expansion simulation (Zhou et al. Citation2017). Among the deep learning methods, convolutional neural networks (CNNs) use convolution operators to extract the spatial features from an image by considering the relationship between the neighbors of each pixel (Albawi, Mohammed, and Al-Zawi Citation2017). By achieving remarkable results in a wide range of image processing studies, CNNs have gradually entered the remote sensing field and have been used in numerous studies for processing, classifying, and segmenting satellite images as well as for LULCC detecting (Kampffmeyer, Salberg, and Jenssen Citation2016; Lee and Kwon Citation2017; Sumbul and Demir Citation2019; Hu et al. Citation2015; Castelluccio et al. Citation2015).
A variety of empirical analyses of neighborhood characteristics have proven the strong relationship between land uses near each other, meaning that each land use is affected by its neighboring land uses (Verburg, de Nijs, et al. Citation2004; Verburg, Van Eck, et al. Citation2004). The critical role of the neighborhood effect in built-up land expansion simulation has been illustrated by several studies, and this has led to defining CA for allocating the developed pixels by considering the neighborhood as one of its parameters (Kocabas and Dragicevic Citation2006; Li, Peng Gong, and Hu Citation2017; Van Vliet, White, and Dragicevic Citation2009; Batty, Couclelis, and Eichen Citation1997; Couclelis Citation1985). CNN instinctively considers different neighborhood regions based on the network design, as the receptive field of each convolutional filter is increased during the sequences of convolutional layers.
He et al. (Citation2018) designed an effective convolution neural network integrated with CA and Markov Chain for simulating built-up land expansion in the Pearl River Delta of China during 2000–2030 (He et al. Citation2018). They compared the CNN-CA model with the deployment of three ML-based CA models (LR, ANN, and RF). The reported figure of merit (FoM) which was used for evaluating the simulation results was 0.268 for 2005 and 0.346 for 2010 simulations, which proved that CNN-CA can overcome all issues with ML methods including RF-CA, ANN-CA and LR-CA with the FoM of 0.240, 0.246 and 0.231, respectively (He et al. Citation2018). Moreover, Zhai et al. (Citation2020) proposed a CNN-VCA model, combining a convolutional neural network with vector-based cellular automata (VCA) (Zhai et al. Citation2020). CNN-VCA method was applied to simulate urban land use changes in Shenzhen, China using cadastral land use data for 2009, 2012 and 2014 (Zhai et al. Citation2020). CNN extracts high-level neighborhood features to provide a transition suitability map. Consequently, VCA simulates land use change calculating by a combination of the transition suitability, neighborhood land use condition, constraint coefficient and stochastic factor. Evaluating the land use simulation results using the FoM indicated the higher performance of the CNN-VCA in a comparison with three ML methods combined with VCA. CNN-VCA obtained the FoM value of 0.361 while LR-VCA, ANN-VCA and RF-VCA resulted in the FoM values of 0.023, 0.078 and 0.323, respectively (Zhai et al. Citation2020). These studies have used CNN but in a combination with CA to simulate built-up land expansion effectively. CNN extracts neighborhood features and CA allocates built-up pixels considering these features.
Considering that the output of typical convolutional networks is the class label assigned to each input image, these networks have no attention to localization (Ronneberger, Fischer, and Brox Citation2015). Here, localization refers to assigning a class label to each pixel, which is an important requirement for built-up land expansion simulation. As previous studies have ignored this issue, in the current study, a modified U-Net model for simulating built-up land expansion pixel-wise is introduced. U-Net was first introduced by (Ronneberger, Fischer, and Brox Citation2015), who aimed to perform pixel-wise semantic segmentation on biomedical images. It consists of an encoder-decoder structure, the former for extracting contextual information from input images for segmentation purposes, and the latter for accurately assigning each pixel to a class.
The current study proposes a novel approach for built-up land expansion simulation which applies a modified U-Net convolutional deep learning method which effectively performs pixel-wise segmentation of satellite images into developed and undeveloped classes with high accuracy, considering the localization concept. When working with a small changing area compared to the unchanged area, deep learning methods suffer from the lack of an appropriate training dataset. To cope with this problem, the conventional U-Net architecture was modified herein to obtain a balance between the accuracy of the model and the required number of training data. Therefore, the second novelty of this research refers to the proposed model that can be trained and used in small areas where training data is limited. In addition, the variables affecting built-up land expansion are considered as a data cube inspired by multi-band images in remote sensing. This approach with the input data structure allows the proposed U-Net to classify each pixel according to all variables affecting it as well as the spatial pattern of the neighborhoods around that pixel. The comparison of the results of the proposed U-Net and the random forest results showed improvement in the area under the curve (AUC) of the total operating characteristic (TOC) as an accuracy assessment metric. Furthermore, this study defined a primary assumption about the advantage of using the CNN model in considering the neighborhood effect, which is critical in built-up land expansion simulation and renders CA useless in allocating the developed pixels, as the neighborhood effect is considered by the convolutional filters, allowing the researcher use a top-down allocation method. The rest of the paper is organized as follows: Section 2 describes the dataset, study area, and the proposed methodology; the experiments and a detailed analysis are described in Section 3; and finally, conclusions derived from this research are presented in Section 4.
2. Data and methods
The dataset utilized in the current study was adopted from (Shafizadeh-Moghadam et al. Citation2021). The study area covered the megacities of Tehran and Karaj, Iran; Tehran (35◦ 41′ N and 51◦ 23′E) is the largest city, while Karaj(35◦50′ N, 50◦56′ E), a city adjacent to Tehran, is the fourth largest city in Iran (Shafizadeh-Moghadam et al. Citation2021). The total area covered by this dataset is approximately 7600 square km (Shafizadeh-Moghadam et al. Citation2021). Geographical attributes, such as the existence of the Karaj River, the Varamin Plain, and rural areas near the main road networks of Tehran give both cities a high potential for built-up land expansion (Shafizadeh-Moghadam et al. Citation2021). shows the study area used in this research.
Figure 1. Location of Tehran and Karaj regions, the study area of this research.
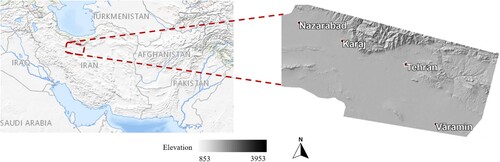
Landsat images of TM (May 1988), ETM+ (May 2008), and OLI (April 2018) with a spatial resolution of 30 meters were used to extract required parameters (Shafizadeh-Moghadam et al. Citation2021). A random forest was used to classify these images into five land cover groups, namely barren, crop, urban, water, and greenery (Shafizadeh-Moghadam et al. Citation2021). The seven independent variables considered in this study were selected from factors affecting built-up land expansion in the study area based on previous studies (Shafizadeh-Moghadam et al. Citation2021; Hu and Lo Citation2007; Shafizadeh-Moghadam et al. Citation2017). and comprise altitude, slope, and distances from specific land uses (namely, barren lands, crop lands, greenery, roads, and urban areas) and were calculated separately for 1998 and 2008. The seven independent variables of 1998 and the built-up land expansion map for the period 1998–2008 were used to train and validate the proposed U-Net. Therefore, the parameters of the proposed U-Net are defined by the training set and evaluated by the validation set. The trained model was then tested with the unseen data, i.e. the independent variables of 2008 and the built-up land expansion map for the period 2008–2018.
2.1. Data pre-processing
In the first step, the labels and the input layers are prepared. The seven effective independent variables are considered as inputs of the proposed model. These variables are stacked on top of each other to form a data cube. The advantage of using such a data structure in simulating built-up land expansion is the possibility of simultaneously considering all the variables affecting the built-up land expansion process for each location according to its neighboring pixels by convolutional filters. shows the statistical description of the variables. As can be seen, the independent variables in this research have a variety of value ranges. To make them more consistent, they were standardized between 0 and 1.
Table 1. Statistical information of the independent variables impacting built-up land expansion, used in this research.
The labels include pixels belonging to one of the two developed or undeveloped classes produced by the real built-up land expansion maps for the periods 1998–2008 and 2008–2018, which were derived from comparing their classified land cover maps. Some regions named exclusion zones could not be developed into urban areas (Pijanowski et al. Citation2002). In this research, exclusionary zones include water bodies and greeneries at the beginning of each time interval.
The input variables and labels measured 3094×5014 pixels and needed to be divided into smaller patches. Because of the direct effect of enlarging the dataset on improving the performance of CNN, these patches were created with overlap. Therefore, an experiment was designed in four stages to find the optimum dimensions for the patches and the most appropriate amount of overlap between adjacent patches. In each stage, the dimensions of the patches were 256×256, 128×128, 64×64, and 32×32, respectively. Three values of zero percent (no overlap), 50, and 75 percent were considered for the amount of overlap between the adjacent patches. These were examined on three different datasets of training, validation, and testing.
The dataset related to 1998–2008 was considered as the training and validation set, while the dataset for 2008–2018 was used to test the model. The division of the 1998–2008 dataset into two partitions of training and validation were observed in two modes. In the first mode, namely partitioning after patch creation, the main data was divided into smaller patches, and then ten percent of the patches were randomly considered for validation. The remaining patches were used for training. In the second mode, namely partitioning before patch creation, ten percent of the original data was considered as a validation dataset before the patches were built, and the remaining patches were used to train the model. This experiment helped identify the best way of partitioning data into training and validation sets. To examine the effect of the dataset split ratio into training and validation sets on the model performance, four tests using 40%, 30%, 20%, and 10% of data as validation and the remaining as training were performed.
2.2. Method
2.2.1. Modified U-Net
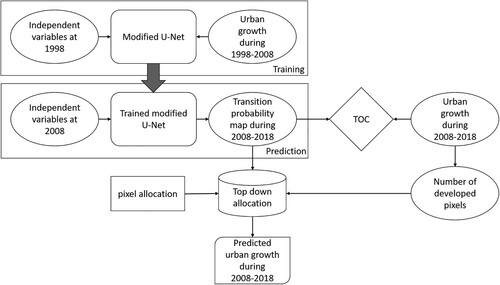
is a flowchart of the proposed method for built-up land expansion modeling. The data cubes of the seven variables affecting built-up land expansion are entered into the proposed model as input data. The output of the model is a map with dimensions equal to those of the input data, in which each pixel is assigned to one of the two developed and undeveloped classes. In this study, the conventional U-Net was modified to make it compatible with built-up land expansion modeling with limited training datasets; several experiments were needed to find the best modifications of the U-Net.
Figure 2. Flowchart of built-up land expansion simulation and prediction using modified U-Net.
A schematic illustration of the proposed model is shown in . The network architecture follows the original U-Net, which consists of a contracting or encoder path and an expansive or decoder path (Ronneberger, Fischer, and Brox Citation2015). The contracting path includes five convolution blocks. In the proposed U-Net, each contracting block consists of the repeated application of two 3 × 3 convolutions with the same padding to prevent dimension reduction, each followed by a batch normalization layer to standardize the inputs to the activation function, and an Exponential Linear Unit (ELU) as the activation function, which is similar to the ReLU and does not suffer from the problem of vanishing and/or exploding gradients. In the following, there is a spatial dropout, which randomly sets entire feature maps to 0 rather than individual pixels to prevent overfitting effectively. At the end of each convolution block, there is a 2×2 max pooling operation for down-sampling. The number of convolution filters begins with 32 at the first block in the contracting path and at each down-sampling step, this value is doubled to reach the last block with 512 feature maps.
Figure 3. Our proposed U-Net architecture, including the contracting and expanding path. Each blue box and the white box indicate a multi-channel feature map. White boxes are copied from the contracting path and pasted in the expanding path. The number of channels and dimensions of each layer are indicated on the top of and the left edge of them.
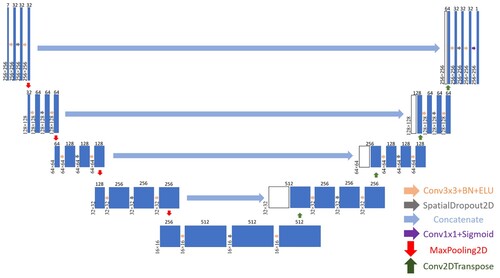
The expansive path includes four convolution blocks. Each block in this path consists of an up-sampling of the feature map performed by a transposed convolution layer that halves the number of feature channels, followed by a concatenation with the correspondingly cropped feature map from the contracting path and two 3×3 padded convolutions, each followed by a batch normalization layer, an ELU activation function, and a spatial dropout. At the final layer, a 1×1 convolution followed by a sigmoid activation function is used to map each of the 32 components of the feature vector to a probability map in which every pixel has the probability of belonging to the developed class in the range of (0, 1).
The proposed modified U-Net model has 8,637,537 trainable parameters. The loss function for this model was binary cross-entropy, and the adaptive moment estimation (Adam) was adopted as the optimizer. Because a small dataset was used in this study, data augmentation techniques of flipping and patch overlapping were utilized.
2.2.2. Random forest
Random Forest was considered as the base line model for evaluating the built-up land expansion predicted by the proposed U-Net. RF is a supervised machine learning algorithm which is an ensemble of classification and regression trees (Cutler, Richard Cutler, and Stevens Citation2012). It combines the output of multiple trees to reach a more precise result. To overcome the complexity of the RF model, Shafizadeh-Moghadam et al. (Citation2021) used a combination of the Forward Feature Selection algorithm with Random Forest (FFS-RF), which runs a RF multiple times while considering a different subset of independent variables in each run (Meyer et al. Citation2018). Herein, the FFS-RF method was used to compare with the proposed U-Net results.
2.3. Evaluation metrics
Relative operating characteristic (ROC) is a popular statistical method that compares built-up land expansion predictions with a real built-up land expansion map. This comparison for diagnosing the presence or absence of built-up land expansion is done by considering a specific threshold and determining whether the value of the prediction map is equal to or greater than the threshold (Pontius and Si Citation2014; Green and Swets Citation1966; Egan and Egan Citation1975; Fawcett Citation2006). Each threshold leads to constructing a contingency table that includes four entries: hits, misses, false alarms, and correct rejections. Hits is the number of pixels that are developed in both the real and predicted built-up land expansion maps. Misses refers to the number of pixels that are developed in the real built-up land expansion map but undeveloped in the predicted map. False alarms indicate the number of pixels that are undeveloped in the real built-up land expansion map but developed in the predicted map. And correct rejections are the number of pixels that are undeveloped in both the real and predicted built-up land expansion maps (Pontius and Si Citation2014).
ROC is a diagram that displays two ratios of false alarms / (false alarms + correct rejections) and hits / (hits + misses) for each threshold on the horizontal and vertical axes, respectively. ROC is limited by the impossibility of attaining any information about the size of each entry for each contingency table related to each threshold. This issue limits the useful measurements a scientist could have for each threshold. To address this limitation, Pontius and Si (Citation2014) proposed the TOC, which reveals all the information of a contingency table for each threshold; thus, it is more complete than ROC.
TOC, an improved version of ROC, begins with the construction of contingency tables for each threshold as mentioned for ROC with the same entries. The horizontal axis of TOC represents the total number of pixels of the developed class in the prediction map corresponding to the value of (hits + false alarms) at a certain threshold in a numerical range from zero to the total area of the study area (hits + misses + false alarms + correct rejections). The numerical range of the vertical axis of TOC, which represents the value of hits, is also between zero and the total number of pixels corresponding to the developed class in the real change map (hits + misses) (Shafizadeh-Moghadam et al. Citation2021). Therefore, TOC reveals the total number of pixels of the study area as well as the number of the developed pixels in the real change map. This enables the full retrieval of the contingency table corresponding to each threshold using the TOC diagram.
The output of the modified U-Net is a probability map in which every pixel has a value between 0 and 1, indicating its probability of developing into an urban area. Herein, a top-down cell allocation method was used to allocate developed pixels. With this method proposed by (Pijanowski et al. Citation2002), pixels with the highest transition probability were considered as developed pixels. The exact number of the developed pixels was extracted from the real change map of 2008–2018. After generating the predicted change map for 2008–2018, the error maps were produced by comparing the real and predicted change maps for 2008–2018.
3. Results and discussion
In this section, the results of the experiments mentioned in section 2.2, the results of determining the number of optimal parameters for the proposed U-Net model, examining the effect of using batch normalization method, and examining the usage of dropout layers are presented.
3.1. Adjusting the parameters used in data pre-processing
The results of the experiment of finding the optimal dimensions for the patches and their appropriate overlap are illustrated in . The results showed that the conversion of the dataset into patches of 256 × 256 and an overlap of 75% produced the best AUC for training, validation, and test datasets. The reason for this is the increase in data, which is in line with the need of deep learning networks for an extensive dataset. It should be noted that to avoid an imbalance in the number of pixels of the developed class compared to the undeveloped, only those patches containing at least ten percent developed pixels were considered.
Table 2. The results of the effect of the dimensions of the patches and the extent of overlap between adjacent patches on the performance of the U-Net model.
The results of the experiment of dividing the 1998–2008 dataset into training and validation sets in the two modes of partitioning after patch creation and partitioning before patch creation are presented in . The test dataset was the same for the two cases and differed only in the training and validation. In the first case, due to the high overlap between the patches, the probability of repeating the similar patterns in the training and validation data is high, which prohibits model from validating on a different dataset. In this case, the AUC for training and validation are 0.99, while the AUC value of 0.61 for applying this model on the test dataset indicates the poor performance of this model on a different dataset. This is an overfitting case, meaning that the proposed model has learned training and validation data so strict that it has lost its predicting power for the unseen test set. This situation did not occur in the second case. In the second case, the dataset of 1998–2008 was divided into two different partitions of training and validation sets before creating the overlapped patches. Therefore, there is no overlap between the two sets of training and validation. This helps the model become more generalized, as the validation set acts as a completely different dataset. Although this leads to a decrease in the AUC for training and validation, it prevents overfitting the model on the dataset of 1998–2008. This is shown by the increase in the AUC of the test set from 0.61–0.79. The performance of the model on all three sets of training, validation, and test datasets in the second mode was acceptable. The AUC of 0.91 for both training and validation and the AUC of 0.74 on the test dataset indicate a decrease in modeling accuracy in the second mode compared to the first one, which produces a flexible model indicating an increase in the performance on the test dataset.
Table 3. The results of dividing the dataset of Tehran and Karaj during 1998–2008 into three sets of training, validation, and test sets through two different modes of partitioning after patch creating and partitioning before patch creating.
illustrates the results of the experiment of the dataset split ratio for training and validation sets. According to the results shown in , the best performance of the U-Net model occurred in the fourth case, in which the dataset of 1998–2008 was divided into training and validation sets with ratios of 90% and 10%, respectively.
Table 4. The effect of the split ratio of two training and validation datasets on the performance of the U-Net model.
3.2. Results of modifying the U-Net
To determine the optimal number of U-Net parameters, different numbers of convolutional filters (NCF) in each convolutional block were tested in six steps, as shown in . In each step, the number of the convolutional filters of the first block of the encoding path was considered as 8, 12, 16, 32, 64, and 128, respectively. By increasing the number of convolutional filters, the number of trainable parameters of the U-Net increases, as mentioned in .
Table 5. The number of convolutional filters (NCF) in each convolutional block and the total number of trainable parameters of the U-Net.
To evaluate the impact of the number of trainable parameters in the proposed U-Net on its performance, each model with a different number of trainable parameters was trained in 100 epochs. These results of AUC can be seen for each of the 6 models in . The trained models in the mentioned six types are also applied to the test dataset.
Table 6. The results of the effect of the number of trainable parameters on the performance of the U-Net model.
According to , increasing the number of trainable parameters of the proposed U-Net model leads to higher performance. This is true until the third stage of increasing the parameters of the model, when such increase causes the model to become so complex that the training and validation datasets do not meet the needs of this model to define its parameters. The best AUC among the six models presented on the training and validation data shown in is for the fourth model, in which the structure of the U-Net model begins with 32 filters and has the total number of 8,637,537 trainable parameters. This model obtained AUC values of 0.97 and 0.96 for training and validation datasets, respectively.
The impact of adding the batch normalization method in the U-Net was also investigated with the aim of improving the performance of the U-Net for simulating and predicting built-up land expansion. The performances of the two U-Net models (with and without batch normalization) are summarized in . After training the U-Net, the trained model entered the forecasting process using the test data, the results of which are shown in and .
Figure 4. TOC obtained from the built-up land expansion predictions for Tehran and Karaj regions during 2008–2018, using the U-Net with and without batch normalization.
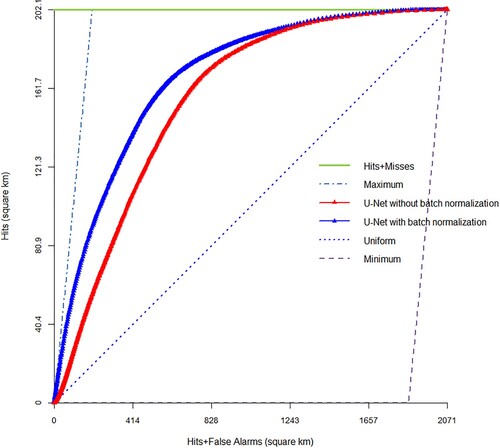
Table 7. Results of training and predicting built-up land expansion by using U-Net with and without using the batch normalization method.
According to , the AUC values of using the two U-Net models without using a batch normalization method for training, validation, and testing datasets are equal to 0.86, 0.86, and 0.81, respectively. When adding batch normalization to the U-Net, these values increased to 0.97, 0.96, and 0.86, respectively. These results indicate the significant impact of using batch normalization on the convergence of the U-Net model, especially in the current research which had a small dataset.
The effect of using the dropout method in increasing the generalizability of the U-Net model was investigated by observing the performance of this model into three models: the U-Net model without the dropout method, U-Net using the dropout method, and U-Net using the spatial dropout method. The spatial dropout method is created by making a small change in the structure of the dropout method. In the regular dropout method, neurons are randomly deleted regardless of the input data structure, while in the spatial dropout method, the structure of the input data does not change, and the removal of neurons works to maintain the dimensions of the input data. The TOC and the AUC for the training, validation, and test sets are given in and .
Figure 5. Comparing the TOC obtained from the built-up land expansion predictions for Tehran and Karaj regions during 2008–2018, using the U-Net in three modes; with dropout, without dropout, and with spatial dropout method.
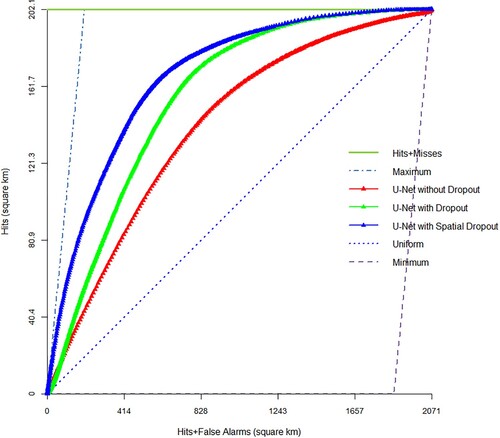
Table 8. Results of training and predicting built-up land expansion by using U-Net in three conditions of without dropout, with dropout, and with spatial dropout.
According to the TOC diagrams and AUC reported in and , using the spatial dropout method in the structure of the U-Net model effectively improved the accuracy of modeling and predicting built-up land expansion .
Figure 6. Comparing the TOC obtained from the built-up land expansion predictions for Tehran and Karaj regions during 2008–2018, using the proposed U-Net and Forward Feature Selection algorithm with Random Forest (FFS-RF).
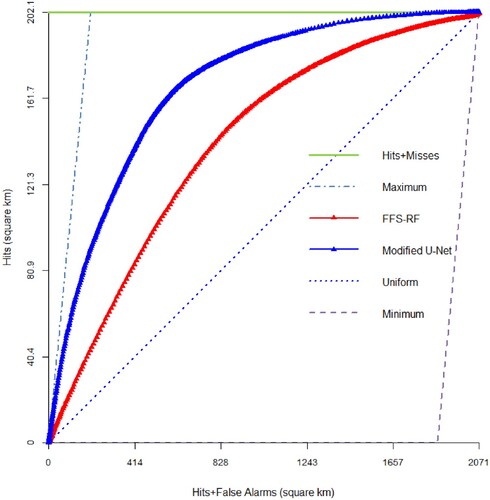
3.3. Predictive power comparison for U-Net and FFS-RF as a base line model
The TOC was used in this study to evaluate the transition probability maps produced by the proposed U-Net and the FFS-RF method proposed by Shafizadeh-Moghadam et al. (Citation2021). The AUC for each TOC of the modified U-Net and the FFS-RF baseline model is mentioned in .
Table 9. U-Net evaluation by comparing its prediction results with the results of FFS-RF as a baseline model.
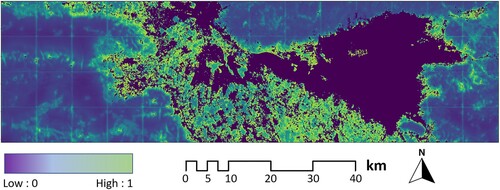
Based on the results mentioned above, the modified U-Net proposed in the current research could reach a TOC of 0.87 for predicting built-up land expansion during 2008–2018, while the AUC for the FFS-RF method was 0.82. shows the transition probability map showing the potential of built-up land expansion for 2008–2018.
Figure 7. The transition probability map for 2008–2018, using our proposed U-Net.
To justify our results in comparison with other related works, the FoM is also calculated and compared to the studies by He et al. (Citation2018) and Zhai et al. (Citation2020). The proposed modified U-Net by achieving FoM value of 0.371 proved its superiority to the UMCNN-CA model proposed by He et al. (Citation2018) and CNN-VCA model proposed by He et al. (Citation2018) with the FoM of 0.346 and 0.361, respectively.
3.4. Built-up land expansion allocation
The number of the developed pixels is 224,599 based on the real change map of 2008–2018. For allocating these pixels, a top-down and a CA model were used. The percent correct metric (PCM), which calculates the number of true positive pixels by the total number of developed pixels, was used to evaluate and compare their performance. The results, presented in , indicate relatively equal PCMs using both the top-down and CA method, which proves the primary assumption that considering the neighborhood effect by applying a CNN for built-up land expansion simulation satisfies the simulation and allocation precision and eliminates the need for combining the proposed model with a CA. Therefore, the developed pixels were allocated using a top-down method and produced the predicted change map for 2008–2018, which is presented in . An error map created by comparing the real and predicted change maps for 2008–2018 is represented in .
Figure 8. The predicted change map for 2008–2018, applying a top-down allocation on the transition probability map.
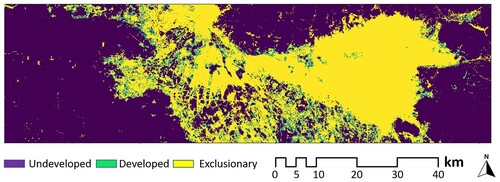
Figure 9. The error map for 2008–2018, produced by comparison between the real change map and the predicted change map.
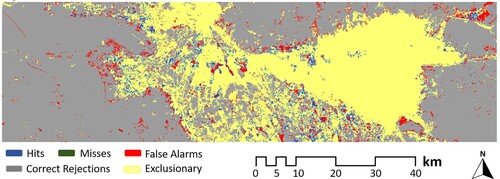
Table 10. Pixel allocation comparison between two different methods of cellular automata (CA) and a simple top-down algorithm.
4. Conclusion
This research proposed a novel approach for using a modified U-Net as a deep convolutional neural network for pixel-wise semantic segmentation for built-up land expansion modeling during the period of 1998–2008 in Tehran and Karaj provinces, Iran. One benefit of this approach is the consideration of localization using deep learning methods, which is a remarkable issue in land transformation modeling. Due to the complexity of the built-up land expansion process and the impact of neighborhoods in each region on the possibility of future built-up development in that region, the independent variables entered the network in the form of data cubes, which empowers the model to consider all factors affecting built-up land expansion as well as the neighborhood effect for each patch of the study area. Different modifications for U-Net were examined in this study to obtain a model capable of simulating and predicting built-up land expansion accurately, even if the study area is limited, which is an important issue when using a deep learning model. A predictive power comparison of the proposed modified U-Net with the AUC value of 0.87 along with a RF as a base line model with the AUC value of 0.82, conducted by TOC, showed that the proposed model is capable of simulating and predicting built-up land expansion more accurately. Furthermore, our results have proved that the proposed modified U-Net is capable of considering the neighborhood effects effectively, whose advantage is eliminating the need of using a CA to combine with our method.
Applying a modified U-Net on built-up land expansion simulation as a deep convolutional neural network which considers localization, is proposed to overcome the limitation of other methods on this subject in considering the neighborhood effect, which forces them to be combined with CA. To evidence this issue, a comparison was done between the results of the proposed modified U-Net and a simple top-down allocation with the findings of two other studies using a combination of conventional CNN models with CA. The modified U-Net by achieving FoM value of 0.371 proved its superiority to the UMCNN-CA model and CNN-VCA model with the FoM of 0.346 and 0.361, respectively. However, due to using different datasets within these studies, our suggestion for future works is to compare them on a unique dataset.
The results showed that this approach yields a precise simulation through considering the neighborhood effects, entering independent variables in the form of data cubes, and learning the complex transition rules through deep convolutional layers by CNN, and allocating effectively by a simple top-down method. Furthermore, it is possible to apply the modified U-Net on a limited area study, which gives policymakers a view of the future of an individual city to help in their decision-making.
Data availability statement
The data that support the findings of this study are openly available in ‘figshare’ at https://doi.org/10.6084/m9.figshare.15101853.v1.
Disclosure statement
No potential conflict of interest was reported by the author(s).
References
- Albawi, Saad, Tareq Abed Mohammed, and Saad Al-Zawi. 2017. “Understanding of a Convolutional Neural Network.” Paper presented at the 2017 International Conference on Engineering and Technology (ICET).
- Batty, Michael, Helen Couclelis, and Mark Eichen. 1997. “Urban Systems as Cellular Automata.” Environment and Planning B: Planning and Design 24 (2): 159–164.
- Boulila, Wadii, Hamza Ghandorh, Mehshan Ahmed Khan, Fawad Ahmed, and Jawad Ahmad. 2021. “A Novel CNN-LSTM-Based Approach to Predict Urban Expansion.” Ecological Informatics 64: 101325.
- Castelluccio, Marco, Giovanni Poggi, Carlo Sansone, and Luisa Verdoliva. 2015. “Land Use Classification in Remote Sensing Images by Convolutional Neural Networks.” arXiv preprint arXiv:1508.00092.
- Couclelis, Helen. 1985. “Cellular Worlds: A Framework for Modeling Micro—Macro Dynamics.” Environment and Planning A: Economy and Space 17 (5): 585–596.
- Cutler, Adele, D. Richard Cutler, and John R. Stevens. 2012. “Random Forests.” In Ensemble Machine Learning, edited by C. Zhang and Y. Ma, 157–175. Boston, MA: Springer.
- Egan, James P., and James Pendleton Egan. 1975. Signal Detection Theory and ROC-Analysis. New York: Academic Press.
- Fawcett, Tom. 2006. “An Introduction to ROC Analysis.” Pattern Recognition Letters 27 (8): 861–874.
- Goetz, J. N., Alexander Brenning, Helene Petschko, and Philip Leopold. 2015. “Evaluating Machine Learning and Statistical Prediction Techniques for Landslide Susceptibility Modeling.” Computers & Geosciences 81: 1–11.
- Green, David Marvin, and John A. Swets. 1966. Signal Detection Theory and Psychophysics. Vol. 1. New York: Wiley.
- He, Jialv, Xia Li, Yao Yao, Ye Hong, and Zhang Jinbao. 2018. “Mining Transition Rules of Cellular Automata for Simulating Urban Expansion by Using the Deep Learning Techniques.” International Journal of Geographical Information Science 32 (10): 2076–2097.
- He, Chunyang, Zhifeng Liu, Siyuan Gou, Qiaofeng Zhang, Jinshui Zhang, and Linlin Xu. 2019. “Detecting Global Urban Expansion Over the Last Three Decades Using a Fully Convolutional Network.” Environmental Research Letters 14 (3): 034008.
- Hu, Wei, Yangyu Huang, Li Wei, Fan Zhang, and Hengchao Li. 2015. “Deep Convolutional Neural Networks for Hyperspectral Image Classification.” Journal of Sensors 2015: 258619.
- Hu, Zhiyong, and C. P. Lo. 2007. “Modeling Urban Growth in Atlanta Using Logistic Regression.” Computers, Environment and Urban Systems 31 (6): 667–688.
- Huang, Bo, and Jionghua Wang. 2020. “Big Spatial Data for Urban and Environmental Sustainability.” Geo-Spatial Information Science 23 (2): 125–140.
- Islam, Kamrul, Md Farhadur Rahman, and Mohammed Jashimuddin. 2018. “Modeling Land Use Change Using Cellular Automata and Artificial Neural Network: The Case of Chunati Wildlife Sanctuary, Bangladesh.” Ecological Indicators 88: 439–453.
- Kalnay, Eugenia, and Ming Cai. 2003. “Impact of Urbanization and Land-Use Change on Climate.” Nature 423 (6939): 528–531.
- Kampffmeyer, Michael, Arnt-Borre Salberg, and Robert Jenssen. 2016. “Semantic Segmentation of Small Objects and Modeling of Uncertainty in Urban Remote Sensing Images Using Deep Convolutional Neural Networks.” Paper presented at the Proceedings of the IEEE Conference on Computer Vision and Pattern Recognition Workshops.
- Kamusoko, Courage, and Jonah Gamba. 2015. “Simulating Urban Growth Using a Random Forest-Cellular Automata (RF-CA) Model.” ISPRS International Journal of Geo-Information 4 (2): 447–470.
- Kocabas, Verda, and Suzana Dragicevic. 2006. “Assessing Cellular Automata Model Behaviour Using a Sensitivity Analysis Approach.” Computers, Environment and Urban Systems 30 (6): 921–953.
- Lambin, Eric F., and Helmut J. Geist. 2008. Land-Use and Land-Cover Change: Local Processes and Global Impacts. Berlin: Springer Science & Business Media.
- Lambin, Eric F. M. D. A., Mark D. A. Rounsevell, and Helmut J. Geist. 2000. “Are Agricultural Land-Use Models Able to Predict Changes in Land-Use Intensity?” Agriculture, Ecosystems & Environment 82 (1–3): 321–331.
- Lee, Hyungtae, and Heesung Kwon. 2017. “Going Deeper with Contextual CNN for Hyperspectral Image Classification.” IEEE Transactions on Image Processing 26 (10): 4843–4855.
- Li, Deren, Jun Ma, Tao Cheng, John L. van Genderen, and Zhenfeng Shao. 2019. “Challenges and Opportunities for the Development of Megacities.” International Journal of Digital Earth 12 (12): 1382–1395.
- Li, Xuecao, Le Yu Peng Gong, and Tengyun Hu. 2017. “A Segment Derived Patch-Based Logistic Cellular Automata for Urban Growth Modeling with Heuristic Rules.” Computers, Environment and Urban Systems 65: 140–149.
- Liu, Jiamin, Bin Xiao, Yueshi Li, Xiaoyun Wang, Qiang Bie, and Jizong Jiao. 2021. “Simulation of Dynamic Urban Expansion Under Ecological Constraints Using a Long Short Term Memory Network Model and Cellular Automata.” Remote Sensing 13 (8): 1499.
- Meyer, Hanna, Christoph Reudenbach, Tomislav Hengl, Marwan Katurji, and Thomas Nauss. 2018. “Improving Performance of Spatio-Temporal Machine Learning Models Using Forward Feature Selection and Target-Oriented Validation.” Environmental Modelling & Software 101: 1–9.
- Offerman, Holly L., Virginia H. Dale, Scott M. Pearson, Robert V. O'Neill, and Richard O. Bierregaard, Jr. 1995. “Effects of Forest Fragmentation on Neotropical Fauna: Current Research and Data Availability.” Environmental Reviews 3 (2): 191–211.
- Pijanowski, Bryan C., Daniel G. Brown, Bradley A. Shellito, and Gaurav A. Manik. 2002. “Using Neural Networks and GIS to Forecast Land Use Changes: A Land Transformation Model.” Computers, Environment and Urban Systems 26 (6): 553–575.
- Pijanowski, Bryan C., David Hyndman, and Bradley A. Shellito. 2001. “The Application of the Land Transformation, Groundwater Flow and Solute Transport Models for Michigan’s Grand Traverse Bay Watershed.” Paper presented at the Proceedings of the National American Planning Association Meeting, New Orleans, LA, USA.
- Pontius, Robert Gilmore, Wideke Boersma, Jean-Christophe Castella, Keith Clarke, Ton de Nijs, Charles Dietzel, Zengqiang Duan, Eric Fotsing, Noah Goldstein, and Kasper Kok. 2008. “Comparing the Input, Output, and Validation Maps for Several Models of Land Change.” The Annals of Regional Science 42 (1): 11–37.
- Pontius, Robert Gilmore, Jr., and Kangping Si. 2014. “The Total Operating Characteristic to Measure Diagnostic Ability for Multiple Thresholds.” International Journal of Geographical Information Science 28 (3): 570–583.
- Ronneberger, Olaf, Philipp Fischer, and Thomas Brox. 2015. “U-net: Convolutional Networks for Biomedical Image Segmentation.” Paper presented at the International Conference on Medical Image Computing and Computer-Assisted Intervention.
- Schmidhuber, Jürgen. 2015. “Deep Learning in Neural Networks: An Overview.” Neural Networks 61: 85–117.
- Shafizadeh-Moghadam, Hossein, Ali Asghari, Amin Tayyebi, and Mohammad Taleai. 2017. “Coupling Machine Learning, Tree-Based and Statistical Models with Cellular Automata to Simulate Urban Growth.” Computers, Environment and Urban Systems 64: 297–308.
- Shafizadeh-Moghadam, Hossein, Masoud Minaei, Robert Gilmore Pontius Jr., Ali Asghari, and Hashem Dadashpoor. 2021. “Integrating a Forward Feature Selection Algorithm, Random Forest, and Cellular Automata to Extrapolate Urban Growth in the Tehran-Karaj Region of Iran.” Computers, Environment and Urban Systems 87: 101595.
- Shao, Zhenfeng, Neema S. Sumari, Aleksei Portnov, Fanan Ujoh, Walter Musakwa, and Paulo J. Mandela. 2021. “Urban Sprawl and its Impact on Sustainable Urban Development: A Combination of Remote Sensing and Social Media Data.” Geo-Spatial Information Science 24 (2): 241–255.
- Sumari, N. S., Z. Shao, M. Huang, C. A. Sanga, and J. L. Van Genderen. 2017. “Urban Expansion: A Geo-spatial Approach for Temporal Monitoring of Loss of Agricultural Land.”
- Sumbul, Gencer, and Begüm Demir. 2019. “A Novel Multi-attention Driven System for Multi-label Remote Sensing Image Classification.” Paper presented at the IGARSS 2019-2019 IEEE International Geoscience and Remote Sensing Symposium.
- Tayyebi, Amin, and Bryan C Pijanowski. 2014. “Modeling Multiple Land Use Changes Using ANN, CART and MARS: Comparing Tradeoffs in Goodness of Fit and Explanatory Power of Data Mining Tools.” International Journal of Applied Earth Observation and Geoinformation 28: 102–116.
- Tayyebi, Amin, Bryan C Pijanowski, Marc Linderman, and Claudio Gratton. 2014. “Comparing Three Global Parametric and Local Non-Parametric Models to Simulate Land Use Change in Diverse Areas of the World.” Environmental Modelling & Software 59: 202–221.
- Trinder, John, and Qingxiang Liu. 2020. “Assessing Environmental Impacts of Urban Growth Using Remote Sensing.” Geo-Spatial Information Science 23 (1): 20–39.
- Turner, Billie L., Eric F. Lambin, and Anette Reenberg. 2007. “The Emergence of Land Change Science for Global Environmental Change and Sustainability.” Proceedings of the National Academy of Sciences 104 (52): 20666–20671.
- Van Vliet, Jasper, Roger White, and Suzana Dragicevic. 2009. “Modeling Urban Growth Using a Variable Grid Cellular Automaton.” Computers, Environment and Urban Systems 33 (1): 35–43.
- Verburg, Peter H., Ton C. M. de Nijs, Jan Ritsema van Eck, Hans Visser, and Kor de Jong. 2004. “A Method to Analyse Neighbourhood Characteristics of Land Use Patterns.” Computers, Environment and Urban Systems 28 (6): 667–690.
- Verburg, Peter H., Jan R. Ritsema Van Eck, Ton C. M. de Nijs, Martin J. Dijst, and Paul Schot. 2004. “Determinants of Land-Use Change Patterns in the Netherlands.” Environment and Planning B: Planning and Design 31 (1): 125–150.
- Weng, Qihao. 2001. “A Remote Sensing? GIS Evaluation of Urban Expansion and its Impact on Surface Temperature in the Zhujiang Delta, China.” International Journal of Remote Sensing 22 (10): 1999–2014.
- Yulianto, Fajar, Taufik Maulana, and Muhammad Rokhis Khomarudin. 2019. “Analysis of the Dynamics of Land Use Change and Its Prediction Based on the Integration of Remotely Sensed Data and CA-Markov Model, in the Upstream Citarum Watershed, West Java, Indonesia.” International Journal of Digital Earth 12 (10): 1151–1176.
- Zare Naghadehi, Saeid, Milad Asadi, Mohammad Maleki, Seyed-Mohammad Tavakkoli-Sabour, John Lodewijk Van Genderen, and Samira-Sadat Saleh. 2021. “Prediction of Urban Area Expansion with Implementation of MLC, SAM and SVMs’ Classifiers Incorporating Artificial Nvneural Network Using Landsat Data.” ISPRS International Journal of Geo-Information 10 (8): 513.
- Zhai, Yaqian, Yao Yao, Qingfeng Guan, Xun Liang, Xia Li, Yongting Pan, Hanqiu Yue, Zehao Yuan, and Jianfeng Zhou. 2020. “Simulating Urban Land Use Change by Integrating a Convolutional Neural Network with Vector-Based Cellular Automata.” International Journal of Geographical Information Science 34 (7): 1475–1499.
- Zhou, Ye, Feng Zhang, Zhenhong Du, Xinyue Ye, and Renyi Liu. 2017. “Integrating Cellular Automata with the Deep Belief Network for Simulating Urban Growth.” Sustainability 9 (10):1786.