
 ?Mathematical formulae have been encoded as MathML and are displayed in this HTML version using MathJax in order to improve their display. Uncheck the box to turn MathJax off. This feature requires Javascript. Click on a formula to zoom.
ABSTRACT
With the rapid development of satellite technology, the amount of remote sensing data and demand for remote sensing data analysis over large areas are greatly increasing. Hence, it is necessary to quickly filter out an optimal dataset from massive dataset to support various remote sensing applications. However, with the improvements in temporal and spatial resolution, remote sensing data have become fragmented, which brings challenges to data retrieval. At present, most data service platforms rely on the query engines to retrieve data. Retrieval results still have a large amount of data with a high degree of overlap, which must be manually selected for further processing. This process is very labour-intensive and time-consuming. This paper proposes an improved coverage-oriented retrieval algorithm that aims to retrieve an optimal image combination with the minimum number of images closest to the imaging time of interest while maximized covering the target area. The retrieval efficiency of this algorithm was analysed by applying different implementation practices: Arcpy, PyQGIS, and GeoPandas. The experimental results confirm the effectiveness of the algorithm and suggest that the GeoPandas-based approach is most advantageous when processing large-area data.
1. Introduction
The number of satellites continues to increase with the rapid development of Earth observation technology (Zhu et al. Citation2021b; He et al. Citation2015). Likewise, the amount of accumulated remote sensing data has increased exponentially from a terabyte scale to a petabyte scale, contributing to ‘big data’ (Ma et al. Citation2015; Chen et al. Citation2021). However, due to the vastness of the Earth's surface and its spherical characteristics, the original image data are flaky, fragmented, and discontinuous in time and space relative to the entire Earth. Although satellite constellation technology and multi-satellite networking technology are best at filling the gap in spatiotemporal data (Yao et al. Citation2019), the rapid growth in the amount of data presents a challenge to data retrieval.
As an important means of Earth observation, remote sensing has been widely applied in the fields of land resource surveying, disaster monitoring, crop yield estimation, weather forecasting, and mineral resource exploration (Nemni et al. Citation2020; Zhu et al. Citation2021a; Shi et al. Citation2022). The demand for large-area data change analysis has also increased significantly, e.g. for large-area environmental monitoring (Gu and Wei Citation2021), monitoring of economic development in the Belt and Road Initiative (Xiao et al. Citation2020), and assessing changes in forest coverage (Lossou, Owusu-Prempeh, and Agyemang Citation2019). In response to the rapid generation of large-area regional time-series images, an optimal image combination should first be selected from large-area remote sensing data under time and space constraints. The images nearest the required time should be selected to reduce the difference in features between adjacent images; this serves the subsequent image mosaic tasks. Data retrieval is difficult and complex; manual selection is time-consuming and labor-intensive, and it cannot be integrated into the existing data service system. However, it is very important to quickly and accurately find the data of interest within the massive amount of available data. Therefore, fast and accurate data-retrieval methods using metadata are becoming a popular research topic in the field of remote sensing data management (He Citation2017).
Traditional remote sensing data-retrieval methods mostly rely on query engines based on spatial databases to search for eligible results from a massive amount of data. Many remote sensing platforms provide query methods, such as NASA Level-1 and Atmosphere Archive & Distribution System Distributed Active Archive Center (LAADS DAAC) (https://ladsweb.modaps.eosdis.nasa.gov/), United States Geological Survey (USGS) (http://glovis.usgs.gov/), The Global Land Cover Facility (GLCF) (http://landcover.org/), and other remote sensing data-sharing platforms. Domestic platforms include China Resources Satellite Application Center Data Service Platform (http://www.cresda.com/CN/), Remote Sensing Market Data Center (http://www.rscloudmart.com/), Geospatial Data Cloud (http://www.gscloud.cn/), and the Earth observation data-sharing platform provided by the China Remote Sensing Satellite Ground Station (http://eds.ceode.ac.cn/). However, traditional remote sensing data-query methods have shortcomings. The settings of query conditions are relatively fixed. For example, users can typically only set a specific spatial range, time range, and threshold for the highest cloud cover for optical remote sensing satellite data. In many application scenarios, the results of a query only meet the requirements of preliminary retrieval. Further, the number of entries in the query results can total hundreds or thousands. If users want to finely filter the ideal results, they must use manual selection, which is time-consuming, labor-intensive, and inefficient. Therefore, it is important to quickly and automatically retrieve remote sensing image datasets that (1) exhibit excellent cloud coverage, (2) meet the imaging time requirements flexibly set by users, and (3) completely cover the target area using the fewest number of images to reduce the users’ workload.
Scholars have conducted many studies on remote sensing data-retrieval methods. Gong (Citation2011), Chen (Citation2006), and Yuan (Citation2013) carried out research on remote sensing image data retrieval based on grid retrieval and remote sensing tile retrieval. Zhang (Citation2011), Bi (Citation2008), Liu (Liu and Gu Citation2013), and others have researched spatial-relation retrieval based on the remote sensing image retrieval of spatial relations. Li et al. (Citation2006) and Xue et al. (Citation2013) presented fast query and retrieval of massive spatial data, but they did not involve further retrieval of remote sensing data. Miao et al. (Citation2010) proposed rapid query technology for the coverage of multi-source remote sensing data in response to the problem of the independence of satellite data-query systems; however, preliminary retrieval of data-query conditions was used without further retrieval of the minimum number of images needed to cover the entire study area. Egenhofer (Citation1996) studied the retrieval method of sketching spatial data, Lee and Chin (Citation1995) proposed a visual query based on topological relations in GIS, Bretschneider, Cavet, and Kao (Citation2002) proposed a retrieval and query technology based on image spectral information, and Chaudhuri et al. (Citation2016) performed a matching strategy for regional retrieval of remote sensing images. Note that these studies did not consider the issue of remote sensing data retrieval for regional coverage. Kempeneers and Soille (Citation2017) studied on the creation of a cloud-free composite that covers the global land mass, a first selection based on quality is performed, then the minimum set is created from the reduced set.
Other scholars have further researched data retrieval. He et al. (Citation2017) used a full-coverage retrieval method within a massive amount of data for a single time phase based on spatial secondary filtering; the dataset was sorted according to a weight combination, and the data with the most weight was added to the results until the target area was completely covered or the dataset was completely traversed. However, selecting data in descending order of weight does not consider the size of the intersection between the newly selected image and the uncovered target area for each iteration. This process results in dense stacking of multiple images with large weights in the retrieval results. Furthermore, the number of images in the retrieval results is greater than the minimum possible. Li et al. (Citation2017) proposed an optimal dataset screening model for remote sensing imagery regional coverage. By grid-splitting the area and normalizing the filtering parameters, the image with the largest weight covering each grid is retained, and the results are deduplicated. Retaining the image with the largest weight covering each grid does not easily guarantee the minimum number of retrieval results, and the grid size affects the performance of the algorithm. If the grid is too large, the final retrieval result may be missing data along the boundary of the target area. If the grid is too small, the number of calculations will increase exponentially, and the performance of the algorithm will decrease. Yang and Yan (Citation2019) conducted research on optimal region coverage for Ziyuan-3 satellite images using the effective range of a remote sensing image (image-inscribed rectangle) to continuously cut the target research area and obtain the image set; the final step was to perform deduplication. However, in the image retrieval process, a comparison of attribute conditions is not considered, and the algorithm uses the inscribed rectangle of the image as the effective range. This process causes a large loss in the spatial coverage of the image.
As a member of the International Resource Satellite Ground Station Network, China Remote Sensing Satellite Ground Station links to one of the largest numbers of receiving and processing satellite systems in the world. There have been more than 3.6 million scenes of various Earth-observation images since 1986, providing approximately 2 PB of data. This is the largest historical archive of Earth-observation satellite data in China (Li et al. Citation2021). However, this Earth-observation data-sharing service system can only achieve preliminary data retrieval, and the remote sensing data query and retrieval function needs to be improved. It is an urgent need to realize the optimization of the coverage-oriented data retrieval algorithm. Based on the actual need and shortcomings of existing methods, this paper proposes an improved coverage-oriented retrieval algorithm for large-area remote sensing data. Spatial calculations are performed using image data, then a weight-based selection model is built according to the ratio of the number of fragments contained in images to the imaging time difference. Compared with manual selection, the efficiency of data retrieval is greatly improved. Compared with grid division, it achieves more refined spatial calculations. The algorithm directly uses spatial calculations to obtain non-overlapping fragments that accurately cover the target area, while grids cannot accurately express the target area along the boundary. The algorithm was implemented using Gaofen-6 satellite image data in three function-libraries: Arcpy, PyQGIS, and GeoPandas. The experimental results show that the algorithm can automatically filter out an optimal combination of images that are (1) closest to the time of interest, (2) exhibit low image overlap, and (3) result in a small number of images. The improved algorithm can effectively shorten the data retrieval time and improve user efficiency. By comparing the three experimental approaches, the GeoPandas-based approach is most advantageous in processing large-area data and is most suitable for subsequent data-service system integration work.
The paper is organized as follows. Section 2 outlines the materials and methods. Section 3 describes the experiments and results. Section 4 provides a discussion, while the conclusion is given in Section 5.
2. Materials and methods
2.1. Methods
The improved coverage-oriented retrieval algorithm uses the effective range of images to split the target area. The image quality is evaluated based on imaging time, resolution, cloud cover, etc. Then, the weight of each image is calculated according to the ratio of the number of fragments contained in it to the evaluated image quality, the imaging time is used as the quality evaluation parameter in this paper. Finally, according to the weight of each image, images are selected until the maximum target-area coverage is reached and the optimal image combination with the fewest images closed to the time of interest is obtained. The specific process is as follows.
(1) Data pre-retrieval
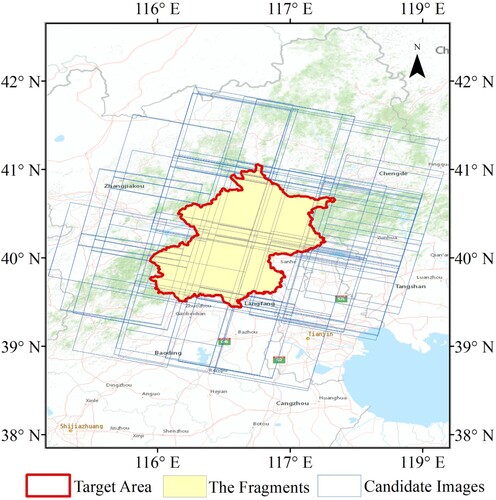
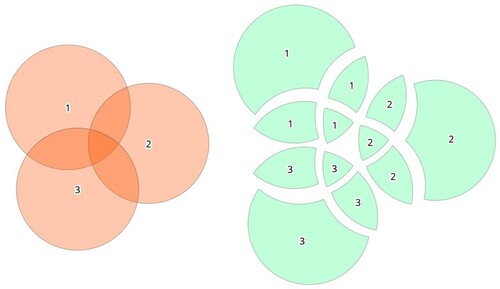
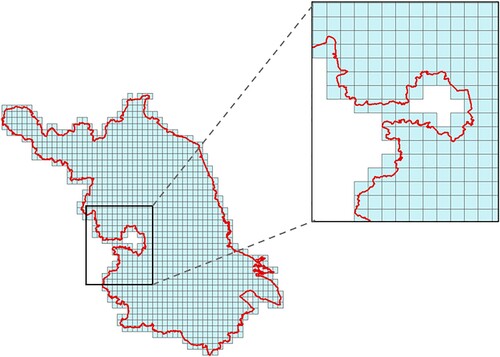
Retrieve the remote sensing image data in advance. By setting conditions such as target-area range, sensor type, imaging time period, and maximum cloud cover, qualified remote sensing images are filtered to candidate dataset , indicated by the blue boxes in .
Figure 1. Candidate images of the target area and the fragments resulting from the mutual splitting processing.
(2) Data processing
The target region is used to clip the candidate dataset
, and the effective range of these images in the target region is obtained, in which the effective range refers to the area where the image intersects the target region.
The effective range of images are used to split each image into non-overlapping fragments, which is equivalent to the entire target area being divided into fragments. The fragments resulting from the mutual splitting processing are deduplicated to generate a fragmented geometric element set
The effective range of each image and the fragmented geometric element set
(3) Calculate the weight of each image
The number of fragments in the fragmented geometric element set contained in each image (
) is calculated. The difference between the imaging time and the time of interest, in days, is recorded as
, where the time of interest refers to the imaging time that the users are most concerned about. The quality evaluation parameters can be freely set, so the imaging time difference is used for this evaluation here. The images can be selected according to the weight
. With the user’s time of interest as the central point, imaging times nearest the center time result in a smaller
and a greater relative weight. The larger the number of fragments the image contains, the greater the relative weight.
(4) Data selection
To ensure that the entire area is completely covered, if a section of the target area is only covered by one image (i.e. not covered by other images), then the image is preferentially selected. Specifically, when the amount of data in an area is insufficient, and only one image is providing coverage, then the image is selected. The specific steps are as follows:
Find the set
If set
After the selection, the fragments contained in the selected images set
Then, the remaining images are traversed to select the images according to the weight. The image with the maximum is added to image set
as the first selected image in this step. The fragments contained in the selected image are removed from the fragmented geometric element set
, then the image corresponding to the maximum
in the remaining images is selected. The loop is iterated according to this rule. When the selected images can completely contain all the fragments (i.e. the images can completely cover the target area), the selection is completed and image set
is the final result. When all of the data cannot completely cover the target area, then the corresponding retrieval results have achieved the maximum coverage of the target area. The data selection process is shown in , the image with the maximum weight is selected in each cycle. When the selected image completely covers the target region, the cycle ends.
Figure 2. Data selection process.
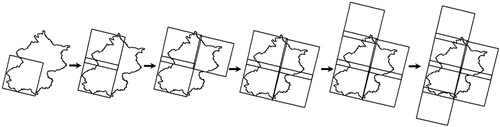
Each time an image is selected, the fragments contained in the image are removed from the fragmented geometric element set. This process ensures that each time the image is selected, the image with the closest imaging time and the largest number of fragments in the remaining images is selected (i.e. the image with the largest contribution to the uncovered target area). The process is elaborated in Algorithm 1.
Algorithm 1. The improved coverage-oriented retrieval algorithm.
2.2. Implementation practices
This study applies different practices based on Arcpy, PyQGIS, and GeoPandas to implement the algorithm. The three approaches achieve nearly the same effect of calling the function at each step. The only difference among the three approaches is the underlying implementation of the union function that will be called when the effective range of each image is split; this leads to a difference between the fragment sets. When the fragment sets are inconsistent, the retrieval results are impacted. The union operation is a key step in data processing, and the following is a description of the differences in the implementation of the union function by the frameworks used by the three approaches.
2.2.1 Arcpy-based approach
Based on ArcGIS, Arcpy allows users to operate all geoprocessing tools (including ArcGIS extension modules) with Python, and it provides a variety of useful functions and classes. The library provides a foundation for performing data-processing analysis, data conversion, data management, and map automation through Python in a practical and efficient manner. Therefore, when using Python with Arcpy, batch processing of geographic or remotely-sensed big data can be achieved.
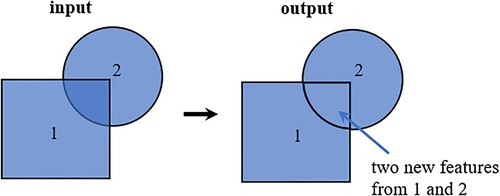
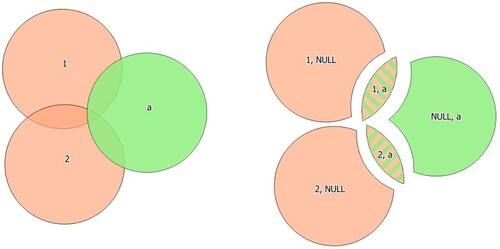
Arcpy calls the union function to split images. When executed, the elements will be cracked and clustered. The cracking operation inserts vertices at the intersection of the element edges, and the clustering operation captures the vertices within the x, y tolerance. Then, the function discovers the geometric relationship between the features in all feature classes and writes the new features to the output (https://desktop.arcgis.com/en/arcmap/latest/tools/analysis-toolbox/how-union-analysis-works.htm). If the elements in the feature class used overlap, the overlapping area is repeated to retain all attributes and areas, as shown in . In order to ensure that the obtained fragments do not overlap each other, a deduplication operation needs to be performed afterward.
Figure 3. Union operation with an input layer in Arcpy.
The union tool in Arcpy can process a single input element class or layer. In this case, the tool will find overlapping areas between elements in a single input, rather than between polygonal elements in different element classes or layers. Therefore, the effective range of the image can be directly used as a single input to obtain the fragment results.
2.2.2 PyQGIS-based approach
PyQGIS is a Python-based QGIS library. QGIS is a user-friendly open-source desktop software that can run on platforms such as Linux, Unix, Mac OSX, and Windows. It is a cross-platform open-source desktop geographic information system based on the cross-platform graphics tool Qt software package, and it was developed using C++. The main features of QGIS software are as follows:
Supports multiple GIS data file formats; can support up to dozens of data formats through GDAL/OGR extension;
Supports PostGIS database;
Support in retrieving data from WMS, WFS server.
Integrates some functions of GRASS GIS;
Supports basic operations on GIS data, such as editing and modifying attributes;
Supports the creation of maps;
Supports function expansion in the form of plug-ins.
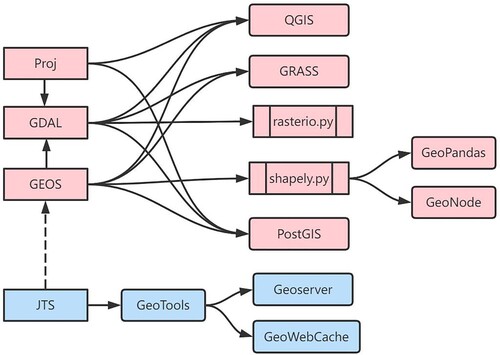
As shown in , like most open-source GIS software, QGIS depends on the Geos library recompiled from the Java JTS library. QGIS was chosen for the experiment because it is open source and can run on multiple platforms(https://blog.crunchydata.com/blog/waiting-for-postgis-3.1-geos-3.9).
Figure 4. Relationship between professional geospatial libraries.
The union operation principle of QGIS is as follows: check overlaps between features within the input layer and create separate features for the overlapping and non-overlapping parts. The area of overlap will create as many identical overlapping features as there are features that participate in that overlap, as shown in (https://docs.qgis.org/3.16/en/docs/user_manual/processing_algs/qgis/vectoroverlay.html#union).
Figure 5. Union operation with a single input layer of three overlapping features (left). Resulting features are moved apart for clarity (right).
As seen in , an overlay layer can also be used, in which case features from each layer are split at their overlap with features from the other to create a layer containing all the portions from both input and overlay layers. The attribute table of the union layer is filled with attribute values from the respective original layer for non-overlapping features, and attribute values from both layers for overlapping features (https://docs.qgis.org/3.16/en/docs/user_manual/processing_algs/qgis/vectoroverlay.html#union).
Figure 6. Union operation with a two-feature input layer and a single-feature overlay layer (left). Resulting features are moved apart for clarity (right).
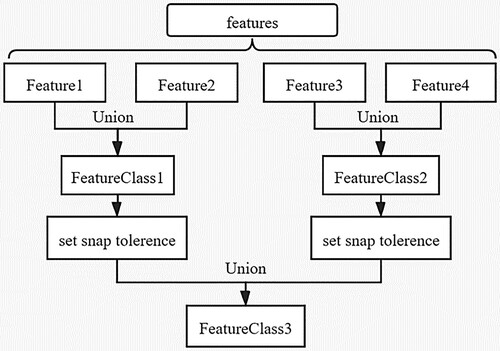
During the union operation, when the effective range of images are split, the distances between the boundaries of the images may be too close, and the coordinate retention accuracy of the PyQGIS spatial calculation may be too high. The result is that the program fails during the union operation. Unlike Arcpy, the clustering operation will capture the vertices within the tolerance of the x and y together when performing union function. In contrast, QGIS retains the original accuracy of the data, resulting in non-node intersection errors. To split the target area into non-overlapping fragments using the effective range of each image, every two images split each other. To solve this problem, the original data are combined in pairs for union operations, and the results obtained for each group are passed through the v.clean module of GRASS. A snap tolerance = 0.0001 is set to reduce the coordinate accuracy, and the results are combined into pairs again. The procedure is iterated to produce the final result.
A schematic diagram of the procedure is shown in . The procedure first combines the elements in pairs as the input and overlay layers to perform the union operation. Then, the snap tolerance of the results is set, and the vertices of the elements are snapped within a particular tolerance range. The results are combined in pairs as the input and overlay layers to perform the union operation again. This step continues until all features are broken into pieces by all of the other intersecting features. Each of the two objects in the union operation is independent of the other, and subsequent concurrent executions can speed up the efficiency of the data processing.
Figure 7. Schematic diagram of the data processing procedure in QGIS.
2.2.3 GeoPandas-based approach
GeoPandas is a third-party Python library used to process geospatial data. The library is built on the basis of Pandas and integrates Pandas’ data types. Thus, there are two data types in GeoPandas: GeoSeries and GeoDataFrame. These are the subclasses of Series and DataFrame in Pandas, which inherit most of the methods of the Pandas data structure. Geometry operations are performed by shapely. GeoPandas provides a high-level interface for manipulating geospatial data, making it possible to manipulate GIS in Python (https://geopandas.org/).
As shown in , the GeoPandas library is similar to QGIS in that the GeoPandas library relies on the GEOS library, which is recompiled from the JTS library of Java. Therefore, high precision can cause the failure of the union operation. In addition, when the overlay function of GeoPandas performs the union operation, the object must be two GeoDataFrames and cannot operate on a single input feature class. Therefore, as described in 2.2.2, the effective ranges of two images are combined as the input and overlay layers for splitting in the same manner. Before each union operation, the coordinate accuracy of the geometry attribute of the input features is reduced to ensure that there will be no non-node intersection errors due to the high coordinate accuracy. In this way, the two-by-two combination is used to iteratively obtain the final fragmentation result.
2.2.4 Framework comparison
Arcpy can directly call the ArcGIS toolbox, and ArcGIS has powerful functions, strong fault tolerance, and stability. However, ArcGIS is commercial software and the use of ArcPy is dependent on ArcGIS for Desktop software for windows system, so it is costly and difficult to deploy on the cloud platform. In addition, Arcpy relies on 32-bit Python and less memory can be addressed.
PyQGIS is the development library of QGIS, which is free, open-source software. PyQGIS is more versatile and portable than commercial software. However, the use of PyQGIS relies on the Python compilation environment that is included with the QGIS software, which does not allow for easy integration of data-service systems in the future.
GeoPandas is a Python third-party library that aims to easily process geospatial data in Python. It is relatively less dependent and easier to deploy than other libraries. In the future, it will be easier to deploy in the cloud environment, and it will better realize distributed computing based on the geospatial computing framework. This setup lays a foundation for the integration of subsequent data-service systems.
3. Experiments and results
3.1. Experimental data
Image data from the Gaofen-6 satellite, i.e. the panchromatic (PAN) and multispectral (MSO) sensors, were selected as the experimental data. First, the remote sensing images were preprocessed. The boundary range of an image is expressed by vector files, and the related metadata information is stored in an attribute table. According to the characteristics of the area size and the shape of the administrative region boundary, Beijing, Jiangsu Province, Shanxi Province, Qinghai Province, and Xinjiang Uyghur Autonomous Region were selected as the target areas of this experiment. The experimental data has 18,582 scenes of images with imaging times spanning January 1, 2020, to December 31, 2020. This study mainly uses the imaging time of images to participate in weight calculation.
Gaofen-6 is a low-orbit optical remote sensing satellite and China's first high-resolution satellite for precision agricultural observations, featuring a high resolution and wide coverage. The Gaofen-6 satellite is equipped with a 2-meter panchromatic/8-meter multi-spectral high-resolution camera (observation width of 90 kilometers) and a 16-meter multi-spectral medium-resolution wide camera (observation width of 800 kilometers). This study uses 2-meter panchromatic/8-meter multi-spectral data with a width of 90 kilometers.
3.2. Experimental environment
The experiment in this study used an Intel(R) Core (TM) i7-7700 CPU @ 3.60 GHz processor equipped with 16 GB memory. The computer setup included Windows 10 Professional operating system, PyCharm 2018.2.4, ArcGIS10.8 for Desktop (with Python 2.7), QGIS3.16 (with Python 3.7), and Geopandas0.9.0(with Python 3.7).
3.3. Comparison of retrieval results
The same experimental data were used to implement the algorithm by applying different implementation practices: Arcpy, PyQGIS, and GeoPandas. The central date was July 31, 2020. To better display the degree of overlap between adjacent images and enhance the visualization, the vector boundary of the image was used to represent the retrieval results. The three approaches based on Arcpy, PyQGIS, and GeoPandas are represented by A, B, and C, respectively, and a comparison of the retrieval results is shown in .
Figure 8. Comparison of regional retrieval results.
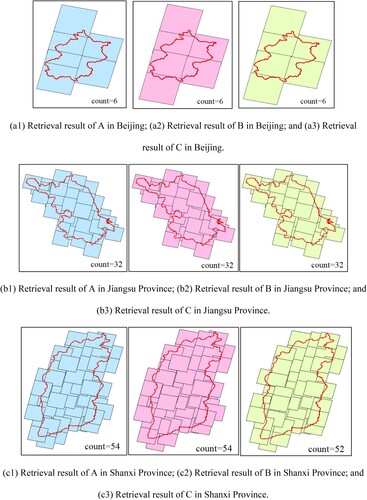
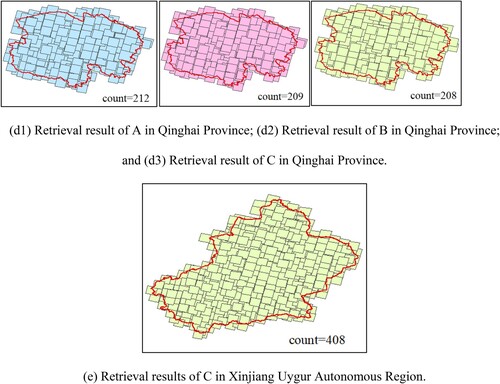
Statistics of the retrieval results are shown in . The experimental results show that the stability of the algorithm is not affected by the implementation of different approaches. Also, the retrieval results based on the Arcpy, PyQGIS, and GeoPandas function libraries are mostly consistent. The retrieval results in Shanxi Province and Qinghai Province are inconsistent because the precision-reduction methods adopted by the three approaches are slightly different, which leads to inconsistency of the generated fragment sets and different selection results. When the scale of the retrieval area was further expanded to include the Xinjiang Uygur Autonomous Region, it was found that the approaches based on Arcpy and PyQGIS were no longer applicable. During operation, the result of the spatial connection was too large, and memory overflow occurred during the reading process. However, the GeoPandas-based approach was still applicable, and the retrieval results were obtained.
Table 1. Statistics of the retrieval results.
3.4. Comparison of imaging time of retrieval results
To further compare the differences between the retrieval results, the standard deviation of the imaging time from the central time using the three approaches was calculated as . In the formula,
represents the central time,
represents the imaging time of each image, and s reflects the degree of dispersion of the imaging time relative to the central time in the retrieval results. Here, the difference between the imaging time and the center was computed in days (). As seen in the table, for Beijing and Jiangsu Provinces, the imaging times of the three approaches were nearly the same. For Shanxi and Qinghai Provinces, the imaging-time standard deviation of the GeoPandas-based approach was similar to or even better than that of the Arcpy-based approach. The imaging-time standard deviation of the PyQGIS-based approach was the largest.
Table 2. Comparison of the imaging-time standard deviations of the retrieval results.
3.5. Comparison of execution times
The time comparison statistics of the three approaches are shown in and . Arcpy directly calls the union function, which has already been parallelized to obtain the desired result. The approaches based on GeoPandas and PyQGIS must further process the results of each call to the internal union function. Therefore, when the target area is small, the Arcpy-based approach is most efficient, the GeoPandas-based approach is the second most efficient, and the PyQGIS-based approach is the least efficient. But when the scale increases, the advantages of the approaches based on GeoPandas and PyQGIS are more obvious because the approaches use 64-bit Python, whereas Arcpy uses 32-bit Python. When the image-retrieval target area was Qinghai Province, the efficiency of the Arcpy-based approach was greatly reduced. The GeoPandas-based approach had the highest computational efficiency. The Arcpy-based approach took approximately three times longer than GeoPandas, and the PyQGIS-based approach took approximately two times longer than GeoPandas. When the target area was the Xinjiang Uyghur Autonomous Region, the approaches based on Arcpy and PyQGIS experienced memory overflow and failure during the calculation process because the area was too large. The approach based on GeoPandas was still applicable and filtered out the target images in a relatively short time. The above results show that the number of image scenes in the retrieval results of the GeoPandas-based approach was minimized, the standard deviation of the imaging time of the selected images was small, the calculation efficiency of image retrieval in large areas was highest. Hence, the GeoPandas function library was simple to deploy and expand. Therefore, the approach based on GeoPandas is most suitable for retrieving remote sensing images over a large area, and it is most convenient for integrating into subsequent data-service systems.
Figure 9. Execution times of each target region and approach.
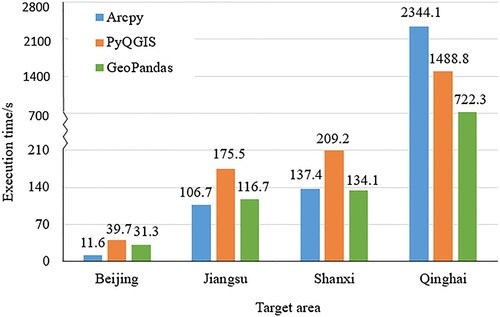
Table 3. Comparison of retrieval time consumption.
3.6. Results for parallel operation using the geopandas-based approach
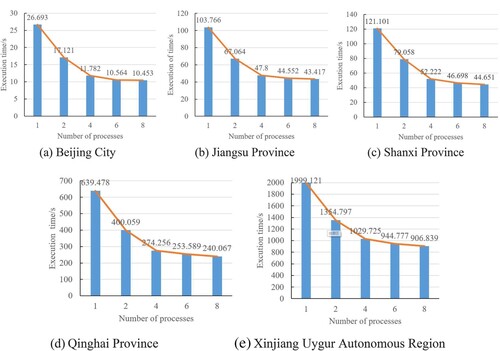
The GeoPandas-based approach was further optimized. As mentioned above, in the process of splitting each image in the target area, the union operation performed on every two objects occurred independently and could be executed concurrently. Parallel processing of the union operation helped to reduce the running time for practical applicability. The CPU of the experimental equipment comprised eight cores, so the maximum number of processes was set to eight. The number of processes was increased by multiples of two. There were four threads in each process. Union operations were performed on the candidate images of Beijing, Jiangsu, Shanxi, Qinghai, and Xinjiang as the target areas to obtain non-overlapping fragment sets. The execution time was recorded under various processes.
indicates that as the number of processes increased, the experiment execution time was greatly reduced. When there were two processes, the efficiency of the experiment was most obvious. When the number of processes was increased to four, the execution times for Beijing, Jiangsu, and Shanxi Provinces were reduced by nearly 56%, and the execution time for Qinghai Province was reduced by approximately 57%. Similarly, the execution time for Xinjiang Uygur Autonomous Region was reduced by 49%. When the number of processes increased to six and eight, the execution efficiency increased at slower rate because of the partition cost and computer performance limitations.
Figure 10. Execution time changes as the number of processes increased during the union operation in five regions.
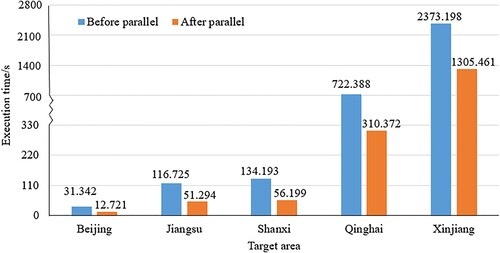
Based on the above analysis, when the number of processes is four, the execution efficiency improves the fastest. Thus, four processes were executed in parallel for the union operation based on the GeoPandas approach. For each region, the execution times for data filtering were compared before and after the union parallel operation. According to , the effect of parallel computing is significant. For Beijing City, Jiangsu Province, Shanxi Province, and Qinghai Province, the running time was cut by more than half. For large areas like Xinjiang Uygur Autonomous Region, the execution time was reduced by approximately 45% because spatial connections and iteration loops require a longer run time.
Figure 11. Comparison of execution times during data retrieval before and after union parallelization.
3.7. Method comparison
Li et al. (Citation2017) used grid division to filter the data. For comparison, the selection rules of the grid division method were kept consistent with the method proposed in this paper. The method based on grid division is as follows: first, obtain the smallest bounding rectangle of the target area, and then divide the rectangular box with a specific step size to obtain the same size grid. Then, determine whether these grids intersect with the target area—only the grids that intersect the target area are reserved. The number of grids contained in each image is used as the weight to select images. In this experiment, the target area was divided by grids in steps of 0.01 degrees, and the result of the division is as follows ().
Figure 12 . The target area divided into grids.
To compare the two methods, the image selection conditions were simplified. The goal of retrieving as few images as possible to cover the target area was the only consideration, the other image attributes were assumed to be consistent. Therefore, in the method proposed in this paper, the number of fragments contained in the image was used as the weight. With Jiangsu Province as the target area, the same experimental data were filtered by two methods. There are 35 images as the result of grid division method and 30 images as the result of the improved coverage-oriented retrieval method ().
Figure 13 . Results of the grid division method (left). Results of the improved coverage-oriented retrieval method (right).
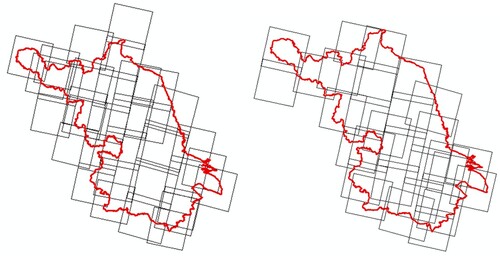
The grid cannot completely fit the target region on the boundary. Therefore, when the target region is replaced by the grid, the target region becomes larger and redundant images will be selected to cover part of the grid outside the target region. To reduce data redundancy, the divided grid can be made smaller, but this also increases the computations. When retrieving large-area data, the computations will increase exponentially.
4. Discussion
The improved coverage-oriented retrieval algorithm improves the efficiency and accuracy of data retrieval. Traditionally, data retrieval searches for images that intersect a target area by initially setting the sensor type, time requirements, and the highest cloud-cover threshold. Then, the retrieval results are manually selected. This method is time-consuming and labor-intensive. For example, the selection of data for a province may take several hours. Further, the accuracy cannot be guaranteed, the number of selection result is not necessarily minimized, and there may be gaps between the images that cannot be recognized by human eye, resulting in missing data. In many studies, grids were used to segment the target area, and then the images were selected by the weights of the images covering each grid. If the grid is set too large, there is a large difference between the boundary of the area covered by the grid and the boundary of the target area such that data retrieved cannot completely cover the target area; if the grid setting is too small, the calculation increases exponentially as the level rises, thus the retrieval efficiency decreases. In the improved coverage-oriented retrieval algorithm, the target area is split into fragments of different sizes by mutual splitting the sections in the target area of images. This algorithm avoids the difficulty in determining the grid size when dividing the target area with a grid. In addition, the improved algorithm improves the accuracy of retrieval which achieves a more refined spatial calculation. The grid division cannot fit the target area completely, no matter how small the grid division is, there will be difference and may produce multiple selections.
The GeoPandas-based approach is most advantageous in retrieving remote sensing images over a large area. To compare the execution efficiencies of the algorithm under the three function libraries of Arcpy, PyQGIS, and GeoPandas, this study uses Beijing City, Jiangsu Province, Shanxi Province, Qinghai Province, and Xinjiang Uygur Autonomous Region as target regions. Judging from the number of images in the retrieval results, the GeoPandas-based approach is superior to the other two approaches. GeoPandas is most advantageous in terms of efficiency as the target area expands. For example, when the images were retrieved for the Xinjiang Uygur Autonomous Region, the other two approaches caused memory overflow and program failure. In terms of the imaging-time standard deviation, the GeoPandas-based approach performed better than Arcpy, while PyQGIS performed the worst (i.e. it had the largest imaging-time standard deviation). In terms of feasibility, the GeoPandas-based approach relies on open-source libraries, runs on various system platforms, easily interfaces with cloud platforms, and deploys with low difficulty.
As the number of satellites increases, the revisit cycle becomes shorter. Thus, research on large-area and global changes is becoming more extensive, and the demand for regional time series data is becoming more urgent. The improved coverage-oriented retrieval algorithm adopted in this study comprehensively considers the number of fragments contained in each remote sensing image and the imaging time to filter the images. The method can quickly filter out an optimal image combination with a small number of images near the time of interest, maximizing user satisfaction. To visualize the influence of imaging time on image selection, this paper chose imaging time as the image quality evaluation parameter. Users can freely set the importance of imaging time, cloud cover and other attributes in the image quality evaluation according to their own needs. Thus, a customized weight model is built to select images.
However, the algorithm still has limitations. Only imaging time is considered in this paper. Cloud cover is also an important parameter to evaluate image quality and it should be added to the weight calculation. Furthermore, the location of clouds within images should also be taken into account, as there may be cases where clouds accumulate in parts of the image covering the target area. In this paper, we used an area incremental approach and selected five regions for experimentation. For larger areas there may be memory overflow in GeoPandas-based approach as well, the experiments need to be run on a cluster or executed in chunks.
5. Conclusions
An improved coverage-oriented retrieval algorithm for large-area remote sensing data is proposed in this paper to address the issue of efficiency. Three approaches based on Arcpy, PyQGIS, and GeoPandas were adopted. The proposed algorithm can efficiently and automatically select target-area data to ensure that the retrieval results are nearest the target time using the fewest number of images. Subsequent image mosaic task is reduced, and services for various remote sensing applications can be better provided. When images are retrieved for a large-scale area, manual selection is likely to cause omission of data or multiple selections. The proposed algorithm uses an iterative loop in which each step selects the image with the nearest imaging time and the largest contribution to the uncovered target area. The cycle ends when the target area is completely covered, avoiding the problem of missed and redundant selections. In this study, the effectiveness of the algorithm is verified through experiments, which can replace manual data selection and greatly improve the retrieval efficiency and accuracy. By comparing three approaches based on Arcpy, PyQGIS, and GeoPandas, it is concluded that the approach based on GeoPandas is most suitable for data retrieval of large-scale areas.
The algorithm still has room for improvement. Large-area data can be processed in blocks, the target area can be divided into several small partitions, and the optimal image combination of the coverage area can be obtained for each partition. Then, all of the results can be merged and deduplicated. The technique of ‘divide and conquer’ speeds up the retrieval efficiency. In addition, users are free to set the weight of each attribute of the image according to the priority of the image condition that they pay attention to, so as to maximize the user's needs.
Data availability statement
Data sharing not applicable.
Disclosure statement
No potential conflict of interest was reported by the author(s).
References
- Aerospace Information Research Institute, Chinese Academy of Sciences. Aerospace Institute Remote Sensing Data Service System [EB/OL]. http://eds.ceode.ac.cn/ (accessed on 17 September 2021).
- ArcGIS for Desktop. https://desktop.arcgis.com/en/arcmap/ latest/tools/analysis-toolbox/how-union-analysis-works.htm (accessed on 17 September 2021).
- Bi, D. 2008. Researching Image Retrieval Methods Based on Shape and Space Relationship[D]. Nanchang Hangkong University.
- Bretschneider, T., R. Cavet, and O. Kao. 2002. “Retrieval of Remotely Sensed Imagery Using Spectral Information Content.” IEEE International Geoscience and Remote Sensing Symposium 4: 2253–2255.
- Chaudhuri, B., B. Demir, L. Bruzzone, and S. Chaudhuri. 2016. “Region-Based Retrieval of Remote Sensing Images Using an Unsupervised Graph-Theoretic Approach.” IEEE Geoscience and Remote Sensing Letters 13 (7): 987–991.
- Chen, Y. 2006. Design and Implementation of Remote Sensing Image Database Retrieval and Publishing System Based on J2EE[D]. Capital Normal University.
- Chen, F., N. Wang, B. Yu, Y. Qin, and L. Wang. 2021. “A Strategy of Parallel Seed-Based Image Segmentation Algorithms for Handling Massive Image Tiles Over the Spark Platform.” Remote Sensing 13: 1969. doi:10.3390/rs13101969.
- China Resource Satellite Application Center. China Resource Satellite Application Center [EB/OL]. http://www.cresda.com/CN/ (accessed on 17 September 2021).
- Computer Network Information Center of Chinese Academy of Sciences. Geospatial Data Cloud [EB/OL]. http://www.gscloud.cn/ (accessed on 17 September 2021).
- Egenhofer, M. 1996. Spatial-Query-by-Sketch[C]// Proceedings of the IEEE Symposium on Visual Languages, IEEE Computer Society 60267.
- GeoPandas. https://geopandas.org/ (accessed on 17 September 2021).
- Gong, X. 2011. Study on Quick Retrieval Technology of Multisource Remote Sensing Resources Based on Grid[D]. Harbin Institute of Technology.
- Gu, H., and Y. Wei. 2021. “Environmental Monitoring and Landscape Design of Green City Based on Remote Sensing Image and Improved Neural Network.” Environmental Technology & Innovation 23: 101718.
- He, F. 2017. Research on Massive Remote Sensing Data Retrieval Technology Based on Spatial Grid Filtering[D]. Henan University.
- He, F., X. Huang, J. Ma, D. Wang, and H. Jiang. 2017. “Single Time Phase and Full Coverage Retrieval Method of Remote Sensing Data Based on Space Secondary Filter[J].” Journal of Henan University (Natural Science Edition 47 (3): 287–292.
- He, G., L. Wang, Y. Ma, Z. Zhang, G. Wang, Y. Peng, T. Long, and X. Zhang. 2015. “Opening and Sharing of Big Earth Observation Data: Challenges and Countermeasures[J].” Science Bulletin 60 (Z1): 470–478.
- Kempeneers, P., and P. Soille. 2017. “Optimizing Sentinel-2 Image Selection in a Big Data Context.” Big Earth Data 1: 145–158. 145-158, doi:10.1080/20964471.2017.1407489
- Lee, Y., and F. Chin. 1995. “An Iconic Query Language for Topological Relationships in GIS.” International Journal of Geographical Information Systems 9 (1): 25–46.
- Li, F., K. Fu, H. You, Y. Wu, and B. Liu. 2006. “An Efficient Spatial Visualization Retrieval Algorithm for Massive Remote Sensing Raster Databases[J].” Journal of Electronics and Information Technology 8: 1463–1467.
- Li, A., P. Huang, L. Shi, G. He, X. Feng, Y. Wu, Q. Zhang, et al. 2021. “Update of Remote Sensing Satellite Ground System of China Remote Sensing Satellite Ground Station[J].” Journal of Remote Sensing 25 (1): 251–266.
- Li, F., S. You, H. Wei, E. Wei, and L. Chen. 2017. “An Optimal Dataset Screening Model for Remote Sensing Imagery Regional Coverage[J].” Journal of Radio Engineering 47 (10): 45–48.
- Liu, W., and H. Gu. 2013. “Geo-information Spatial Relationships Retrieval Based on Semantic[J].” Science of Surveying and Mapping 38 (05): 16–18. 27.
- Lossou, E., N. Owusu-Prempeh, and G. Agyemang. 2019. “Monitoring Land Cover Changes in the Tropical High Forests Using Multi-Temporal Remote Sensing and Spatial Analysis Techniques.” Remote Sensing Applications: Society and Environment 16: 100264.
- Ma, Y., H. Wu, L. Wang, et al. 2015. “Remote Sensing big Data Computing: Challenges and Opportunities.” Future Generation Computer Systems 51: 47–60.
- Miao, L., X. Li, L. Zhou, Q. Wen, Z. Ji, Z. Xiong, G. Jin, and L. Hu. 2010. “Fast Approach for Querying Coverage of Multi-Source RS Data and Its Realization Based on ENVI/IDL[J].” Remote Sensing Technology and Application 25 (4): 502–509.
- NASA.Level-1 and Atmosphere Archive and Distribution System Distributed Archive Center (LAADS DAAC) [EB/OL]. https://ladsweb.modaps.eosdis.nasa.gov/ (accessed on 17 September 2021).
- Nemni, E., J. Bullock, S. Belabbes, and L. Bromley. 2020. “Fully Convolutional Neural Network for Rapid Flood Segmentation in Synthetic Aperture Radar Imagery.” Remote Sensing 12: 2532. doi:10.3390/rs12162532.
- QGIS Documentation. https://docs.qgis.org/3.16/en/docs/user_manual/ processing_algs/qgis/vectoroverlay.html#union (accessed on 17 September 2021).
- Ramsey, Paul. https://blog.crunchydata.com/blog/waiting-for-postgis-3.1-geos-3.9 (accessed on 17 September 2021).
- Shi, S., Y. Zhong, J. Zhao, P. Lv, Y. Liu, and L. Zhang. 2022. “Land-Use/Land-Cover Change Detection Based on Class-Prior Object-Oriented Conditional Random Field Framework for High Spatial Resolution Remote Sensing Imagery.” IEEE Transactions on Geoscience and Remote Sensing: 1–16.
- University of Maryland. Global Land Cover Facility [EB/OL]. http://landcover.org/ (accessed on 17 September 2021).
- USGS. Earth Resource Observation and Science Center (EROS)[EB/OL]. http://glovis.usgs.gov/ (accessed on 17 September 2021).
- Xiao, J., M. Wu, S. Zhou, and Z. Niu. 2020. “Remote Sensing Monitoring of Ecological and Economic Impacts of Major Railway Construction in the Benguela Railway [J].” Science Technology and Engineering 20 (11): 4605–4613.
- Xue, T., M. Diao, J. Li, and S. Zou. 2013. “Approach to Storing, Retrieval and Accessing Mass Spatial Data in Resources and Environment Remote Sensing[J].” Remote Sensing for Land and Resources 25 (02): 168–173.
- Yang, X., and J. Yan. 2019. “Research on Optimal Region Covering Algorithm for ZY-3 Satellite Image[J].” Geographic Information of Surveying and Mapping 44 (6): 71–74.
- Yao, F., J. Li, Y. Chen, et al. 2019. “Task Allocation Strategies for Cooperative Task Planning of Multi-Autonomous Satellite Constellation.” Advances in Space Research 63 (2): 1073–1084.
- Yuan, F. 2013. A New Strategy of Storage & Retrieval for Massive Tile Data of Remote Sensing Images [D]. University of Electronic Science and Technology of China.
- Zhang, S. 2011. Research on Multi-Object Retrieval of Remotely Sensed Images Based on Spatial Relationship[D]. Huazhong University of Science and Technology.
- Zhongke Remote Sensing Technology Group Co., Ltd. Remote Sensing Market [EB/OL]. http://www.rscloudmart.com/ (accessed on 17 September 2021).
- Zhu, X., R. Guo, T. Liu, and K. Xu. 2021a. “Crop Yield Prediction Based on Agrometeorological Indexes and Remote Sensing Data.” Remote Sensing 13: 2016. doi:10.3390/rs13102016.
- Zhu, L., X. Su, Y. Hu, X. Tai, and K. Fu. 2021b. “A Spatio-Temporal Local Association Query Algorithm for Multi-Source Remote Sensing Big Data.” Remote Sensing 13: 2333. doi:10.3390/rs13122333.