
 ?Mathematical formulae have been encoded as MathML and are displayed in this HTML version using MathJax in order to improve their display. Uncheck the box to turn MathJax off. This feature requires Javascript. Click on a formula to zoom.
ABSTRACT
As a World Cultural Heritage site with sacred landscape featuring an exceptional range of Buddhist art and architecture, much attention has been focused on the sustainable development of Bagan (Myanmar). Particularly, the monitoring of landscape surface subsidence and monument instability is of great importance to the protection and development planning of the Bagan heritage site. In this study, we applied high resolution TerraSAR-X imagery acquired from 2019 to 2020 for deformation monitoring based on the small baseline subset (SBAS) and persistent scatterer synthetic aperture radar interferometry (PSInSAR) approaches. We identified several hotspots and pagodas with displacement anomalies linked to land cover change and previous earthquakes. The cross comparison between SBAS and PSInSAR and the precision of height estimates derived by PSInSAR indicated a millimetric precision of the derived deformation products. The combination of the two multi-temporal SAR interferometry approaches satisfies the two-scale monitoring requirements from landscapes to monuments, particularly for large-scale World Heritage sites. The non-contact monitoring method has potential when traditional methods using field accessibility and surveillance are constrained.
1. Introduction
World cultural heritage sites have invaluable significance in history and cultural inheritance. Although such irreplaceable resources are the common wealth of humanity, their sustainability is facing challenges, primarily due to natural disasters and exacerbated anthropogenic disturbances (Lombardo, Tanyas, and Nicu Citation2020; Sesana et al. Citation2021). Traditionally, monument vulnerabilities and/or changes in surface elements for a cultural heritage site are surveyed via manual inspection, which is proven to be a flexible approach. However, apart from being labor intensive and time consuming, this technique often results in missed detection (Themistocleous, Danezis, and Gikas Citation2021). In contrast, remote sensing is a state-of-the-art non-invasive observation tool that is capable of acquiring dynamical surface elements at a large-scale using multi-spectral and multi-frequency electromagnetic waves (Tapete and Cigna Citation2017). The potential of remote sensing in cultural heritage has recently been highlighted due to its capabilities in near real-time monitoring and assessments using quantitative indicators (Moise et al. Citation2021). Furthermore, the application of radar technology for the deformation monitoring of landscape surface and architectural monuments is an additional focal point, based on both ground-based techniques (Tapete et al. Citation2013) and spaceborne synthetic aperture radar interferometry (InSAR) (Reale et al. Citation2019; Zhou, Chen, and Guo Citation2015). Chen et al. (Citation2017) provided new insights into the dynamics of the relationship between land subsidence caused by the groundwater extraction and monument stability of Angkor World Heritage site. A collaborative research project denoted as PROTHEGO was funded to use radar interferometry in monitoring surface deformation, aiming at analyzing the impact of geo-hazards in cultural heritage sites in Europe (Themistocleous et al. Citation2016).
The advantages of optical and SAR techniques for cultural applications are distinct but complementary. More specifically, the former is useful in the change detection of landscape environments, while the latter technique is preferred for the detection of subtle deformations (not visible but detectable) in cultural landscapes as well as overlaid monuments (Chen et al. Citation2017). Agapiou (Citation2021) demonstrated the recent developments of both optical and SAR techniques to be beneficial for monitoring UNESCO World Heritage properties. Chen et al. (Citation2019) used optical satellite images in urbanization analysis of Siem Reap City, which contributed to key studies on ground subsidence determined via the InSAR technique for the Angkor World Heritage site.
Bagan, Myanmar was inscribed into the UNESCO World Cultural Heritage list in 2019 due to its sacred landscape, with an exceptional range of Buddhist art and architecture corresponding to the peak of Bagan civilization (11–13th centuries AD), as documented by UNESCOFootnote1. Therefore, for the sustainable development of Bagan, the first step is to clarify the threat factors faced by the heritage site including natural disasters (e.g. floods and earthquakes) and anthropogenic activities (e.g. tourism industry). The influences and current status should then be monitored and evaluated. The next step is to formulate preventive conservation measures and development plans in order to protect the significant outstanding universal values (OUV) of Bagan. The fundamental goal of cultural heritages’ sustainable development is the inheritance of their culture and civilization. At present, Myanmar’s measures to protect cultural heritage typically include strengthening law making, improving the legal system for cultural heritage protection, developing the cultural industry, enhancing international exchanges and cooperation, etc. The key limitations lie in the insufficient protection of cultural heritages, including secondary damage, and lack of innovation, funding and technologies (Zhang Citation2019). Edwards, Frasch, and Jeyacheya (Citation2019) use satellite remote sensing images to evaluate the effectiveness of land-use zoning for the protection of built heritage in the Bagan Archaeological Zone. However, the preventive monitoring of the cultural landscape and architecture (pagodas) are lacking.
In this study, we employed high resolution (HR) spotlight TerraSAR-X data acquired during 2019–2020 for the monitoring of landscape surface subsidence and monument instability based on multitemporal InSAR (MTInSAR) approaches (Lanari et al. Citation2004; Ma and Lin Citation2016). The derived InSAR products (e.g. annual deformation rates and motion time series) identified hotspots across the cultural landscape with a coverage of approximately 100 km2. We then interpreted the high-priority deformation anomalies via remote sensing-based land use and land cover change (LULCC) maps and photographs of the field. The results demonstrate the ability of remote sensing approaches for the deformation monitoring of large-scale World Heritage sites in both the entire site scale and the monument scale, especially when traditional methods (i.e. field accessibility and surveillance) are constrained.
2. Materials and methods
2.1. Study site and data
As the second inscribed World Heritage site of Myanmar, Bagan is well-known for housing the largest pagoda complex (more than 2,200 pagodas remain in the Bagan area) in the world. These pagodas, including Shwezigon, Dhammayazaka, Gawdawpalin, Thatbyinnyu, Ananda, Dhammayangyi, Sulamani, Shwesandaw, Mee Nyein Gone Phaya, Pyathetgyi, Thitsarwadi, Lawka Nandar, Pyatsa Shwegu and Manuha Paya (No.1-14 in (a), respectively), date back to the 11th-13th centuries and exhibit diverse styles and extremely beauty value ((b)). In 1044 AD, Anulutuo, the leader of the Burmese nationality, established the first unified feudal dynasty in the history of Myanmar. He selected Bagan as the capital and implemented new reforms, namely, the establishment of Buddhism as a state religion by inheriting the Mon culture. This proved to be beneficial for the formation and development of the Bagan culture. During the Bagan Period (11th – 13th centuries), the Bagan civilization gained control of the Irrawaddy River transport, extending its influence over a large area. The traditions of Buddhist worship and merit-making resulted in a rapid construction of pagodas (which peaked in the thirteenth century), producing an exceptional array of Buddhist art and architecture, including pagodas, inscriptions, murals and sculptures as documented by the UNESCOi.
Figure 1. Study site of Bagan World Heritage site. (a) Spatial coverage of the site overlapped on satellite imagery from Google Earth, No.1-14 highlight the locations of typical pagodas and the pink rectangle in the right-bottom sub-image marks the geo-location of Bagan; (b) Pagoda complex (the tallest pagoda in the distance is Dhammayangyi) and the cultural landscape; (c) Epicentre distribution map of earthquakes (magnitude larger than 4.5) in recent 60 years.
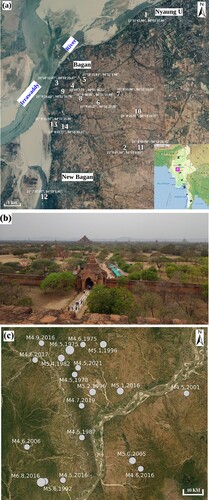
Bagan is a geographical district (lat. 21.17°N and lon. 94.87°E) that is part of Nyaung U Town, Minqiang County, Madeler Province. Located in central Myanmar and on the East Bank of the Irrawaddy River. Bagan is approximately 6.4 km away from Nyaung U Town ((a)). A semi-desertified climate is prevalent, with three typical seasons: cool-dry season from October to February; dry-hot season from March to May; and rainy season from June to September as recorded in the Bagan Weather and Climate websiteFootnote2.
(c) is the epicentre distribution map of earthquakes (magnitude larger than 4.5) in recent 60 years. It shows that Bagan is located in an earthquake prone area. Mon et al. (Citation2020) identified two fault zones in the central Myanmar where Bagan is located. Thus, the monitoring of the impact of earthquakes on Bagan is the core issue of concern for stakeholders.
Bagan is also a historical symbol and spectacular testimony to the peak of Bagan civilization. As a complex cultural landscape incorporating living communities and contemporary urban areas, at present, the sustainable conservation of the entire heritage site is considered as a priority.
In order to highlight the feasibility of remote sensing in the monitoring of the heritage site, high resolution spaceborne optical and SAR remote sensing images collected during 2018–2020 were utilized for the dynamical analysis of the landscape environment as well as the subtle deformation monitoring.
For the LULCC, two Level-1A Gaofen-1 satellite scenes with the WFV (wide field of view) mode were acquired on 30 December 2018 and 19 May 2019, respectively, to test the performance of this Chinese satellite in land cover monitoring. The multispectral images include four bands (blue, green, red and near infrared), with a spatial resolution of 16 m. Data pre-processing (radiometric correction, geometric correction and registration based on Rational Polynomial Coefficients) was completed using ENVI v5.4 (Exelis Visual Information Solutions, Boulder, Colorado) for the two scenes. The images were subsequently applied for land cover mapping and change detection.
We acquired 31 scenes of HR spotlight TerraSAR-X images (HH-polarization in ascending orbits) from 11 January 2019 to 1 November 2020 () for deformation monitoring. The spatial resolution of the images on the ground and in the azimuth direction were 1.97 and 1.60 m, respectively, with a central incidence angle of approximately 36.6°. The 1-arcsec Shuttle Radar Topography Mission (SRTM) digital elevation model (DEM) was used as the reference topography for the topographic phase removal of interferograms as well as the geocoding of InSAR products.
Table 1. Details of the HR spotlight TerraSAR-X data used in the study. The data acquired on 15 Nov. 2019 (marked by *) was selected as the reference imagery for the image co-registration.
2.2 Data processing and methodology
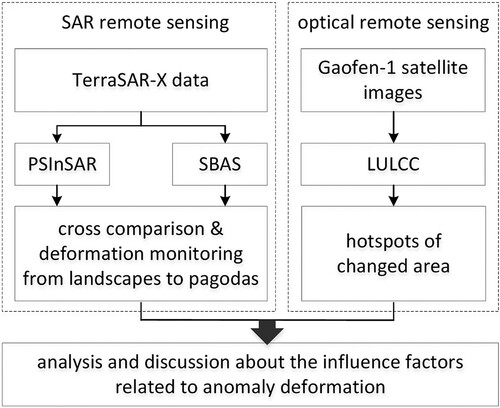
shows the technical flow chart of data processing in this study. LULCC can be employed to interpret the causes of land subsidence across a landscape. In the current study, we adopted two remote sensing data processing approaches for the estimation of deformation and the mapping of LULCC. The subtle interactions between these two factors were further investigated, providing new insights for the challenges faced by the sustainable development of the target site, particularly following the impacts of the growing tourism industry.
Figure 2. Technical flow chart of data processing.
2.2.1. MTInSAR approaches: rational and data processing
Two MTInSAR approaches, namely, small baseline subsets (SBAS) (Berardino et al. Citation2002) and persistent scatterer (PS) InSAR (PSInSAR) (Ferretti et al.Citation2001; Ma and Lin Citation2016), were applied for the deformation estimations by processing HR Spotlight SAR images acquired in ascending orbits. SBAS focuses on the detection and analysis of coherent targets (CT) and is highly effective in sub-urban landscapes, yet it is generally limited by its spatial resolution. In contrast, PSInSAR can determine the precise location of targets by analyzing phases on persistent scatterers (e.g. artificial features and exposed rocks) and is consequently more adaptable for the urban environment.
InSAR data processing was divided into the following two sub-procedures that were implemented using self-developed software tools based on the open-source InSAR platform GMTSAR (https://topex.ucsd.edu/gmtsar/). (i) Differential interferograms were generated following image co-registration, interferogram generation, flattening, topographic phase simulation and differential interferometry. Solutions of multi-master and single-master formations were applied for the interferogram generation of SBAS and PSInSAR, respectively. (ii) Deformations were estimated using the aforementioned MTInSAR approaches. In particular, unknown parameters were calculated using singular value decomposition (SVD) (Berardino et al. Citation2002) for SBAS and the generalized likelihood ratio test (GLRT) (De Maio, Fornaro, and Pauciullo Citation2009) for PSInSAR. Note that, interferogram filtering and phase unwrapping are essential for the SBAS approach in order to guarantee a robust and precise estimation.
details the data processing approaches and corresponding parameters used to derive the deformation velocities and the motion time series on the observed CT and/or PS points. In this study, a linear deformation model was applied for the unknown parameter calculation of PSInSAR. Consequently, the temporal coherence of 0.7 was utilized to assure the quality of PS points. In contrast, the threshold of temporal coherence for the SBAS deformation inversion was relaxed in order to enhance the spatial density of measurements on natural landscapes. In general, the temporal variation of deformations tends to be significant (resulting into a reduced temporal coherence) for SBAS due to the residual of atmospheric phase artifacts compared with PSInSAR. Interferograms were generated using the multi-master and single-master graphs for SBAS and PSInSAR, respectively, as shown in .
Figure 3. Interferogram formation for the MTInSAR approaches. SBAS (left) and PSInSAR (right). The acquisition of 15 Nov. 2019 (marked by the red cross) was selected as the master imagery to minimize the spatiotemporal decorrelation.
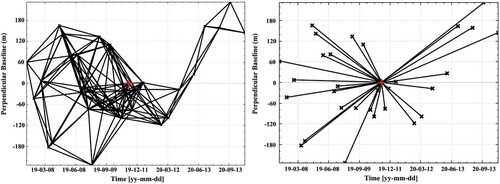
Table 2. Parameters and thresholds applied for the SBAS and PSInSAR data processing.
The integration of the two MTInSAR approaches allows us to take advantage of the complementary deformation measurements from both sets of results in a spatial enhanced deformation field. This can facilitate the interpretation of deformation anomalies and the exploitation of relevant driving forces. Moreover, the cross comparison of the two deformation measurements can act as a approach to demonstrate the precision of MTInSAR estimations, particularly if ground-based measurements (i.e. precise leveling) are unavailable.
2.2.2. Land cover mapping and change detection
We performed change vector analysis (CVA) (Lambin and Strahlers Citation1994) on the Gaofen-1 images to detect areas that have undergone change. All four multispectral bands were used to calculate the pixel-wise difference between the co-registered images. Pixels were determined to have changed (or remained unchanged) based on a threshold derived via the Otsu thresholding algorithm (Otsu Citation1979). The land cover maps were subsequently produced using the random forest classification method (Breiman Citation2001). For the unchanged areas, the classification was performed once on the stacked multispectral bands of two images, while for the changed areas, the classification was performed separately on the bi-temporal images. The following five land cover classes were defined: water; built-up; farmland; vegetation; and floodplain. The training samples were manually interpreted, using Google Earth images as a reference. By applying a 5-fold cross-validation strategy, we were able to select the optimal classification parameters (number of trees in a forest, split quality criterion function, etc.). The final LULCC result was smoothed using a 3 × 3 spatial filter to reduce the salt-and-pepper noise.
3. Results and interpretation
3.1. Land surface deformation
3.1.1 SBAS
(a) presents the SBAS-based deformation field within the coverage of the HR Spotlight TSX acquisitions. There are 401,451 CT measurements on the landscape of the Bagan World Heritage site (approximately 4,000 ). The spatial density of the measurements differs from urban areas, villages, roads to other natural land types. By selecting the northeast corner of the Bagan Archaeological Museum as the reference point (pink cross in ), the deformation rates are generally determined to range within -10 mm/yr to +5 mm/yr in the direction of line of sight (LOS) (the same below), with a measurement precision within 4.58 mm/yr (see Section 3.1.3). Assuming measurements with absolute values greater than 5 mm/yr as significant, the SBAS results indicate the majority of the ground surface surrounding the cultural landscape to be subsiding (green-yellow-red areas with values ranging from −5 mm/yr to −10 mm/yr in ), with the presence of several stable subzones (light blue-blue regions in ) that are sporadically distributed (white ellipses in ). Moreover, we also identified two sub-areas (pink ellipses in ) with moderate-notable subsidence values compared to their surroundings.
Figure 4. Deformation velocity (LOS) maps covering the cultural landscape of the Bagan site; ‘1’ and ‘2’ mark the presentative stable and subsidence subareas, respectively, and the pink cross marks the location of the applied reference point. (a) SBAS and (b) PSInSAR. Subsiding and stable regions are marked by pink and white ellipses, respectively.
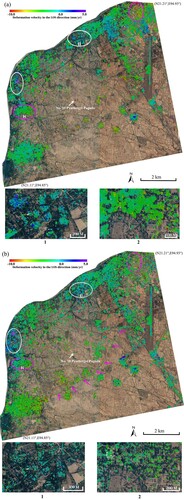
The spatial distribution of CTs on the landscape indicates that coherent targets are prevalent in the settlement areas, including downtown of Bagan, New Bagan and Nyaung U (), amongst other villages. In addition, we were able to detect deformation surrounding pagodas with significant cultural value and architecture scales, particularly those highlighted in . However, none of the measured CTs were associated with the No. 10 Pyathetgyi Pagoda, located in the hinterland overlaid with sandy soil. These measurements can be filtered using the temporal coherence threshold, which was set to 0.3. Phase unwrapping errors for interferograms are typically observed in isolated and challenging landscapes similar to that of the study area (Zhang, Heresh, and Falk Citation2019), inducing a low temporal coherence due to the amplified temporal phase variations.
3.1.2 PSInSAR
Compared with medium resolution data, the PS density (artificial features discriminable in the SAR imagery) on the HR SAR images exhibits a marked increase (Tosi et al. Citation2018; Zhao et al. Citation2018), up to one order of magnitude (Schunert and Soergel Citation2012). For example, 433,949 PS points are detected in the full-resolution TSX images, equivalent to approximately 4,300 , which exceeds that of SBAS following the implementation of the 5×5 multilooking algorithm. The PS measurements are generally located on urban and village buildings, as well as ancient pagodas. Unlike the SBAS, the PSInSAR approach is able to detect smaller pagoda structures (e.g. 2×2 m foundations), as it considers the full resolution of the HR SAR images.
The processing of the full-resolution data and the avoidance of phase aliasing from neighboring features allows for the comprehensive comparison of the PS point positions and the deformation measurements with the CTs. The PSInSAR-derived deformation rate ((b)) also indicates the landscape surface to exhibit a mild subsiding trend (deformation rates ranging from −5 mm/yr to −10 mm/yr), with the exception of two stable sub-areas (overlapping regions in SBAS; white ellipses in ) with values ranging from +0 mm/yr to +5 mm/yr. Based on the two-tier networking strategy (Ma and Lin Citation2016), a relatively even-spatially distributed deformation field was obtained. The measurement gap on the No.10 Pyathetgyi Pagoda was fixed in the PSInSAR result. Moreover, the PSInSAR results reveal a deformation trend along the road connecting New Bagan with Nyaung U (pink arrows in (b)). Thus, this method is able to provide information for the entire site. As with SBAS, two moderate-notable subsidence sub-areas were also identified in the PSInSAR results (pink ellipses in (b)).
3.1.3 Cross comparison
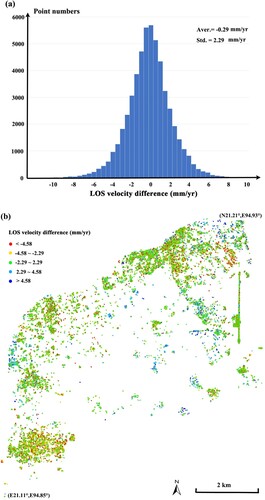
SBAS and PSInSAR were cross compared in order to demonstrate the robustness and precision of the calculated deformations. reveals a consistent surface deformation trend across the cultural landscape of the Bagan site, including two typical stable and subsiding sub-areas (white and pink ellipses, respectively). Apart from the measurement gap, the zoom-in subsets of ‘1’ and ‘2’ in reveal that a similar amount of point measurements was derived via SBAS compared to PSInSAR. Moreover, the deformation measurements of SBAS are generally smoother than those of PSInSAR due to the applied spatial-averaging. The CTs and PSs that exhibited spatial overlapping (within a 10 m distance; 53,559 points) were selected for the subsequent quantitative analysis (). (a) plots the histogram of the difference between two annual velocity measurements, indicating a Gaussian normal distribution with the differential average and standard deviation values of −0.29 and 2.29 mm/yr, respectively. The statistical measurement precision value of the two MTInSAR approaches was derived as 4.58 mm/yr (double of the standard deviation) with the confidence value exceeding 95%. (b) depicts the spatial distribution of the differential values, and significant differences (smaller than −4.58 mm/yr or larger than 4.58 mm/yr as highlighted by the red and blue points, respectively) between SBAS and PSInSAR measurements.
Figure 5. Quantitative cross comparison of SBAS and PSInSAR results. (a) Histogram of the differential annual velocity values between SBAS and PSInSAR, indicating a consistent measurement with the average and standard deviation values of −0.29 and 2.29 mm/yr, respectively. (b) Spatial distribution of the aforementioned differential values.
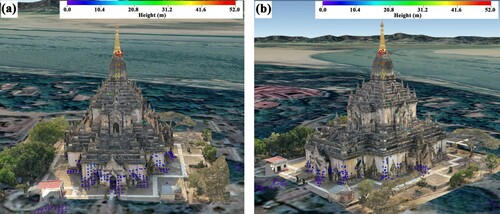
In addition, since PSs are characterized by a low phase dispersion of the residues in PSInSAR, the precision of derived deformation velocity can be verified at the millimetric level by the threshold of 0.7 for temporal coherence (also known as ensemble phase coherence) (Colesanti et al. Citation2003). Moreover, the precision of height estimates can, to some extent, demonstrate the precision of deformation estimates due to their relationship with unknown parameters of MTInSAR models (Ferretti, Prati, and Rocca Citation2000). The residual elevation errors are calculated simultaneously with the estimation of the deformation parameters. The absolute heights can then be calculated by combining the residual elevation errors with the DEM used in MTInSAR. In this study, the 3D models (with a centimeter modeling accuracy) of four pagodas (GawDawPalin, Sulamani, Dhammayangyi, SeinNvetAma) were generated using nap-of-the-object photogrammetry. shows that the PS points are in good agreement with the 3D model of Gawdawpalin. The peak height estimated by PSInSAR on the Gawdawpalin Pagoda is 51.6 m, which is consistent with the true value of 55 m. The sharp pinnacle of the architecture results is an underestimation of the pagoda height (3.4 m lower) due to the lack of PS measurements on the upper apex.
Figure 6. 3D view of the PS points (colored by their height value) superimposed on the 3D model of Gawdawpalin.
3.1.4 Interpretations
The cause of deformations was further exploited by synergistically analyzing multisource information from the LULCC data and field photographs related to riparian erosion and groundwater pumping.
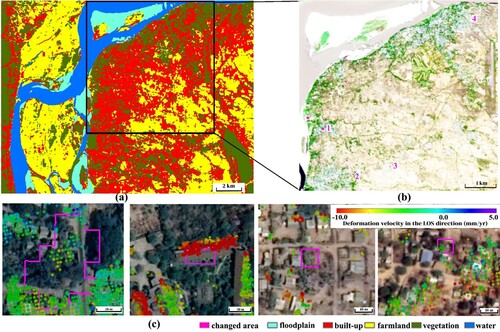
Land cover change maps were generated via unsupervised CVA. The land cover maps of 2018 and 2019 were subsequently produced using supervised classification approaches. To verify the accuracy and reliability of the LULCC results, we used the historical images of Google Earth to check the detected changed area. A total of 25 changed areas were chosen as the test area, of which 23 exhibited significant changes. The accuracy of the LULCC exceeds 90%.
The Bagan heritage site generally covers the alluvial plain flanking the Irrawaddy River, thus the foundation belongs to the soft-soil layer (Zaw, Htet, and Min Citation2018). Based on correlation analysis with the deformation fields (in the period of 2019–2020), the LULCC results reveal land subsidence to be correlated with the detected changed patches (), in particular for those of ‘1–4’ ((b)) with their surface subsidence shown in (c). This may be associated with the compression procedure of the soft-soil beneath built-up areas. Based on Terzaghi theory (Terzaghi and Peck Citation1996), new development zones accelerate the compression and creeping of soil layers because of the downward pressure from buildings or other infrastructures, resulting in the surface subsidence lasting for several years relevant to a primary-secondary consolidation procedure. By comparing the historical images of Google Earth from 2019 to 2020, the changed areas of ‘1’ to ‘4’ in (b) are indeed built-up areas changed from other land cover types or with new-built constructions. Since the TerraSAR-X data used in this study is within two years (from 2019 to 2020), the deformation caused by the downward pressure from buildings can be simplified as a linear model. In the case of using SAR data with an observation period of three or more years, the trend of surface subsidence needs to be characterized using more complicated models.
Figure 7. LULCC regions reveal a subsidence phenomenon due to the soft soil compression following the construction of buildings. (a) Land cover classification map, (b) detected LULCC hotspots marked by pink polygons, (c) representative LULCC patches for ‘1–4’ in (b) indicating a correlation between surface subsidence and the LULCC patches.
3.2. Pagoda structural instability
Considering the OUV of the irreplaceable monuments, preventive monitoring for the structural instability of pagodas is a priority for the Bagan site. Based on its ability to determine the precise geolocation and its effective identification of structural deformations, we employed the HR-based PSInSAR approach to monitor and characterize pagoda structural instability using the derived deformation products of velocity rates and motion time series.
3.2.1 Gawdawpalin
The Buddhist temple Gawdawpalin Pagoda is the second tallest temple in Bagan, with a height of 55 m, three lower terraces and four upper terraces. Construction of the pagoda began in AD 1203 during the reign of Sithu I (AD 1174–1211) and was completed on AD 1227 during the reign of Htilominlo (AD 1211–1235). This temple was heavily damaged during the 1975 earthquake and has subsequently been reconstructed.
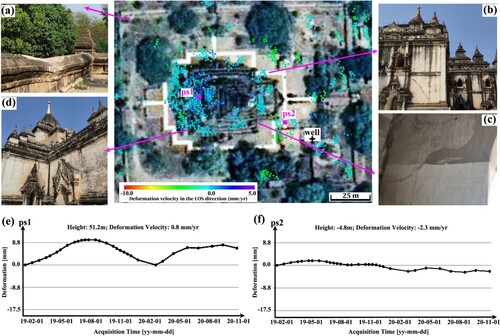
The deformation derived from the PSInSAR approach generally reveals the conditions surrounding the temple to be stable. However, several deformation anomaly hotspots are observed (). A moderate surface subsidence (approximately −3.0 mm/yr) was detected in the north-west, north-east and south-east of the subareas ((a)), and the corresponding architecture component instability was observed via cracks in (b) and (c). In contrast, the south-west component of the architecture exhibits a stable condition ((d)). Due to the presence of a water pumping well (star in ), the observed structural instability on the south-east component may be a result of the local land subsidence linked to the groundwater exploitation. The motion time series of ps2 (overlaid with the crack location on the first lower terraces, (f)) also presents a moderate subsiding trend with a deformation rate of −2.3 mm/yr. This validates the occurrence of the observed surface subsidence. (e) presents the motion time series of ps1 (overlaid on the top terrace with a 51.2 m height). Although the measured deformation rate indicates a stable condition (0.8 mm/yr), a seasonal cyclical trend with a dispersion amplitude of 9.0 mm is observed, contributing to the seasonal accumulated thermal dilation of the temple.
Figure 8. Structural instability observed from InSAR measurements of the Gawdawpalin Pagoda. (a) Field photographs of surface sinking, (b) and (c) cracks observed on the north-east and south-east components, and (d) stability observed on the south-west component of the temple. (e) ps1 and (f) ps2 motion time series. Star denotes the location of the temple pumping well.
3.2.2 Dhammayangyi
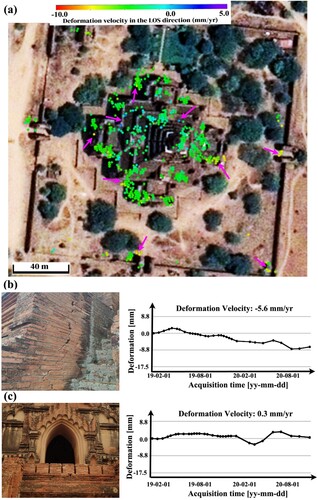
Dhammayangyi (or commonly known as Dhammayan) is the largest of all Bagan pagodas, extending approximately 78 m on each of its four sides, and was built during the reign of King Narathu (AD 1167?−1170?). The temple's interior is bricked up for unknown reasons, thus only the four porches and outer corridors are accessible. On August 24, 2016, a 6.8 magnitude earthquake shook Myanmar, centered approximately 24 km west of Chauk, a town south of Bagan. At least 185 brick pagodas in Bagan site were damaged, including the Dhammayangyi Pagoda. Despite the implementation of several strengthening measures, monitoring the structural instability of the temple is essential for the preventive monitoring as well as for the evaluation of implemented measures.
Although the PSInSAR-derived deformation rates overlaid on the pagoda generally reveal the ancient temple to be stable, several hotspots indicate diverse deformation rates. For example, numerous LOS uplifting points +1.5 mm/yr or LOS subsiding points
−6.0 mm/yr were identified (arrows in (a)). The vulnerability of the entire pagoda was observed via manual inspection during the field investigation ((b)). The 1-cm wide observed cracks ((b)) prove several architecture components to be structurally unstable (detected via PSInSAR and marked by arrows). The motion time series of PS points from unstable and stable structural components are shown in (b) and (c), respectively. A clear deformation trend is evident (e.g. subsidence with a velocity rate of −5.6 mm/yr in (b)) for vulnerable components while sinusoidal motions (e.g. with a velocity rate of 0.3 mm/yr in (c)) are linked to the stable components. Considering the consistent motion anomalies, the detected hotspots (marked by arrows) require priority-level monitoring.
Figure 9. PSInSAR deformations and structural instability of the Dhammayangyi Pagoda. (a) Structural instabilities detected by PSInSAR deformation velocities, marked by arrows. (b) Observed cracks along with the measured InSAR deformation time series versus (c) stable condition of the structural component along with the measured InSAR deformation time series.
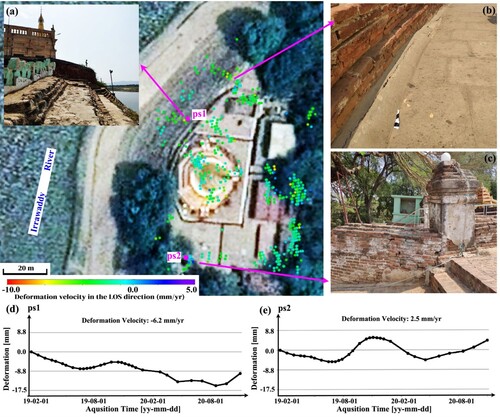
3.2.3 Lawka Nandar
Lawka Nanda Pagoda (also spelled Lokananda, literally ‘joy of the world’) is a Buddhist Zedi located in the New Bagan region. It was erected on the bank of the Ayeyarwaddy River and built during the reign of King Anawrahta (AD 1059). The temple underwent reconstruction following the earthquake in 2016.
Compared to other temples, the impact of Riparian erosion on Lawka Nanda Pagoda may be relatively stronger due to its close proximity to the river. As with the former two temples, the surface and monuments surrounding the pagoda were generally observed to be stable, while three hotspots were detected based on the HR InSAR data and the millimetric deformation measurements (). The riparian erosion was evident, as illustrated in the field photographs (fragmented bank in (a) and wall cracks in (b)) and the PSInSAR anomaly deformations (pink arrows), with values of −6.2 – −5.8 mm/yr relative to −2.0 – −1.0 mm/yr for the surroundings. The PSInSAR measurements also revealed the vulnerability of other architectures (+2.5 mm/yr) due to the long-term degradation, as well as the impact from the tourism industry and previous earthquakes ((c)). The motion time series trends of PSs from subzones with riparian erosion (ps1 in (d)) and long-term degradation (ps2 in (e)) are totally different; that is, a prevailing subsidence trend (−6.2 mm/yr) for the former versus a mild uplift (2.5 mm/yr) modulated with a seasonal disturbance for the latter.
Figure 10. PSInSAR-derived deformations on the Lawka Nandar Pagoda. Field photographs present (a) riparian erosion; and (b) and (c) structural vulnerability with deformation anomalies. (d) and (e) are deformation time series of ps1 and ps2 located at subzones of (a) and (c), respectively.
4. Discussion
The complementary deformation results determined from the SBAS and PSInSAR approaches, whereby the former is effective for landscape surfaces and the latter is more suited for ancient architecture (i.e. pilot case studies in Europe (Tapete and Cigna Citation2017) and Asia (Chen et al. Citation2017, Citation2019)), imply the potential of MTInSAR for the preventive monitoring and assessment of large-scale cultural heritage sites. This is particularly true for the application of HR data. In this study, vulnerable hotspots were identified by InSAR deformation anomalies and were further validated by the cooccurrence of on-site structural cracks. Note that no vulnerable signs were observed for InSAR measured stable components of padogas, as shown in and . Moreover, the height estimates of architectures, to some extent, indirectly demonstrate the precision of the derived deformation results. In the case of unavailable field measurement data, such as precise leveling, the combined usage and cross comparison of SBAS and PSInSAR provide a quantitative approach to verify the robustness of MTInSAR estimates. The results demonstrate the ability of remote sensing approaches for the preventive monitoring of World Heritage sites, particularly when field surveillance is constrained.
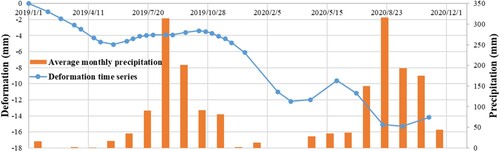
Following its inscription to the UNESCO World Cultural Heritage list, the development progress of the tourism industry in Bagan has increased rapidly. The remote sensing-based surveillance and interpretation in this study reveals the challenges for the sustainable development of Bagan. In addition, this site lies within the seismic belt of Myanmar as shown in (c). Thus unexpectable earthquakes exert considerable structural damage, for example the great earthquake in 2016. Generally, for stakeholders, in the face of natural disasters, measures need to be taken to minimize the impact on the ancient pagodas. For example, consolidation measures for the river bank and ancient architectures designed as regular maintenance. Meteorological factors, such as precipitation and floods, can also cause continuous or sudden harm to ancient temples (World Bank Citation2017). As shown by , the deformation time series of a representative PS point located in Dhammayangyi pagoda presents a pattern associated with the seasonal periodic changes of precipitation. The correlation between these two factors demonstrates that seasonal rainfall has a certain impact on the stability of pagodas. Moreover, the deformation time series is also affected by linear subsidence trends and atmospheric effects, with the latter causing a relatively significant transmission delay of microwave signals in cloudy and rainy seasons (Hanssen Citation2001; Bekaert et al. Citation2015). Thus, the change trend of deformation time series is not completely consistent with the precipitation trend.
Figure 11. Correlation between deformation time series of a representative PS point and average monthly precipitation.
Anthropogenic activities, particularly those that aim to develop the tourism industry, are both anticipated and manageable. The tourism industry attracts visitors to stay and consume at the heritage community, typically during the cool and dry climate between October to February. However, this brings with it environmental and ecological pressures across the entire site. For example, the tourism impacts on the Angkor World Heritage site, where the annual number of visitors far outnumber residents, induced a water crisis due to the declining groundwater table and the overexploitation of water from uncontrolled private pumping wells (Chen et al. Citation2019). Thus, the effective management of tourism and water resources is a priority that requires preventative measures.
For the application of multi-temporal InSAR in the monitoring of cultural heritage sites, it is suggested to use SBAS for heritage sites dominated by natural surfaces, while PSInSAR for monument structural instability. SAR images with medium resolution are recommended for the monitoring of entire sites, particularly for large-scale heritage sites. High resolution better than 3 meters is necessary for monument monitoring. In addition, the limitations of InSAR techniques are also revealed by this study. On the one hand, the deformation derived by InSAR is in the direction of LOS. The displacement information cannot be detected when the moving direction is perpendicular to LOS. Therefore, the results with ascending and descending SAR images are recommended to be combined to minimize the loss of deformation information if both of these two types of SAR data are available. On the other hand, multi-temporal InSAR can only monitor slow surface deformation but not sudden deformation such as sudden collapse of pagodas. That is because the phase incoherence caused by sudden displacement results in the failure to extract enough coherent point measurements.
5. Conclusions
In this study, we applied a remote sensing-based approach for the monitoring of landscape-monument deformation and the subsequent contributing factor analysis. Owing to the development of Earth Observation techniques and the relevant data processing technologies, dynamic surface elements can be quantitatively characterized on an annual basis, providing informative indicators (such as deformation velocity and change rate of surface elements) for the sustainable development of the entire site. The earthquake (natural) and LULCC (anthropogenic) were analyzed as influence factors of the structural instability at the site. The deformation results derived from SBAS and PSInSAR were generally observed to be complementary. The application of the HR InSAR data allowed for the structural instability monitoring of the ancient pagodas in Bagan via the spatial deformation anomalies. Our work provides first-hand scientific data and new insights for the conservation of Bagan and indicates the potential of HR InSAR for large-scale architecture heritage deformation monitoring and impact analysis.
Author contributions
Conceptualization, F.C. and H.L.; methodology, F.C., Y.T. and W.Z.; validation, F.C., R.L., W.Z., J.L. and C.F.; writing—original draft preparation, F.C.; writing—review and editing, W.Z., Y. T.,T. B., P. S. and M. Z. All authors have read and agreed to the published version of the manuscript.
Acknowledgments
The TerraSAR-X data in this study were provided by the German Aerospace Center (DLR) under the proposal MTH3568.
Disclosure statement
No potential conflict of interest was reported by the author(s).
Data availability statement
The data that support the findings of this study are available on request from the corresponding author [Z.W.]. The HR spotlight TerraSAR-X data are not publicly available due to the Data Confidentiality Agreement with DLR. The Level-1A Gaofen-1 satellite data are not publicly available due to the data copyright restrictions.
Additional information
Funding
Notes
1 https://whc.unesco.org/en/list/1588/. Accessed on 12 May 2021.
2 https://www.visit-bagan.com/weather-climate. Accessed on 7 September 2021.
References
- Agapiou, A. 2021. “UNESCO World Heritage Properties in Changing and Dynamic Environments: Change Detection Methods Using Optical and Radar Satellite Data.” Heritage Science 9 (1): 1–14.
- Bekaert, D., R. Walters, T. Wright, A. Hooper, and D. Parker. 2015. “Statistical Comparison of Insar Tropospheric Correction Techniques.” Remote Sensing of Environment 170: 40–47.
- Berardino, P., G. Fornaro, R. Lanari, and E. Sansosti. 2002. “A new Algorithm for Surface Deformation Monitoring Based on Small Baseline Differential SAR Interferograms.” IEEE Transactions on Geoscience and Remote Sensing 40: 2375–2383.
- Breiman, L. 2001. “Random Forest.” Machine Learning 45: 5–32.
- Chen, F., H. Guo, N. Ishwaran, J. Liu, X. Wang, W. Zhou, and P. Tang. 2019. “Understanding the Relationship Between the Water Crisis and Sustainability of the Angkor World Heritage Site.” Remote Sensing of Environment 232: 111293.
- Chen, F., H. Guo, P. Ma, H. Lin, C. Wang, N. Ishwaran, and P. Hang. 2017. “Radar Interferometry Offers new Insights Into Threats to the Angkor Site.” Science Advances 3: e1601284.
- Colesanti, C., A. Ferretti, F. Novali, C. Prati, and F. Rocca. 2003. “SAR Monitoring of Progressive and Seasonal Ground Deformation Using the Permanent Scatterers Technique.” IEEE Transactions on Geoscience & Remote Sensing 41 (7): 1685–1701.
- De Maio, A., G. Fornaro, and A. Pauciullo. 2009. “Detection of Single Scatterers in Multidimensional SAR Imaging.” IEEE Transactions on Geoscience and Remote Sensing 47: 2284–2297.
- Edwards, B., T. Frasch, and J. Jeyacheya. 2019. “Evaluating the Effectiveness of Land-use Zoning for the Protection of Built Heritage in the Bagan Archaeological Zone, Myanmar—a Satellite Remote-Sensing Approach.” Land Use Policy 88: 104174–104174.
- Ferretti, A., C. Prati, and F. Rocca. 2000. “Nonlinear Subsidence Rate Estimation Using Permanent Scatterers in Differential SAR Interferometry.” IEEE Transactions on Geoscience & Remote Sensing 38 (5): 2202–2212.
- Ferretti, A., C. Prati, and F. Rocca. 2001. “Permanent Scatterers in SAR Interferometry.” IEEE Transactions on Geoscience and Remote Sensing 39: 8–20.
- Hanssen, R. 2001. Radar Interferometry Data Interpretation and Error Analysis. Dordrecht: Kluwer Acameic Pulishers.
- Lambin, E. F., and A. H. Strahlers. 1994. “Change-vector Analysis in Multitemporal Space: A Tool to Detect and Categorize Land-Cover Change Processes Using High Temporal-Resolution Satellite Data.” Remote Sensing of Environment 48: 231–244.
- Lanari, R., O. Mora, M. Manunta, J. J. Mallorquí, P. Berardino, and E. Sansosti. 2004. “A Small-Baseline Approach for Investigating Deformations on Full-Resolution Differential SAR Interferograms.” IEEE Transactions on Geoscience and Remote Sensing 42: 1377–1386.
- Lombardo, L., H. Tanyas, and I. C. Nicu. 2020. “Spatial Modeling of Multi-Hazard Threat to Cultural Heritage Sites.” Engineering Geology 277: 2015776.
- Ma, P., and H. Lin. 2016. “Robust Detection of Single and Double Persistent Scatterers in Urban Built Environments.” IEEE Transactions on Geoscience and Remote Sensing 54: 2124–2139.
- World Bank. 2017. “Disaster Risk Management Strategy.” In Nomination Dossier for Inscription on the World Heritage List-Bagan. Vol III: ANNEX:R The Integrated Management Framework (Management Plan), edited by the Ministry of Religious Affairs and Culture with Government of Mandalay Region and Government of Magway Region, Myanmar. https://whc.unesco.org/en/list/1588/documents/
- Moise, C., I. D. Negula, C. E. Mihalache, A. M. Lazar, A. L. Dedulescu, G. T. Rustoiu, I. C. Inel, and A. R. Badea. 2021. “Remote Sensing for Cultural Heritage Assessment and Monitoring: The Case Study of Alba Iulia.” Sustainability 13: 1406.
- Mon, C., X. Gong, Y. Wen, M. Jiang, Q. Chen, M. Zhang, G. Hou, M. Thant, K. Sein, and Y. He. 2020. “Insight Into Major Active Faults in Central Myanmar and the Related Geodynamic Sources.” Geophysical Research Letters 47 (8): e2019GL086236.
- Otsu, N. 1979. “A Threshold Selection Method from Gray-Level Histograms.” IEEE Transactions on Systems, Man and Cybernetics 9: 62–66.
- Reale, D., C. Noviello, S. Verde, L. Cascini, G. Terracciano, and L. Arena. 2019. “A Multi-Disciplinary Approach for the Damage Analysis of Cultural Heritage: The Case Study of the St. Gerlando Cathedral in Agrigento.” Remote Sensing of Environment 235: 111464.
- Schunert, A., and U. Soergel. 2012. “Grouping of Persistent Scatterers in High-Resolution SAR Data of Urban Scenes.” ISPRS Journal of Photogrammetry and Remote Sensing 73: 80–88.
- Sesana, E., A. S. Gagnon, C. Ciantelli, J. Cassar, and J. J. Hughes. 2021. “Climate Change Impacts on Cultural Heritage: A Literature Review.” WIRES Climate Change 12: e710. Doi: 10.1002/wcc.710.
- Tapete, D., N. Casagli, G. Luzi, R. Fanti, G. Gigli, and D. Leva. 2013. “Integrating Radar and Laser-Based Remote Sensing Techniques for Monitoring Structural Deformation of Archaeological Monuments.” Journal of Archaeological Science 40: 176–189.
- Tapete, D., and F. Cigna. 2017. “InSAR Data for Geohazard Assessment in UNESCO World Heritage Sites: State-of-the-art and Perspectives in the Copernicus era.” International Journal of Applied Earth Observation and Geoinformation 63: 24–32.
- Tapete, D., and F. Cigna. 2017. “Trends and Perspectives of Space-Borne SAR Remote Sensing for Archaeological Landscape and Cultural Heritage Applications.” Journal of Archaeological Science: Reports 14: 716–726.
- Terzaghi, K., Peck R., and Mesri G. 1996. Soil Mechanics in Engineering Practice. Third edition. New York: John Wiley & Sons.
- Themistocleous, K., B. Cuca, A. Agapiou, V. Lysandrou, M. Tzouvaras, D. Hadjimitsis, P. Kyriakides, et al. 2016. “The Protection of Cultural Heritage Sites from Geo-Hazards: The PROTHEGO Project.” Springer International Publishing. Doi:10.1007/978-3-319-48974-2_11.
- Themistocleous, K., C. Danezis, and V. Gikas. 2021. “Monitoring Ground Deformation of Cultural Heritage Sites Using sar and Geodetic Techniques: The Case Study of Choirokoitia, Cyprus.” Applied Geomatics 13: 37–49. Doi:10.1007/s12518-020-00329-0.
- Tosi, L., C. Lio, P. Teatini, and T. Strozzi. 2018. “Land Subsidence in Coastal Environments: Knowledge Advance in the Venice Coastland by TerraSAR-X PSI.” Remote Sensing 10: 1191.
- Zaw, T., S. Htet, and T. Min. 2018. “Geohazards and preliminary studies on environmental degradation in Bagan-Nyaung OO area, Mandalay region.” Myanmar Academy of Arts and Science Conference XVI. 5.
- Zhang, W. 2019. “Research Report on Cultural Heritage Protection in Myanmar.” In Annual Report on ASEAN’s Cultural Development (2019), edited by Z. Liu, 248–266. Social Science Literature Press (of China).
- Zhang, Y., F. Heresh, and A. Falk. 2019. “Small Baseline InSAR Time Series Analysis: Unwrapping Error Correction and Noise Reduction.” Computers & Geoscience 133: 104331.
- Zhao, F., J. Mallorqui, R. Iglesias, J. A. Gili, and J. Corominas. 2018. “Landslide Monitoring Using Multi-Temporal SAR Interferometry with Advanced Persistent Scatterers Identification Methods and Super High-Spatial Resolution TerraSAR-X Images.” Remote Sensing 10: 921.
- Zhou, W., F. Chen, and H. Guo. 2015. “Differential Radar Interferometry for Structural and Ground Deformation Monitoring: A New Tool for the Conservation and Sustainability of Cultural Heritage Sites.” Sustainability 7 (2): 1712–1729.