
 ?Mathematical formulae have been encoded as MathML and are displayed in this HTML version using MathJax in order to improve their display. Uncheck the box to turn MathJax off. This feature requires Javascript. Click on a formula to zoom.
ABSTRACT
As a significant part of sustainable urban development proposed by the United Nations, urban planning is related to the ecological environment and transportation, especially affecting quality of life and social well-being. In the process of urban planning, the public express their opinions on open network platforms, resulting in large quantities of network public opinion data, which has important implications for evaluating urban planning. Based on the idea of geographical case-based reasoning (CBR), this paper constructs an expression framework for urban planning cases in the form of a ‘case problem–case attribute–case result’ triad. On this basis, this paper proposes a similarity calculation method of urban planning cases that integrates case attribute. Finally, based on an improvement to the traditional k-nearest neighbors method, the proposed public opinion feature calculation model considers similarity weights, which allow us to predict network public opinion features, including viewpoint-level emotional tendency and concerned groups of urban planning cases. The experimental result shows similarity weights (SWs) model could effectively improve the prediction accuracy, where the average MIC-F1 score reached more than 74%. Based on CBR, the proposed method can predict the development trends of public opinion in future planning cases, and provide scientific and reasonable decision support for urban planning.
1. Introduction
Urbanization is one of the most irreversible and influential human activities, which affects the sustainable development of cities and the living standard of residents (Li, Sun, and Fang Citation2018; Shao et al. Citation2021). The growth of urban population and changes in the type of urban land use have exacerbated the process of urban expansion in developing countries, posing significant demands and challenges to the rational planning of urban space and land resources (Sumari et al. Citation2020; Guo et al. Citation2022; Xu et al. Citation2019). With the rapid development of urbanization (Deng, Fu, and Sun Citation2018), urban planning has a direct impact on quality of life and well-being, and the public has an increasingly strong desire to participate in urban planning (Xing et al. Citation2011). Western countries have conducted extensive exploration and research on public participation in urban planning, which is of great significance for making scientific and people-friendly urban planning decisions (Arnstein Citation1969; Forester Citation1999; Healey Citation1992). Today’s top-down planning approach may no longer be applicable to the current urban development process (Li et al. Citation2019), especially in consideration of the diversity of cities and the awakening of public consciousness in the era of economic prosperity. With the emergence of the Internet of Things and the increasing popularity of the Internet, social media has become an indispensable part of people’s daily lives (Abdul-Rahman et al. Citation2021). With the help of open online platforms, people can participate in urban planning (Mahdavinejad and Amini Citation2011; Rall, Hansen, and Pauleit Citation2019), which results in the convergence of a large number of urban planning networks of public opinion that profoundly impact the rational preparation and smooth implementation of urban planning. Full consideration of the public’s emotional attitude in public opinion will help to improve the rationality, democracy, and scientificity of urban planning, and achieve widespread participation (Hao, Zhu, and Zhong Citation2015). Urban planning is forward-looking to a certain extent, and it is necessary to determine the direction of future urban planning based on historical planning experience. A recent focus of investigation pertains the use of big data resources of public opinion in urban planning in an effort to predict the emotional tendencies and concerns of groups in future planning cases based on historical planning cases (Holt Citation1999), and to provide guidance for urban planners.
Spanning a wide range of research content, including hotspot event prediction (Skoric, Liu, and Jaidka Citation2020; Chen, Duan, and Wang Citation2017; Ma et al. Citation2019), major event early warning (Forkan, Khalil, and Atiquzzaman Citation2017; Yu et al. Citation2008; Fu et al. Citation2016), and evolution trend prediction (Zhang et al. Citation2019; Li Citation2021; Fu and Zhao Citation2021), public opinion prediction is a hot research topic in many areas such as social politics, economy, culture, and so on. Prediction models of network public opinion can be divided into two categories (You and Chen Citation2016). The first consists of predictions model based on traditional statistics, and the other is based on intelligent machine algorithms. In terms of public opinion heat prediction, many methods, such as time series models (Hester and Gibson Citation2003), grey prediction methods (Wenjie et al. Citation2013; Tien Citation2012), prediction models built by back-propagation neural networks (Chen, Liu, and Zhang Citation2015; Zeng et al. Citation2007), etc., are used to predict and analyze the changing trends of public opinion heat in case-by-case events. Popularity prediction algorithms combined with latent Dirichlet allocation (LDA) and k-nearest neighbors (KNN) (Berbague, El islem Karabadji, and Seridi Citation2018) can further improve the accuracy of heat prediction of public opinion. In terms of sentiment prediction of public opinion, multiple linear regression models (Chen, Duan, and Wang Citation2017), transfer learning (Tao and Fang Citation2020), and other methods are used to predict the emotional tendency of public opinion. Correlation vector machine models are also used to predict the emotional tendency of netizens (Xin et al. Citation2016; Rajendiran and Priyadarsini Citation2022), which can avoid the problem of local optimal solutions.
In the field of urban planning, research on public opinion prediction mainly focuses on the analysis and prediction of user satisfaction in planning. By selecting indicators related to factors such as the natural environment (Rafieian, Asgary, and Asgarizade Citation2009) and social environment (Wu and Jung Citation2016), it is possible to analyze the influencing factors of user satisfaction (Gruber and Shelton Citation1987; Currie and Thacker Citation1986), and construct satisfaction prediction models based on analytic hierarchy processes. The questionnaire survey method is used to obtain the opinion of stakeholders regarding planning and their corresponding demands (Fan Citation2015). The topic of public opinion can be extracted through the analysis of public feedback on specific planning projects (Baawain et al. Citation2020). At present, in the field of urban planning, most data are obtained from questionnaire surveys, and the big data resources of public opinion are not fully utilized. There are also limitations in the quantity and concentration of such data, which makes it difficult to reflect the overall trends of the development of public opinion. At the same time, there is a lack of multi-dimensional analyses of the characteristics of public opinion, and multi-dimensional attributes such as subjective social population factors and objective geographical environment factors, which are not fully considered. Therefore, it is difficult to predict emotional tendency at the viewpoint-level and the categories of concerned groups in these cases. Land use and land cover information is used for effective detection of urban land use patterns, which, combined with aerial and satellite remote sensing data, can improve understanding of changes in urban area functions (Liu et al. Citation2017; Ligate, Chen, and Wu Citation2018). In addition, the combination of remote sensing and GPS data improves the measurement and analysis accuracy of urban sprawl (Xu et al. Citation2019). Social media data is considered a valuable resource for advancing urban research, bringing new perspectives to urban research. It is used to study the relationship between urban population distribution and urban function, the impact of human activities on urban environment, and public participation in urban planning (Martí, Serrano-Estrada, and Nolasco-Cirugeda Citation2019; Li, Shen, and Hao Citation2016).
Based on the spatiotemporal analysis of urban planning case data, it is possible to infer judgment of the state and possible results of an urban planning case, which in turn can be applied to the result prediction of urban planning problems and decision-making judgment of urban planning events (Ye and Shi Citation2001; Yang et al. Citation2008; Du et al. Citation2002). This paper proposes a public opinion feature prediction method based on urban planning case reasoning, which refers to calculating the public opinion features of a new urban planning case based on the public opinion information of historically similar urban planning cases. Based on the theory of geographical case-based reasoning (CBR), this paper proposes a method to calculate the similarity weights (SWs) of urban planning cases by integrating the temporal, spatial, and population attributes of cases, so as to realize the feature prediction of urban planning network public opinion. On the basis of urban planning CBR, a public opinion prediction model of urban planning cases is constructed that integrates subjective social population factors and objective geographical environment factors. According to the public opinion features of similar historical planning cases, the emotional tendency from different viewpoints and the categories of concerned groups of new planning cases are predicted to provide decision-making support for such planning. In Section 2.1 and Section 2.2, we detail the study area and the sources of data used in the study. In Section 2.3, we propose the prediction process of public opinion features of urban planning CBR, while in Section 2.3.1, we construct an expression framework for urban planning cases; In Section 2.3.2, we put forward a similarity calculation model of urban planning cases; and in Section 2.3.3, we focus on the calculation method of public opinion features based on SWs. In Section 3, we forecast public opinion features based on the planning data of Guangzhou, China. Finally, in Section 4 we present our conclusions.
2. Data source and methodology
2.1. Study area
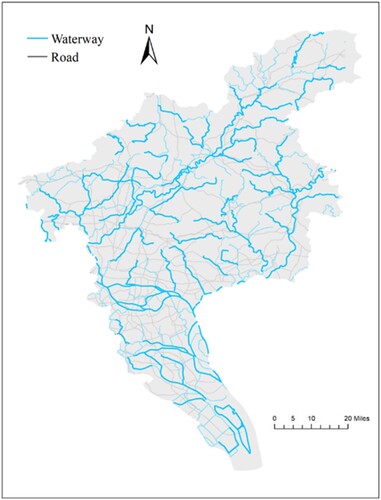
The study is conducted in Guangzhou, located in the south of mainland China (latitude 22°26′–23°56′ N, longitude 112°57′–114°03′ E) (). Guangzhou is one of the most highly developed megacities in China. As the capital of Guangdong Province, Guangzhou is the political, economic, scientific, technological, educational, and cultural center of Guangdong Province. In 2020, the gross domestic product (GDP) of Guangzhou was 250.19 billion RMB. By the end of 2020, the total population in Guangzhou was 18.6766 million, making it the fifth largest city in China. Guangzhou has 11 administrative districts, namely, Yuexiu District, Haizhu District, Liwan District, Tianhe District, Baiyun District, Whampoa District, Huadu District, Panyu District, Nansha District, Conghua District, and Zengcheng District.
Figure 1. Map of the study site.
2.2. Data source
(1) Public announcement data and online public feedback data of planning projects
The data used in this study are from the public announcement of urban planning projects on the website of the Guangzhou municipal planning and natural resources bureau (http://ghzyj.gz.gov.cn/) and the corresponding public feedback data. Public announcement data of urban planning projects can be browsed and downloaded on this website. People can freely comment on the corresponding planning projects on this website, and these planning public feedback data are collected for analysis. The collected data span from 22 November 2007 to 3 September 2019, involving 3434 planned projects and 102,825 public comments. The data covers all county-level cities in the districts and counties under the jurisdiction of Guangzhou city. Announcement data contain detailed information about urban planning projects, such as project ID, name, and location, while public feedback data is a kind of semi-structured data, including fields such as release time, release IP, corresponding planning number, body content, etc. Feedback opinions and announcement data are linked by project ID, and the body content data of text type are the data source for the extraction of online public opinion features of urban planning in this paper.
(2) Point of interest data
In this study, the Gaode Map’s application programming interface (API) was used to obtain point of interest (POI) data for the whole research area, which yielded 893,924 datapoints. The coordinates of these data were converted to the WGS84 coordinate system. Some example POI data are shown in .
(3) Population data
Table 1. Example of POI data.
According to the 2000 census data published on the official website of the Bureau of Statistics of Guangzhou city (http://tjj.gz.gov.cn/), the statistical data of all subdistrict administrative areas of the city were obtained, which contained the population ages, education levels, and main sources of living.
2.3. Urban planning CBR
The complexities of geographical environments lead to many factors affecting geographical problems, which makes it difficult to use mathematical models for accurate prediction and reasoning. However, phenomena or problems in complex geographic environments often show similar relationships (Wenjing et al. Citation2008). Thus, when performing similarity analyses between geographical problems, hidden information in the geographical environment can be obtained, avoiding the use of complex mathematical models for problem-solving. On the basis of the similarity calculation method, geographical CBR extracts similar geographical cases from a large number of historical data to make predictions to complex geographical problems. Different from abstract simulations based on mathematical models, geographical CBR can allow for the analysis of geographical environmental problems from an overall point of view and build a model based on its own similarity (A Holt Citation2000).
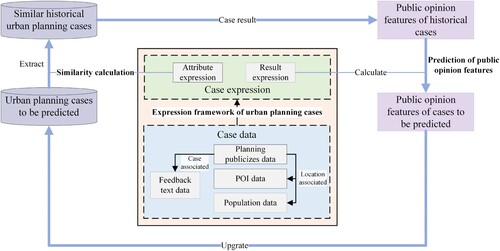
Urban planning case is an organization or description of urban planning phenomenon in geographical space and its influence. It is an abstract description of urban planning geographic information and network public opinion information based on geographical cases. It contains both geographical space–time information of traditional geographical cases and rich network public opinion information. Urban planning CBR refers to the application of geographical CBR to urban planning. After the new planning case is made, and considering the different attribute characteristics of the planning case, a case similarity measurement index can be defined. Similar planning cases are extracted from the historical planning case base, and the calculation strategy of public opinion features is constructed to predict public opinion features that may be triggered by the new planning activity according to the public opinion features of historical cases. The prediction process of public opinion features of urban planning CBR based on geographical CBR mainly includes the following three parts, as shown in .
Expression of urban planning case. Considering the influence of geographical space, the attribute features and spatial features of urban planning cases are described and quantitatively expressed, and the problems to be solved in urban planning CBR are clarified.
Calculation of the case similarity. According to the specific expression method of urban planning cases, the corresponding similarity calculation method of cases is determined. Historical cases similar to the case to be predicted are extracted, and the similarity between the geographical environments in which the cases are located is considered in the similarity calculation.
Prediction of public opinion features. The rules and strategies for solving the case problem of urban planning case are constructed, and the case problem of urban planning case to be predicted will be solved according to the result states of similar historical cases.
Figure 2. Prediction process of public opinion features based on urban planning CBR.
2.3.1. Expression of urban planning case
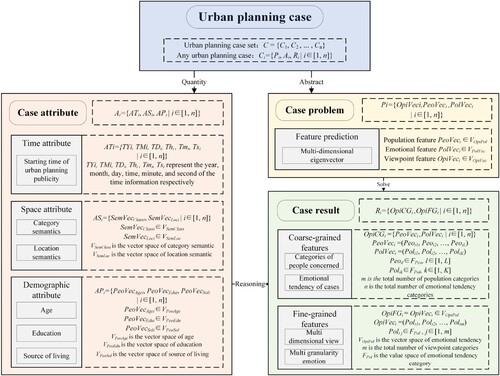
The urban planning case is an abstract description of public feedback after the public announcement of an urban planning project. Based on the theory of geographic CBR, this section constructs a case description model of network public opinion in the form of a ‘case problem–case attribute–case result’ triad to organize the extracted information from network public opinion, and describe the relationship between the predicted public opinion features in urban planning and the temporal and spatial attributes of urban planning schemes. The expression framework is shown in . The case problem clarifies the expressed form of the prediction target of the urban planning network public opinion, and defines the multi-dimensional characteristics of the crowd, emotion, and viewpoint of the urban planning network public opinion to be predicted. Expression of the case attribute is achieved by quantifying the different information dimensions of the planning case, including the temporal information of the planning project’s publicity, its spatial properties, location information, humanistic environment, and other attribute characteristics of the geographical environment where the project is located, which is the basis for the reasoning and solving of the case problem. In other words, expression of the case result is a quantitative measurement of the state of online public opinion on urban planning, including its multi-granularity and multi-dimensional attributes, such as concerned groups, emotional tendency, and opinion categories.
Figure 3. Expression framework of urban planning cases.
2.3.1.1. Expression of the case attribute
There is a high spatial relationship between urban planning cases and their surrounding geographical environment; thus, the locations and types of planning cases are influenced by the locations and spatial relationship of existing geographical entities in the urban geographical environment. Therefore, in the attribute expression of urban planning cases, not only the attribute information of the case itself, but also the geographical environment of the city must be considered. Location is a key implicit element that affects the whole case (Du, Wen, and Cao Citation2009). In the quantitative measurement of case attribute, the location of the case should be taken as the core attribute, and influencing factors such as the spatial entity of the urban geographical environment, the spatial relationship between entities, and the urban residents connected to the case should be considered and combined. According to the categories of influencing factors of emotional tendency of public opinion, this paper divides case attribute into three parts: temporal, spatial, and population, which respectively represent ‘time’, ‘place’, and ‘people’ factors in the feature prediction of public opinion.
(1) Temporal attribute
The temporal attribute (TA) of urban planning cases is expressed through the starting time when an urban planning project becomes public knowledge. The TA not only represents the beginning time of the public announcement of the planning project, but also represents the beginning time when online public opinion begins to be expressed about the planning project. The TA of planning case is defined as
, where
and
represent the year, month, day, time, minute, and second of the time information, respectively, and 0 is used to represent low-precision or default information.
(2) Spatial attribute
The spatial attribute (SA) of urban planning cases is composed of category semantics and location semantics, which respectively express the spatial functional features and spatial structural features of each case. The category semantics of urban planning cases express the functional characteristics of land use space in the region where the urban planning cases are located, and represent the urban construction function undertaken by urban space. According to the types of land use in urban planning, this paper classifies urban planning cases, extracts the semantic information of category words from planning news data, and maps the category words into a vector representing the category semantic space. The location semantics of urban planning cases are influenced by the spatial distribution characteristics and spatial relations of the geographical entities near the planning case, which reflect the structural characteristics of urban planning geographic space. For urban planning case
, the adjacent POI set of case
is denoted as
, and the distance between any POI point
and
is
. The category semantic vector corresponding to
is denoted as
, where
is the total number of dimensions, and
. The location semantic vector corresponding to case
is denoted as
, where
is the weight of the s-th dimension. That is, the category semantic vector of the planning case is the weighted average of the category semantic vector of its adjacent POI points, and the weight is the reciprocal of the distance between POI points and the planning case.
(3) Population attribute
The population attribute (PA) includes the age, education, and main sources of living of the population in the subdistrict administrative area where the case is located. The age of the population is divided into equally spaced k-intervals, and the age eigenvector of case is defined as
, where the vector dimension is k.
is the eigenvalue of the l-th dimension, which is equal to the proportion of people whose ages are in the l-th interval. The level of education of the population is also divided into equally spaced s-intervals, and the education eigenvector of
is defined as
, where the vector dimension is s.
is the eigenvalue of the l-th dimension, which is equal to the proportion of the people whose education level is in the l-th interval. Similarly, the main sources of living of the population are divided into equally spaced q-intervals, and the main sources of living eigenvector of case
is defined as
, where the vector dimension is q.
is the eigenvalue of the l-th dimension, which is equal to the proportion of the people whose main source of living is in the l-th interval.
2.3.1.2. Expression of the case problem and case result
The case result of an urban planning case refers to the corresponding public opinion information, which have the characteristics of complexity and multi-dimensional. When people express opinions on specific planning cases, they will not only express overall approval or opposition to the planning case, but also express different views on different aspects of the project construction, such as engineering projects, planning and design, and environmental greening. Therefore, in the expression of a case result, it is necessary to quantify both the different viewpoints of urban residents and their emotional tendency toward different viewpoints. To quantitatively express the public opinion information of urban planning network public opinion cases, this paper presents the multi-granularity characteristics of urban planning network public opinion, which are divided into coarse-grained features and fine-grained features to realize a multi-level expression of the case result.
Coarse-grained features of public opinion
The coarse-grained features of network public opinion in urban planning include the categories of concerned groups and emotional responses to each urban planning case. The categories of ‘concerned people’ refer to urban residents who are influenced by the construction of planning projects and who express their opinions and attitudes towards specific planning cases. It is helpful to ascertain the demands of different urban residents on planning projects by expressing the characteristics of different urban residents and extract the types of urban residents in planning public opinion information. The categories of emotional tendency refer to the general attitude of the public towards each planning case, which are usually divided into positive, negative, and neutral. This paper uses multi-dimensional eigenvectors of concerned people and emotional tendency to express the coarse-grained features of network public opinion in urban planning. The different dimensions of the concerned group’s eigenvector represent different crowd categories, where a dimension value of 0 represents the crowd not being involved with the case, and 1 for the contrary scenario. The different dimension values of the case’s emotional tendency’s eigenvector represent the proportion of different types of emotional tendency in the urban planning network public opinion data.
All the words in the category dictionary of concerned people constitutes the concerned people category set, which is denoted as, where L is the total number of categories. For case
, a vector with L dimensions is used to represent the eigenvector of the group of people concerned about the urban planning case, which is denoted as
. Here,
, the l-th dimension of
, corresponds to the l-th category of concerned people, as shown in Equation (1), and
. When the l-th category of concerned people is in case
,
; otherwise,
.
(1)
(1)
For case , the set of public feedback texts is
, and the list of emotional tendency of these texts is
, where
represents the total number of feedback texts of case
. The collection of all public feedback sentiment categories is
, where K is the total number of categories. The eigenvector of emotional tendency is expressed as a k-dimension vector, which is denoted as
. Here,
, the k-th dimension of
, corresponds to the k-th emotional tendency,
, where
. The calculation method for
is shown in Equation (2), where
is the number of elements in list
whose value is
.
(2)
(2)
(2) Fine-grained features of public opinion
The fine-grained features of network public opinion in urban planning include the viewpoint category and the emotional tendency category. The viewpoint category refers to viewpoints on the urban planning case in all aspects of the project’s construction and residents’ lives. The emotional tendency category at the viewpoint-level reflects the degrees of satisfaction of urban residents with different opinions. In this study, a multi-dimensional eigenvector of emotional tendency at the viewpoint-level is used to express the fine-grained emotional features of urban planning cases. The different dimensions of the vector represent different categories of viewpoints, and the dimension scalar value represents the affective tendency category corresponding to the opinion category.
The set of viewpoint vocabulary vectors obtained based on the LDA model is recorded as ,
,
is the total number of viewpoints, and
is the is the total number of words. Firstly, a viewpoint cluster is defined for each viewpoint vocabulary vector, and then the viewpoint cluster is merged according to the minimum distance criterion, that is, the two viewpoint clusters with the minimum distance between the classes are merged until only one viewpoint cluster is left. The calculation method of the inter-class distance of opinion clusters
and
is shown in Equation (3). Among them,
and
represent the viewpoint vocabulary vectors belonging to the opinion clusters
and
respectively, and
is the Euclidean distance of the vectors
and
. After obtaining the multi-level opinion clusters, the semantic information of the opinion clusters is obtained according to the opinion vocabulary vector, and combined with the basic framework of the urban living environment quality evaluation index system, the opinion category system is determined, and the name of the opinion category is defined.
(3)
(3)
The emotional tendency feature at the viewpoint-level of network public opinion in urban planning is the total set of emotional tendency at the viewpoint-level of all public feedback opinion texts of the urban planning case. The eigenvector of emotional tendency at the viewpoint-level of case is recorded as
, and the text set of public feedback for case
is recorded as
, where
represents the total number of public feedback responses about the case. Any text
in public feedback set
corresponds to P categories of viewpoint. The emotional tendency at the viewpoint-level of
is recorded as
, where
represents the category of emotional tendency at the viewpoint-level. The calculation method of
for the emotional tendency of case
is shown in Equation (4), where
and
is the value of the emotional tendency category corresponding to the p-th dimension viewpoint of the text. Counting the distribution of emotional tendency categories about the p-th dimension at the viewpoint-level in the J public feedback texts of the case, the category with the largest number represents the p-th dimension of
.
is the viewpoint-level sentiment tendency category set, and
is the total number of sentiment tendency categories. For each
, it has
possible values.
is the number of elements in list
when
takes different values, and
indicates the value of
when the number is the largest.
(4)
(4)
2.3.2. Calculation of case similarity
This paper proposes a similarity calculation model of urban planning cases that integrates case attribute. According to the case expression framework, the attributes of urban planning cases are composed of TA, SA, and PA, and the case similarity is defined as the average similarity of each attribute. For cases and
in the historical cases set
,
,
is the total number of cases. The attribute set of case
is
, and the attribute set of case
is
, so the calculation formula for the similarity of case
and
is as follows:
(5)
(5)
Among them, ,
, and
are the similarity of TA, SA, and PA, respectively. The larger the
value, the greater the degree of similarity between cases.
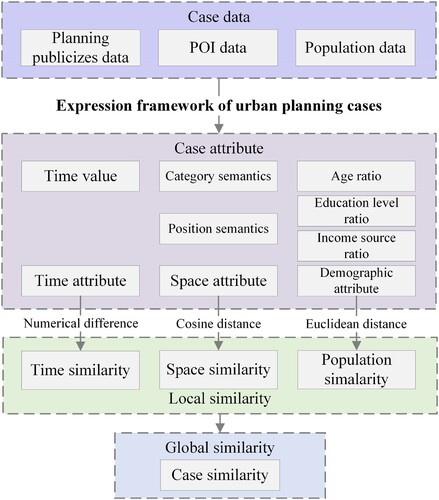
The calculation process of case similarity is shown in . Firstly, the eigenvectors of TA, SA, and PA are obtained. Secondly, different similarity calculation methods are used for the different attributes to calculate the local similarity between the different attribute features. Finally, the global similarity between cases is obtained according to Equation (4).
Figure 4. Calculation process of case similarity.
2.3.2.1. Similarity of TA
For cases and
, the calculation method of the time similarity is as in Equation (6):
(6)
(6)
Among them, and
are, respectively, the time of the first and last case in the historical planning cases.
is the distance in time, whose calculation method is as in Equation (7):
(7)
(7) where
is the 8-digit representation of
, which is calculated as
(8)
(8) where
,
, and
, respectively, represent the year, month, and day of the start time of the planning case announcement.
The value range of is [0, 1], where larger
values imply greater similarity degrees of TA.
2.3.2.2. Similarity of SA
This paper divides the SA of each case into semantic and spatial semantic feature categories. Semantic features are n-dimensional vectors of the form , where
is the weight corresponding to semantic feature term
. In this paper, the cosine distance is used to calculate the similarity of semantic eigenvectors, and hence measure the consistency of SAs in different semantic dimensions. For cases
and
, the similarity of SA is defined as the average value of the category’s semantic similarity and location semantic similarity; the calculation method is shown in Equation (9):
(9)
(9) where
represents the semantic similarity of case categories, and
represents the semantic similarity of the case location. The calculation methods of
and
are shown in Equations (10) and (11), respectively:
(10)
(10)
(11)
(11) where
and
in Equation (9) represent the category semantic vectors of cases
and
, respectively,
and
in Equation (11) represent the location semantic vectors of cases
and
, respectively, and
is the cosine distance of the semantic vector of the category position, used to measure the similarity between the directions of the vectors. For any two word vectors, e.g.
and
, the calculation method of
is shown in Equation (12):
(12)
(12)
The value range of is [0, 2]. If two vectors are exactly equal, the cosine distance between them is 0. The value range of
is [0, 1]; hence, larger
values imply higher similarities between the SAs of the urban planning cases.
2.3.2.3. Similarity of PA
In this paper, three types of features of the subdistrict where the case is located, population age, education level, and main source of living, are represented as multi-dimensional eigenvectors. The population age is divided into equally spaced k-intervals, and the eigenvector of the population age in case is defined as
, where the vector dimension is k, and
is the eigenvalue of the l-th dimension, which is equal to the proportion of people whose ages are in the l-th interval. The education level is divided into s categories, and the eigenvector of the education level in case
is defined as
, where the vector dimension is s, and
is the eigenvalue of the l-th dimension, which is equal to the proportion of the population with the l-th education level. The main sources of living are divided into q categories, and the eigenvector of the main sources of living in case
is defined as
, where the vector dimension is q, and
is the eigenvalue of the l-th dimension, which is equal to the proportion of the number of people whose main source of living is in the l-th interval.
The Euclidean distance is used to calculate the similarity of the population eigenvectors and thus measure the differences between the values of population features in different dimensions. For cases and
, the similarity of PA is defined as the average similarity value of the age, education level, and main source of living. The calculation method is shown in Equation (13):
(13)
(13) where
,
, and
are the similarity degrees of age, education level, and main source of living, respectively. Taking
as an example, its calculation method is shown in Equation (14):
(14)
(14) where
and
are the population age eigenvectors of cases
and
, and
is the Euclidian distance of the population age eigenvector, given as:
(15)
(15) where
and
are, respectively, the eigenvalues of the population age eigenvectors of cases
and
in the l-th dimension. The calculation methods of
and
are similar to that of
. The value range of
is [0, 1]; hence larger
values suggest higher degrees of similarity between the PAs of the planning cases.
2.3.3. Prediction of public opinion features
On the basis of the case similarity calculations, KNN is used to obtain the results of CBR (Guo et al. Citation2003). However, the traditional KNN method takes the category that contains the largest number of samples from the nearest K samples as the classification result, without considering the influence of the sample similarity on the result, which is prone to misclassifications caused by improper values of K (M.-L. Zhang and Zhou Citation2007). This study improves the traditional KNN method by proposing a calculation method of public opinion features based on SWs. The calculation method of emotional orientation based on SWs is based on weighting the emotional orientation of historically similar cases, and assigning larger weights to more similar cases. This approach can avoid situations where equal numbers of samples from different categories in K adjacent points occur, which reduces the amount of classification errors caused by differences in the K value, thereby improving the robustness of our prediction model.
2.3.3.1. Calculation of SW
Based on the case similarity calculation method, the K cases that are most similar to the case to be predicted are selected from the historical cases set. The public opinion feature of the case to be predicted is predicted by integrating the K historical cases. According to Equation (5), and
represent the case to be predicted and the j-th similar case, respectively, and the similarity degree of the K closest cases of
is calculated. Then, the weights of the different cases are set according to their corresponding similarities. The weight calculation method is shown in Equation (16), where the higher the similarity, the greater the weight:
(16)
(16)
2.3.3.2. Prediction of public opinion features
(1) Viewpoint-level sentiment
The emotional tendency of the case to be predicted is calculated by integrating the emotional tendencies of the K cases. According to the definition of the case problem in this paper, the emotional tendency prediction result of case is expressed as an emotional tendency vector,
, where
represents the total number of viewpoints. For emotional tendency
, the calculation method is shown in Equation (17):
(17)
(17) where H is the total number of affective tendency value categories, and
is the value of emotional tendency in the l-th dimension of the j-th similar case,
. When
belongs to class
,
; otherwise,
.
(2) Categories of concerned people
In addition to the prediction of emotional tendency, CBR can also realize the prediction of the categories of people concerned about the case. The predicted result of the categories of concerned people is expressed as vector , and the vector of the categories of concerned people in the j-th similar case is recorded as
, where L is the total number of categories of concerned people. For the l-th dimension
, and for
, the calculation method is shown in Equation (18):
(18)
(18)
Case is a similar case to case
, and
is the weight of
to
. T is the total number of values available for dimensions of the categories of concerned people. In this study, the desirable values for each dimension are {0, 1}; that is, T = 2. When case
has a category of concerned people corresponding to the l-th dimension,
; otherwise,
. According to Equation (18), the value of the l-th dimension of the vector of the category of concerned people in case
is equal to the value of the maximum sum of weights in similar cases.
In conclusion, the similarity measurement method based on the multiple attributes of each case yields the most similar historical planning cases of the case to be predicted. According to the public opinion features of historical cases, with the SW method, the emotional tendency of public opinion of planning cases and the eigenvector of concerned groups can be predicted.
3. Experiment and analysis
3.1. Analysis of experimental data
3.1.1. Data preprocessing
(1) The division of training data and semantic vector of case
The first 3334 planning cases were selected as the historical data set, spanning from 19 October 2007 to 10 August 2019, and the remaining 100 planning cases were selected as validation data for the prediction model of public opinion features, which range from 11 August 2019 to 2 September 2019. TA, the semantic vector of case category, and semantic vector of case position were obtained by calculation.
(2) Population division by attribute and population eigenvectors
The population was divided into 22 age groups: <1 years, 1–4 years, 5–9 years, 10–14 years, 15–19 years, … , 95–99 years, and >100 years. Therefore, the dimension of population age in this case is 22. The educational level was divided into seven categories, including ‘never went to school’, ‘primary school’, ‘junior high school’, ‘senior high school’, ‘junior college’, ‘undergraduate’, and ‘graduate’; thus, the dimension of educational level in this case is 7. The main sources of living were also divided into seven categories, including ‘labor income’, ‘retirement pension’, ‘unemployment insurance’, ‘minimum living security’, ‘property income’, ‘support from family members’, and ‘others’. As before, the dimension of the main sources of living in the case is 7. The inverse geocoding API of Gaode Map was used to obtain the subdistrict administrative division corresponding to the case’s coordinates, and the population feature vector of the subdistrict was taken as the population feature vector of the case. Some sample population feature vector data of the case are shown in .
Table 2. Example population eigen vectors.
3.1.2. Analysis of the overall characteristics of network public opinion
(1) Categories of population
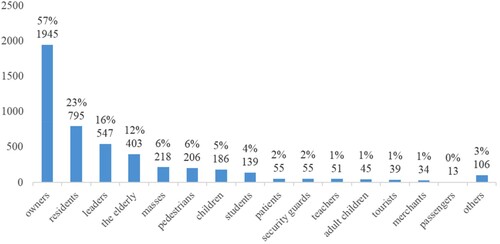
In the text of public feedback opinions, the public usually uses specific words to describe their age, occupation, and other characteristics of concerned people, such as ‘old man’, ‘child’, ‘student’, ‘head of household’, ‘leader’, and so on, indicating the category of the concerned person in the network public opinion data. With Chinese word segmentation and part-of-speech tagging, 28 groups of concerned people in the feedback text were obtained: owners, residents, children, students, the elderly, leaders, masses, pedestrians, patients, teachers, adult children, security guards, tourists, passengers, merchants, civil servants, workers, doctors, managers, intermediaries, technicians, passengers, police, sanitation workers, researchers, hosts, audience, party members, and cadres. As there are 28 population categories in the category dictionary of concerned groups, the dimension of the feature vector is 28.
The text extraction results of public feedback were summarized to obtain the categories of concerned people of planning cases. Statistics are made on the number of cases involved in the categories of concerned people, as shown in . It can be found that the ‘owner’ category has the largest number of cases, accounting for 57% of the total, indicating that the ‘owner’ group is most affected by planning.
(2) Viewpoints of public opinion
Figure 5. Statistics on the number of cases related to different groups of concerned people.
According to the point of view recognition method added in 2.3.1.2, the semantic similarities and differences among viewpoints were calculated, and viewpoints with similar lexical probability distributions were grouped into one class to obtain viewpoint clusters with hierarchical relationships. According to the results of the viewpoint clustering, a total of 6 viewpoint categories and 23 viewpoint subcategories were obtained by selecting clusters with clear meanings in the probability vector of the viewpoint vocabulary. Therefore, the dimension of emotional tendency eigenvector of viewpoint categories is 6, and that of viewpoint subcategories is 23. A classification system of viewpoints about public opinion with a two-layer structure was then constructed, where the hierarchy of the classification system is shown in .
Figure 6. Classification system of viewpoints of network public opinion in urban planning.
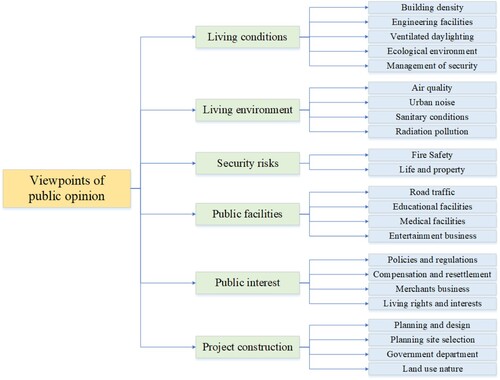
The viewpoint-level emotional tendencies were divided into four categories: neutral, positive, negative, and unmentioned, which are represented by the numbers 0, 1, 2, and 3, respectively. The positive category indicates approval and support for the planning; the negative category indicates dissatisfaction with the planned project; and the neutral category indicates suggestions and expectations regarding details of the planning scheme.
3.2. Results and analysis of the predictions
3.2.1. Analysis of the influencing factors
To explore the influence of the case attribute on the prediction of public opinion features, we designed a prediction comparison experiment with different combinations of case attribute, e.g. TA, SA, and PA. Different attribute elements were considered when calculating the similarities of the planning cases based on Equation (4) to realize the prediction of public opinion features via the combination of different attributes. We set the K value to 2% of the total number of historical cases. The viewpoint-level emotional tendency of the public opinion in the case to be predicted was calculated based on Equation (16), and the categories of the attention groups of the public opinion in the case were predicted based on Equation (17). The Hamming loss (HL), and Average-Macro-F1 (MaF1), and Average-Micro-F1 (MiF1) scores were used for model verification. shows the experimental results of the predicted emotional tendencies of the viewpoint categories and viewpoint subcategories, and the categories of concerned groups. As shown in , smaller HL values and larger MaF1 and MiF1 values indicate higher prediction accuracies.
Table 3. Prediction of public opinion features under different combinations of attributes.
In the prediction of public opinion based on the method proposed in this paper, the multi-attribute fusion (TA + SA + PA) prediction model of public opinion features had the highest prediction accuracy. Its accuracy was higher than that found when using a single attribute and double attributes. The prediction results of a single attribute can reflect the importance of different attributes for the prediction of public opinion features to a certain extent. Here, we found that the prediction accuracy based on SA was the highest, which indicates that SA is a key factor affecting the prediction of public opinion features. Interestingly, SA is ignored in most public opinion predictions at present. Similarly, in the prediction of public opinion features with a combination of two attributes, the prediction accuracy of combining SA and PA was highest. On the basis of introducing SAs, TAs, and PAs to carry out case similarity calculations, forming a multi-attribute fusion (TA + SA + PA) prediction model of public opinion features appears to yield excellent results. The prediction results on the sentiment tendency and characteristics of concerned groups were more accurate, which verifies the effectiveness of the prediction of public opinion characteristics based on the combination of multiple attributes proposed in this paper.
3.2.2. Comparison of the prediction methods
To verify the method of case public opinion feature calculation based on SWs proposed in this paper, a comparative experiment between the SW method, the traditional KNN method, and a linear support vector machine (SVM) was designed. The HL, MaF1, and MiF1 were used for model verification. As summarized in , the optimal combination of case attribute was selected, namely ‘TA + SA + PA’. The experimental results of predicting the emotional tendencies of viewpoint categories and subcategories, and the categories of concerned people are shown in .
Table 4. Comparison of prediction methods of public opinion features.
The results show that compared with linear SVM and KNN methods, the calculation strategy based on SWs can improve the prediction accuracy of public opinion features. According to the values of MaF1, the SW method had a higher MaF1 value than found with KNN in predicting the emotional tendency of viewpoint categories, the emotional tendency of viewpoint subcategories, and categories of concerned people. With the SW method, the MaF1 value increased by about 10% on average, the average-Micro-F1 value increased by about 6%, and the HL value decreased by about 16%, indicating that the introduction of the SW can significantly improve the prediction accuracy, and the model is applicable to the prediction of various public opinion characteristics. Different from the KNN model, cases with higher similarity in the SW model had higher weights in the prediction process, indicating that the characteristics of public opinion among planning cases with similar attribute characteristics were more similar, so the prediction accuracies found with the SWs were higher. The prediction accuracy of the three kinds of models in the sentiment tendency of the finer category of opinions was higher than that in the sentiment tendency of the coarser category of opinions, which further indicates that the finer classification of opinion categories was helpful for the model to measure the characteristics and similarity of case opinions, so as to obtain a higher prediction accuracy of the sentiment tendency of public opinions.
4. Conclusions
Previous studies have not conducted multidimensional analysis of urban planning cases, especially in the context of the increasingly strong desire of the public to participate in urban planning, and lack of studies that fully consider multidimensional attributes such as subjective social population factors and objective geographical environment factors. Thus, based on the theory of geographical CBR, this paper presented an expression framework of urban planning cases based on integrating subjective humanistic factors and objective geographical environment factors. By combining multi-dimensional attributes and case SWs, a prediction model was constructed that can predict the emotional tendencies and concerned groups of new planning cases. On the basis of the expression framework of case attribute, the similarity between cases was measured using multi-dimensional attributes, such as TA, SA, and PA. The emotional tendency and the concerned groups of new planning cases could be predicted according to the public opinion features of similar historical planning cases.
The experimental results showed that the case similarity measurement method with multi-dimensional attributes was helpful for improving prediction results. Compared with the traditional KNN method, the proposed prediction model based on SWs could effectively improve the prediction accuracy, where the average MIC-F1 score reached more than 74%. The prediction model proposed in this paper could predict the development trend of public opinion of future planning cases. The prediction results of emotional tendency and concerned people have the potential to be greatly beneficial to ameliorating construction schemes for future planning projects in a targeted way, thereby improving urban residents’ satisfaction, and providing reasonable decision support for urban planning.
Future research work could be carried out in the following two ways. First, more influence factors can be considered when predicting public opinion features, especially as the influencing factors of public opinion in urban planning cases are complex. This will allow us to construct a more reasonable method for measuring case similarity. Second, the weights of the different impact factors can be calculated. With different attributes in the case attribute having different influences on emotional tendency, calculating their weights may help to further improve the prediction accuracy.
Glossary
CBR: case-based reasoning
TA: temporal attribute
SA: spatial attribute
PA: population attribute
CRediT authorship contribution statement
Rui Li: Conceptualization, Methodology, Writing – original draft, Visualization. Jingqi Wang: Validation, Formal analysis, Writing – review & editing. Shunli Wang: Writing – review & editing, Visualization. Huayi Wu: Writing – review & editing.
Disclosure statement
No potential conflict of interest was reported by the author(s).
Data availability
The data that support the findings of this study are available from the corresponding author, R. L, upon reasonable request.
Additional information
Funding
References
- Abdul-Rahman, M., E. H. Chan, M. S. Wong, V. E. Irekponor, and M. O. Abdul-Rahman. 2021. “A Framework to Simplify Pre-processing Location-based Social Media Big Data for Sustainable Urban Planning and Management.” Cities 109: 102986.
- Arnstein, S. R. 1969. “A Ladder of Citizen Participation.” Journal of the American Institute of Planners 35 (4): 216–224.
- Baawain, M. S., A. Al-Mamun, H. Omidvarborna, A. Al-Sabti, and B. S. Choudri. 2020. “Public Perceptions of Reusing Treated Wastewater for Urban and Industrial Applications: Challenges and Opportunities.” Environment, Development and Sustainability 22 (3): 1859–1871.
- Berbague, C., N. El islem Karabadji, and H. Seridi. 2018. “Enhancing the Sales Diversity Using a Two-Stage Improved KNN Algorithm.” In International Symposium on Modelling and Implementation of Complex Systems, 193–203. Springer.
- Chen, X. G., S. Duan, and L. d. Wang. 2017. “Research on Trend Prediction and Evaluation of Network Public Opinion.” Concurrency and Computation: Practice and Experience 29 (24): e4212.
- Chen, N., Y. Liu, and Z. Zhang. 2015. “A Forecasting System of Micro-Blog Public Opinion Based on Artificial Neural Network.” Journal of Internet Technology 16 (6): 999–1004.
- Currie, R. F., and C. Thacker. 1986. “Quality of the Urban Environment as Perceived by Residents of Slow and Fast Growth Cities.” Social Indicators Research 18 (1): 95–118.
- Deng, Y., B. Fu, and C. Sun. 2018. “Effects of Urban Planning in Guiding Urban Growth: Evidence from Shenzhen, China.” Cities 83: 118–128.
- Du, Y., W. Wen, and F. Cao. 2009. “A Study on Spatial Data Mining Using Geo-CBR and Its Application.” Geographical Research 28 (05): 1285–1296.
- Du, Y., C. Zhou, Q. Shao, S. Fenzhen, S. Zhongzhi, and Y. Shiren. 2002. “Theoretic and Application Research of Geo-case Based Reasoning.” Acta Geographica Sinica 57 (2): 151–158.
- Fan, Y. 2015. “A Research About Public Participation in the Process of Master-Urban-Planning in China – An Introduction of Practice of Gathering Public Opinion via Questionnaire Survey.” Advances in Applied Sociology 5 (01): 13–22.
- Forester, J. 1999. The Deliberative Practitioner: Encouraging Participatory Planning Processes. London: Mit Press.
- Forkan, A. R. M., I. Khalil, and M. Atiquzzaman. 2017. “ViSiBiD: A Learning Model for Early Discovery and Real-Time Prediction of Severe Clinical Events Using Vital Signs as big Data.” Computer Networks 113: 244–257.
- Fu, Z., H. Zhang, Q. Chen, and S. Liu. 2016. “Application of Naive Bayes Classifier in Stampede Risk Early-Warning of Large-Scale Activities.” In 2016 International Conference on Industrial Informatics-Computing Technology, Intelligent Technology, Industrial Information Integration (ICIICII), 174–180. IEEE.
- Fu, L., and F. Zhao. 2021. “Prediction of Hot Topics of Agricultural Public Opinion Based on Attention Mechanism LSTM Model.” International Journal of Agricultural and Environmental Information Systems (IJAEIS) 12 (4): 1–16.
- Gruber, K. J., and G. G. Shelton. 1987. “Assessment of Neighborhood Satisfaction by Residents of Three Housing Types.” Social Indicators Research 19 (3): 303–315.
- Guo, G., H. Wang, D. Bell, Y. Bi, and K. Greer. 2003. “KNN Model-Based Approach in Classification.” In OTM Confederated International Conferences on the Move to Meaningful Internet Systems”, 986–996. Springer.
- Guo, J., Z. Yu, Z. Ma, D. Xu, and S. Cao. 2022. “What Factors Have Driven Urbanization in China?” Environment, Development and Sustainability 24 (5): 6508–6526.
- Hao, J., J. Zhu, and R. Zhong. 2015. “The Rise of Big Data on Urban Studies and Planning Practices in China: Review and Open Research Issues.” Journal of Urban Management 4 (2): 92–124.
- Healey, P. 1992. “Planning Through Debate: The Communicative Turn in Planning Theory.” The Town Planning Review 63 (2): 143–162.
- Hester, J. B., and R. Gibson. 2003. “The Economy and Second-Level Agenda Setting: A Time-Series Analysis of Economic News and Public Opinion About the Economy.” Journalism & Mass Communication Quarterly 80 (1): 73–90.
- Holt, A. 1999. “Applying Case-Based Reasoning Techniques in GIS.” International Journal of Geographical Information Science 13 (1): 9–25.
- Holt, A. 2000. “Understanding Environmental and Geographical Complexities Through Similarity Matching.” Complexity International 7: 1–16.
- Li, Z. 2021. “Forecast and Simulation of the Public Opinion on the Public Policy Based on the Markov Model.” Complexity 29 (1): 4–18.
- Li, X., E. C. Hui, T. Chen, W. Lang, and Y. Guo. 2019. “From Habitat III to the New Urbanization Agenda in China: Seeing Through the Practices of the “Three old Renewals” in Guangzhou.” Land Use Policy 81: 513–522.
- Li, M., Z. Shen, and X. Hao. 2016. “Revealing the Relationship Between Spatio-Temporal Distribution of Population and Urban Function with Social Media Data.” GeoJournal 81 (6): 919–935.
- Li, G., S. Sun, and C. Fang. 2018. “The Varying Driving Forces of Urban Expansion in China: Insights from a Spatial-Temporal Analysis.” Landscape and Urban Planning 174: 63–77.
- Ligate, E. J., C. Chen, and C. Wu. 2018. “Evaluation of Tropical Coastal Land Cover and Land Use Changes and Their Impacts on Ecosystem Service Values.” Ecosystem Health and Sustainability 4 (8): 188–204.
- Liu, X., J. He, Y. Yao, J. Zhang, H. Liang, H. Wang, and Y. Hong. 2017. “Classifying Urban Land Use by Integrating Remote Sensing and Social Media Data.” International Journal of Geographical Information Science 31 (8): 1675–1696.
- Ma, K., Z. Yu, K. Ji, and B. Yang. 2019. “Stream-based Live Public Opinion Monitoring Approach with Adaptive Probabilistic Topic Model.” Soft Computing 23 (16): 7451–7470.
- Mahdavinejad, M., and M. Amini. 2011. “Public Participation for Sustainable Urban Planning in Case of Iran.” Procedia Engineering 21: 405–413.
- Martí, P., L. Serrano-Estrada, and A. Nolasco-Cirugeda. 2019. “Social Media Data: Challenges, Opportunities and Limitations in Urban Studies.” Computers, Environment and Urban Systems 74: 161–174.
- Rafieian, M., A. Asgary, and Z. Asgarizade. 2009. “Citizen Satisfaction Evaluation of Urban Residential Environment.” Environmental Sciences 7 (1): 57–67.
- Rajendiran, P., and P. Priyadarsini. 2022. “Sentiment Analysis Using Treebank Filtered Preprocess with Relevant Vector Boost Classifier.” Soft Computing 26 (8): 4033–4043.
- Rall, E., R. Hansen, and S. Pauleit. 2019. “The Added Value of Public Participation GIS (PPGIS) for Urban Green Infrastructure Planning.” Urban Forestry & Urban Greening 40: 264–274.
- Shao, Z., N. S. Sumari, A. Portnov, F. Ujoh, W. Musakwa, and P. J. Mandela. 2021. “Urban Sprawl and Its Impact on Sustainable Urban Development: A Combination of Remote Sensing and Social Media Data.” Geo-spatial Information Science 24 (2): 241–255.
- Skoric, M. M., J. Liu, and K. Jaidka. 2020. “Electoral and Public Opinion Forecasts with Social Media Data: A Meta-Analysis.” Information 11 (4): 187.
- Sumari, N. S., P. B. Cobbinah, F. Ujoh, and G. Xu. 2020. “On the Absurdity of Rapid Urbanization: Spatio-Temporal Analysis of Land-use Changes in Morogoro, Tanzania.” Cities 107: 102876.
- Tao, J., and X. Fang. 2020. “Toward Multi-Label Sentiment Analysis: A Transfer Learning Based Approach.” Journal of Big Data 7 (1): 1–26.
- Tien, T.-L. 2012. “A Research on the Grey Prediction Model GM (1, n).” Applied Mathematics and Computation 218 (9): 4903–4916.
- Wenjie, L., H. Cuncai, H. Weiquan, and Z. Fang. 2013. “Gray Prediction Model of Network Public Opinion Events and Analysis of Examples.” Information Science 31 (12): 51–56.
- Wenjing, T., H. Yanling, Z. Yuxin, and L. Ning. 2008. “Research on Areal Feature Matching Algorithm based on Spatial Similarity.” In 2008 Chinese control and Decision Conference, 3326–3330. IEEE.
- Wu, W., and K. Jung. 2016. “A Missing Link Between Citizen Participation, Satisfaction, and Public Performance: Evidences from the City and County of San Francisco.” International Journal of Public Sector Performance Management 2 (4): 392–410.
- Xin, L., S. Xiao Qi, Q. Xiao Ying, and S. Xiao Feng. 2016. “Relevance Vector Machine based EEG Emotion Recognition.” In 2016 Sixth International Conference on Instrumentation & Measurement, Computer, Communication and Control (IMCCC), 293–297. IEEE.
- Xing, Y., J. W. Liu, B. X. Li, M. Zhang, and D. G. Meng. 2011. “Research on Public Participation in Urban Planning.” In Advanced Materials Research, 1333–1337. Trans Tech Publications Ltd.
- Xu, G., T. Dong, P. B. Cobbinah, L. Jiao, N. S. Sumari, B. Chai, and Y. Liu. 2019. “Urban Expansion and Form Changes Across African Cities with a Global Outlook: Spatiotemporal Analysis of Urban Land Densities.” Journal of Cleaner Production 224: 802–810.
- Yang, X.-q., J.-y. Li, T.-c. Lan, and H.-t. Liu. 2008. “Researches on Application of Case-based Reasoning in Decision Science.” Journal of East China Institute of Technology (Natural Science Edition) 31 (2): 187–191.
- Ye, J., and X. Shi. 2001. “Integrating Case-based Reasoning and GIS for Handling Planning Applications.” Urban Planning Forum 133: 34–38+41.
- You, D., and F. Chen. 2016. “The Literature Review About the Prediction of Network Public Opinion in China.” Inf. Sci 12: 158–162.
- Yu, Y., M. Zhang, C. Liu, and B. Si. 2008. “A Study on Public Opinion Evolutionary Model Based on Agent.” Computer Simulation 25 (9): 9–12+42.
- Zeng, J., S. Zhang, C. Wu, and J. Xie. 2007. “Predictive Model for Internet Public Opinion.” In Fourth International Conference on Fuzzy Systems and Knowledge Discovery (FSKD 2007), 7–11. IEEE.
- Zhang, M., R. Zheng, J. Chen, J. Zhu, R. Liu, S. Sun, and Q. Wu. 2019. “Emotional Component Analysis and Forecast Public Opinion on Micro-Blog Posts Based on Maximum Entropy Model.” Cluster Computing 22 (3): 6295–6304.
- Zhang, M.-L., and Z.-H. Zhou. 2007. “ML-KNN: A Lazy Learning Approach to Multi-Label Learning.” Pattern Recognition 40 (7): 2038–2048.