
 ?Mathematical formulae have been encoded as MathML and are displayed in this HTML version using MathJax in order to improve their display. Uncheck the box to turn MathJax off. This feature requires Javascript. Click on a formula to zoom.
ABSTRACT
Super-pixel algorithms based on convolutional neural networks with fuzzy C-means clustering are widely used for high-spatial-resolution remote sensing images segmentation. However, this model requires the number of clusters to be set manually, resulting in a low automation degree due to the complexity of the iterative clustering process. To address this problem, a segmentation method based on a self-learning super-pixel network (SLSP-Net) and modified automatic fuzzy clustering (MAFC) is proposed. SLSP-Net performs feature extraction, non-iterative clustering, and gradient reconstruction. A lightweight feature embedder is adopted for feature extraction, thus expanding the receiving range and generating multi-scale features. Automatic matching is used for non-iterative clustering, and the overfitting of the network model is overcome by adaptively adjusting the gradient weight parameters, providing a better irregular super-pixel neighborhood structure. An optimized density peak algorithm is adopted for MAFC. Based on the obtained super-pixel image, this maximizes the robust decision-making interval, which enhances the automation of regional clustering. Finally, prior entropy fuzzy C-means clustering is applied to optimize the robust decision-making and obtain the final segmentation result. Experimental results show that the proposed model offers reduced experimental complexity and achieves good performance, realizing not only automatic image segmentation, but also good segmentation results.
1 Introduction
Driven by geological research, economic construction, national defense, and other factors, remote sensing earth observation technologies have become highly advanced, and the ability of earth observation systems to acquire data has been greatly improved. High-spatial-resolution remote sensing images (HSRSIs) have been applied to urban planning (Ahmadi et al. Citation2010), urban environmental modeling (Liu et al. Citation2019a), disaster management (Awrangjeb Citation2016), and the monitoring of land-use changes (Li, Huang, and Gong Citation2019) and digital city evolution (Huang et al. Citation2020). Accurate segmentation is the premise and foundation for the extraction, analysis, and interpretation of ground object information, and is also the key to performing data mining and informatization (Pal and Pal Citation1993; Thakur and Nileshsingh Citation2013; Santos and Gosselin Citation2012; Sirmacek and Unsalan Citation2011; Troya-Galvis et al. Citation2015). Accurate segmentation results are of great significance for subsequent steps such as image understanding. In the industrial field, accurate segmentation improves the efficiency and accuracy of industrial production, thereby improving the level of social productivity, such as through character extraction on a workpiece surface or the image segmentation of industrial parts. In the agricultural field, accurate segmentation results have great application potential in crop disease detection and yield prediction. In marine applications, good segmentation results provide effective information for economic development and environmental protection, such as ship extraction and marine oil spill identification.
At present, there are several low-, mid-, and high-level semantic segmentation techniques. Low-level semantic segmentation is good for grayscale image segmentation, but can lead to problems, such as the edges of ground object segmentation results not meeting the requirements or the segmentation producing missing contours and position deviations when segmenting color HSRSIs containing a large amount of ground object information. Among the mid-level semantic segmentation methods, super-pixel segmentation is considered a representative example. Mid-level semantic segmentation includes graph theory-based methods and gradient descent-based methods. The abovementioned approaches optimize the target energy function by cutting or adding edges to generate super-pixel sub-images. This reduces the complexity of subsequent processing. However, spatial information is not considered in these methods, so the segmentation results are fragmented in the case of complex textures and backgrounds. Clustering can effectively merge super-pixel regions, and both K-means clustering (Liu et al. Citation2019b; Sinaga and Yang Citation2020) and fuzzy C-means (FCM) clustering (Liu and Xu Citation2008; Xu, Zhao, and Feng Citation2021) have been applied for this purpose. Because K-means clustering is extremely sensitive to the initial clustering center or membership degree, the merged ground objectives are incomplete. In contrast, FCM divides pixels according to the degree to which each pixel of the image belongs to different regions. Thus, FCM improves the low accuracy of K-means clustering by adding iterations, albeit at the cost of increased computational complexity. Therefore, many scholars have combined the super-pixel and FCM algorithms to optimize the segmentation results. Chen, Li, and Huang (Citation2017) used FCM clustering to merge super-pixel over-segmented regions, resulting in the effective segmentation of target regions and improving the segmentation efficiency of traditional FCM. Lei et al. (Citation2018) used super-pixels to define the multi-scale morphological gradient reconstruction operation, which provided a better local spatial domain for FCM and further improved the algorithm efficiency. However, it is necessary to balance the running efficiency and segmentation accuracy of the algorithm, so Kumar, Fred, and Varghese (Citation2019) developed a super-pixel FCM method with spatial constraints to overcome the impact of uneven spatial information and improve the segmentation accuracy of the model. Wang et al. (Citation2020) proposed an FCM method based on morphological reconstruction that weights the target and suppressed noise through morphological reconstruction and band conversion. Jia et al. (Citation2020) proposed a robust self-sparse fuzzy clustering algorithm (RSSFCA) for image segmentation. RSSFCA solves the problems of outlier sensitivity and over-segmentation of ground object categories, and obtains satisfying segmentation results at relatively low computational cost. Super-pixel pre-segmentation can be used to effectively reduce the burden of image processing and accelerate segmentation, but it is difficult to maintain the accuracy of ground object clustering, that is, it is difficult to find a balance between spatial information and computational cost (Jia and Zhang Citation2014; Ji et al. Citation2014; Gu et al. Citation2018; Wang et al. Citation2019; Himabindhu and Anusha Citation2020).
High-level semantic segmentation can effectively extract low-, mid-, and high-level semantic information from images, and aids pixel classification through classifiers such as convolutional neural networks (CNNs) (Suzuki Citation2020), recurrent neural networks (RNNs) (Zhang, Wang, and Liu Citation2014), and generative adversarial networks (GANs) (Goodfellow et al. Citation2014). CNNs achieve feature extraction through multiple convolution and pooling operations, gradually transforming low-level rough features into high-level fine features. The high-level features are then segmented when passing through the fully connected and output layers. Compared with RNNs and GANs, CNNs have a more stable structure and offer greatly improved performance. Jampani et al. (Citation2018) proposed a super-pixel sampling network (SSN) model that improves accuracy by clarifying the segmentation criteria. Tu et al. (Citation2018) proposed a super-pixel model based on subdivision loss, which effectively preserves the boundary of ground objects better than traditional CNNs by improving the loss function. Suzuki (Citation2020) developed an improved CNN model by optimizing the random initialization method, adaptively changing the number of super-pixels, and improving the running efficiency. Yang et al. (Citation2020) used a full convolution network (FCN) to segment images. Their model adjusts the weights of the color and distance of ground objects, thus achieving more flexibility and regularity. Although these studies have improved CNN-based super-pixel models and obtained better segmentation results than previous super-pixel algorithms, they rely on a large number of manually labeled samples to supervise the training. Manual labeling is time-consuming and laborious in the case of large-scale and multi-target high-resolution remote sensing images, and greatly reduces the flexibility and automation of the network model.
Although many HSRSI segmentation algorithms have been proposed, there is still no unified framework that can achieve segmentation quickly and effectively. The complexity of HSRSIs and the lack of simple linear features make automatic segmentation somewhat difficult. First, image segmentation is a multi-solution problem; that is, there are multiple segmentation methods for any given image. Second, compared with mid- and low-resolution remote sensing images, the contours and shape information of ground objects are clearer and have even more diverse spatial relationships, which increases the segmentation difficulty. Therefore, a general segmentation framework for complex HSRSIs remains a challenging task.
To effectively preserve the segmentation accuracy of FCM and improve the automation of CNN models, a segmentation method based on a self-learning super-pixel network (SLSP-Net) combined with modified automatic fuzzy clustering (MAFC) is proposed in this paper. First, a lightweight feature embedding regulator is adopted in SLSP-Net to generate ground features, and non-iterative clustering and gradient reconstruction are used to automatically allocate the clustered pixels to obtain super-pixel over-segmented images. The density peak (DP) clustering algorithm is then optimized in MAFC as a means of reducing the similarity matrix and obtaining the robust decision-making (RDM) image. Finally, FCM clustering based on prior entropy (PE-FCM) is used to improve the RDM image, thus obtaining the final segmentation results. The main innovations of the proposed method are as follows:
SLSP-Net generates super-pixels through self-learning of feature extraction, non-iterative clustering, and gradient reconstruction modules, which improves the automation of the overall network model.
The super-pixel information is fused into the fuzzy clustering algorithm, which improves the efficiency of the algorithm and provides an effective neighborhood spatial structure for MAFC.
MAFC combines the effective spatial structure and prior entropy information of the image, which creates better merging of regions in complex backgrounds and helps to achieve accurate segmentation.
The remainder of this paper is organized as follows. Section 2 describes the proposed SLSP-Net over-segmentation method and the MAFC merger algorithm. In Section 3, the proposed method is applied to image segmentation tasks and its superiority over existing methods is evaluated. Section 4 discusses the results in the context of the state-of-the-art. Finally, Section 5 presents the conclusions from this study and identifies possible future directions of study.
2 Methods
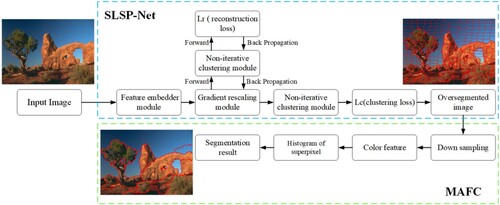
The segmentation method proposed in this paper adopts SLSP-Net to over-segment the image through feature extraction, non-iterative clustering, and gradient reconstruction. The MAFC model is used to cluster the over-segmented results, where super-pixels are introduced into the DP algorithm to produce the RDM image, and then PE-FCM is used to improve the RDM image and obtain the final segmentation results. The overall process is shown in .
Figure 1. Illustration of the workflow for the proposed model. The super-pixel over-segmentation algorithm SLSP-Net is indicated by the upper blue dashed frame. The cluster merging MAFC algorithm is indicated by the lower green dashed frame.
2.1. SLSP-Net
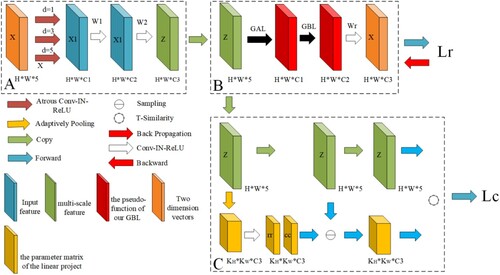
SLSP-Net includes feature extraction, non-iterative clustering, and gradient reconstruction modules. Specifically, the feature extraction module embeds the original features into adjacent clusters, before the non-iterative clustering module assigns labels to pixels through seeds and automatically calculates the index of the seed nodes. Finally, the gradient reconstruction module adaptively adjusts the gradient of each weight parameter according to the spatial context, as shown in .
Figure 2. Illustration of the workflow for the proposed SLSP-Net. The model includes a feature extraction module (A), a non-iterative clustering module (B), and a gradient reconstruction module (C). Lr is the clustering loss; Lc is the reconstruction loss.
2.1.1. Feature extraction module
To improve the running efficiency of the super-pixel convolutional network and reduce redundancy, two convolution layers and atrous spatial pyramid pooling (ASPP) are employed to expand the receiving range and better preserve the details of ground objects. As shown in (A), color features and pixel positions are integrated into the ASPP structure to obtain multi-scale information:
(1)
(1) where * is the convolution operator,
is the input feature,
is a multi-scale feature,
is the convolution with an extended range of d, and
is the ReLU activation function. Two 3×3 convolutions are embedded into the multi-scale features
:
(2)
(2) where
is the clustering feature and
,
are the parameter matrices.
2.1.2. Non-iterative clustering module
The extracted cluster feature Z is combined with the initial clustering center to obtain the super-pixel image. This process needs to be iterated, which takes a lot of time. To improve the running efficiency, the seed estimation layer (SEL) is adopted in the non-iterative clustering module to obtain the cluster center distribution S by learning the offset, and the seeds are moved to a reasonable position according to the center offset, as shown in (C). By constraining the uniformity
within the super-pixel (see Eq. (3)), Z adaptively calculates the cluster constrained parameters (se Eq. (4)), giving the distance clustering image M.
(3)
(3)
(4)
(4) where
and
are the distances from pixel i to adjacent pixel j and cluster center S, respectively;
and
are parameters;
is the gradient distance from pixel i to center S. M is fused to low resolution.
, where K is the number of target super-pixels. The S-type activation function is used to calculate the offset of the two-dimensional vector
according to
(5)
(5) where
is the parameter matrix, F = {rr, cc} are the two dimensions, rr is the lateral displacement ratio, and cc is the longitudinal displacement ratio.
2.1.3. Gradient reconstruction module
To overcome model over-fitting, a gradient reconstruction method is proposed. First, the gradient adaptive layer (GAL) perceives the weight of the gradient in different feature channels to avoid over-fitting. Second, the gradient bidirectional layer (GBL) generates confrontation through the spatial context to improve robustness.
First, the GAL reconstructs the original input features (including spatial features and color features) according to
(6)
(6) where
are the reconstruction features (mainly color features and spatial features) and
are the parameters of linear items.
The GAL readjusts the gradient of the weight parameters to avoid over-fitting. Although the GAL can avoid over-fitting by recording the intensity of channels, it does not consider the spatial context of pixels. Therefore, the GBL readjusts the gradients based on spatial context to avoid over-fitting. The forward and backward propagation of the GBL can be described as
(7)
(7) where
is a pseudo-function of the GBL.
is the derivative of
with respect to
. The GBL performs image mapping in the forward propagation stage. In the back propagation step, the GBL generates bidirectional gradients based on contour images of different pixels n based on their contour map Bn.
2.1.4. Loss functions
The overall loss function consists of two parts, the clustering loss and the reconstruction loss. The clustering loss Lc is expressed as
(8)
(8) where
is the regular term,
is the probability that pixels are assigned to seed points, i is the pixel point, and k is the seed point. This can be formulated as a regularized Kullback–Leibler divergence between the limited-range soft assignment
with its reference distribution
. The reconstruction loss Lr is a key means of adjusting the weight parameters according to gradient reconstruction. By reconstructing the color and spatial features of the input image, Lr is given by
(9)
(9) where
is the reconstruction loss of color features,
is the reconstruction loss of spatial features, and
controls the weights of
and
. However, as the gradient is reconstructed as a bidirectional gradient, Lr can be written as
(10)
(10) where
is the number of pixel sets and
is a regularization term to avoid over-reliance on the spatial characteristics of pixels in
during the clustering process. Finally, the loss functions in the proposed method are
(11)
(11) where β balances the two loss functions.
2.2. MAFC
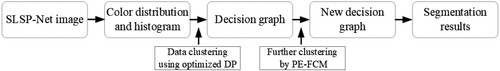
MAFC is combined with SLSP-Net to obtain the over-segmented image. First, the DP algorithm is optimized and the similarity matrix is reduced. Then, decision-making images are generated and the data redundancy is reduced, which improves the operation speed. Finally, PE-FCM is used to achieve the final image segmentation, as shown in .
Figure 3. Illustration of the MAFC workflow.
2.2.1. Optimized DP algorithm
The DP algorithm selects the number of clusters according to the decision images, but produces a huge similarity matrix. This leads to poor efficiency and ignores the spatial information of the images. Therefore, an optimized DP algorithm is proposed in which the local density is expressed as
(12)
(12) where
is the total number of samples in the dataset, SJ is the total number of pixels in the j-th super-pixel area, dc is the distance between ground objects, and DIJ is the Euclidean distance between
and
. The optimized DP algorithm maps the original clustering image rj to a new clustering image
, and the decision conditions
are calculated according to Eq. (13). According to the conditions of Eq. (14), a new clustering image is obtained using Eq. (15):
(13)
(13)
(14)
(14)
(15)
(15) where
is the clustering condition,
is the clustering interval,
is the normalized result, and
is the new clustering image.
2.2.2. PE-FCM
By analyzing the clustering images obtained by the optimized DP algorithm, it is concluded that the integration of regional similarities among ground objects could lead to incomplete integration of the ground objects. Therefore, a PE-FCM algorithm is proposed. The objective function of the proposed method is as follows:
(16)
(16) where
is the average value of the super-pixel area
;
is the covariance matrix of variable dimensions;
denotes K-means clustering;
is the prior probability of the super-pixel region of
in
; and
is the membership degree of each super-pixel. By considering a Gaussian distribution and Gaussian density function,
in Eq. (17) can be written as
(17)
(17) Note that
and
are both constants.
is the super-pixel area. Therefore, according to Eq. (17), the objective function can be improved to
(18)
(18) Equation (18) uses the derivatives of πk, vk, and ukl. As these terms are all constant, their derivatives are identically 0, which leads to the following:
(19)
(19)
(20)
(20)
(21)
(21)
According to Eqs. (19)–(21), PE-FCM integrates the neighborhood information of the prior probability distribution and the distribution characteristics of the image, and accurately merges the ground objects to obtain the final segmented image.
3. Results
3.1. Dataset
At present, there is no published dataset for the edge segmentation of high-resolution remote sensing images, and all published datasets are of natural scenery. Therefore, in addition to using the BSDS500 dataset containing 500 images (Arbeláez et al. Citation2011), 200 images were manually constructed for the experiments. The self-made images had a size of 500×500 pixels. Datasets for our experiments were composed of 280 training, 140 validation, and 280 test images, with each image labeled by multiple annotators.
To verify the effectiveness of the proposed method, four types of widely used high-resolution remote sensing images were considered, and experiments were conducted across three groups with a total of 11 scenes. The images include UAV aerial remote sensing images (UAV), the WuHan building dataset (WHU) (Ji, Wei, and Lu Citation2018), the Object Detection in Aerial Images dataset (DOTA) (Xia et al. Citation2018), and domestic autonomous satellite images from Gaofen-2 (GF-2), obtained from the China Center for Resource Satellite Data and Applications (CRESDA). Detailed information about the datasets is presented in and , and reference images are shown in .
Figure 4. Original remote sensing images.
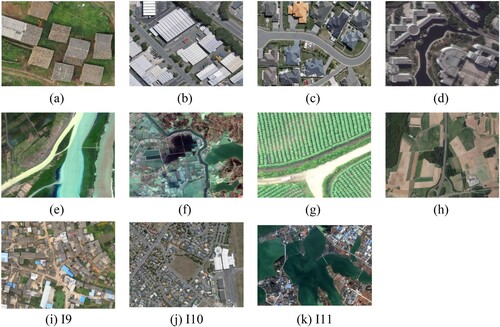
Figure 5. Reference images corresponding to original remote sensing images.
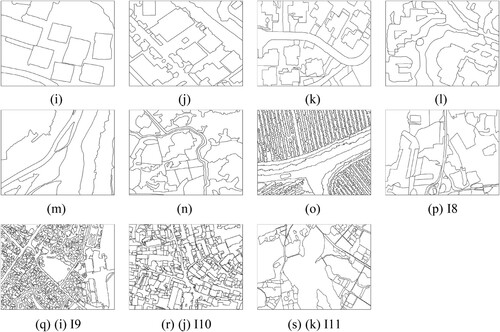
Table 1. Information about segmentation datasets.
As shown in , the 11 images include common ground objects such as buildings, roads, low vegetation, trees, water bodies, cultivated land, and bare land. The details of the ground objects are clear, although their types are complicated and the distribution is dense and uneven. There is considerable image noise and redundancy, which conforms to the characteristics of HSRSIs and introduces significant challenges for accurate and rapid segmentation.
The first data group contains dense areas of buildings, including rural tile-roofed houses, urban residential houses, factories, office buildings and complex buildings. The building materials are diverse, the roof color characteristics are rich, and the shapes are very different. Moreover, in image I4, parts of the buildings are rendered in 3D stereo. Due to the shooting angle and illumination, the target textures and geometric information are relatively rich, and the differences between classes such as buildings, water bodies, and shadows are relatively small.
The second data group covers mixed areas of water body, cultivated land, and vegetation. The intraclass variance is lower than in the first group, but there are more types of ground objects, such as paddy fields, irrigated land, cultivated land, fallow land, and bare land. The internal texture distribution is rich and the boundaries are fuzzy.
The third data group covers mixed areas of ground objects. The spatial relationships among the ground objects are more chaotic, the adjacency relationships are more complex, and the scales of the ground objects are highly variable. For instance, there are long and narrow winding rivers and roads, vast and calm oceans, regular houses and terraces, and irregular cultivated land and vegetation.
3.2 Accuracy evaluation
To verify the accuracy of the experimental results, qualitative and quantitative methods are applied. The qualitative analysis compares the boundary adhesion, shape heterogeneity, and the over- and under-segmentation of the resulting images. The quantitative analysis uses nine evaluation indicators to compare and analyze the segmentation algorithms considered in this paper (see ). These are divided into super-pixel over-segmentation evaluation indicators (UE, ASA, and BR) and cluster-merge evaluation indicators (Ru, Ps, Pr, Re, DC, and JS). The actual boundaries of the ground objects are obtained by visual interpretation, as shown in .
Table 2. Different quantitative evaluation indicators at two segmentation stages.
where BR is used to measure the coincidence degree between the super-pixel segmentation boundary and the real ground boundary; ASA is the upper limit of the achievable target segmentation accuracy; and UE is the under-segmentation error rate, which evaluates the quality of the segmentation boundary by punishing super-pixels with a plurality of overlapping objects. Ru is the regional gray consistency; Ps is the peak signal-to-noise ratio; B and C are the regional gray variance and regional binary variance, respectively; MSE is the root mean square error; Pr is the segmentation accuracy (Shen et al. Citation2020); and Re is the boundary recall rate (Hou et al. Citation2020). TP is the number of result pixels for which the ground object is correctly segmented; FP is the number of segmentation result for which the background pixels are divided into ground object pixels; and FN is the number of samples divided into background pixels. DC is the similarity index (Milletari, Navab, and Ahmadi Citation2016) and JS evaluates the region quality (Goh et al. Citation2021).
The experiments were performed on a Windows 10 platform with an Intel(R) Core(TM) i7-10,700 2.9 GHz CPU and 16 GB RAM. All algorithms and experimental evaluations were implemented in PyTorch and Matlab2018b.
3.3. Analysis of results
To verify the effectiveness of the proposed method, simple linear iterative clustering (SLIC) (Achanta et al. Citation2012), linear spectral clustering (LSC) (Chen, Li, and Huang Citation2017), and multiscale morphological gradient reconstruction-based watershed (MGW) (Zhang and Zhang Citation2017) are selected for comparative analysis with regard to the over-segmentation performance of SLSP-Net. The adaptive morphological reconstruction and watershed algorithm (SAW) (Lei et al. Citation2019), Sobel adaptive morphological reconstruction and watershed algorithm (SoAW) (Huang, Cao, and Li Citation2020), super-pixel-based fast FCM (SFFCM) (Lei et al. Citation2018), automatic fuzzy clustering framework (AFCF) (Lei et al. Citation2020), robust self-sparse fuzzy clustering algorithm (RSSFCA) (Jia et al. Citation2020), and super-pixel segmentation with fully convolutional network (S-SFM) (Yang et al. Citation2020) are selected for comparison in terms of full-segmentation performance. Details of these algorithms are presented in .
Table 3. Information of segmentation algorithms at two segmentation stages
3.3.1. Test results for super-pixel over-segmentation
SLIC, LSC, MGW, and the proposed SLSP-Net method were used to segment the original images, as shown in . When the texture spectrum and color information between buildings are similar, MGW struggles to distinguish complex ground objects, and the boundary adhesion rate is not high. The proposed method, LSC, and SLIC provide better expressions of the texture spectral information between objects, resulting in better attachment of the object boundaries.
Figure 6. Group 1 super-pixel segmentation results.
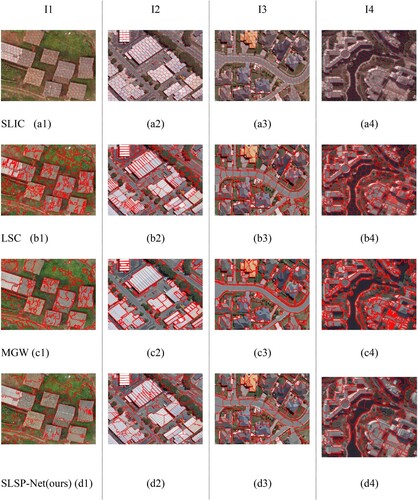
Figure 7. Group 2 super-pixel segmentation results.
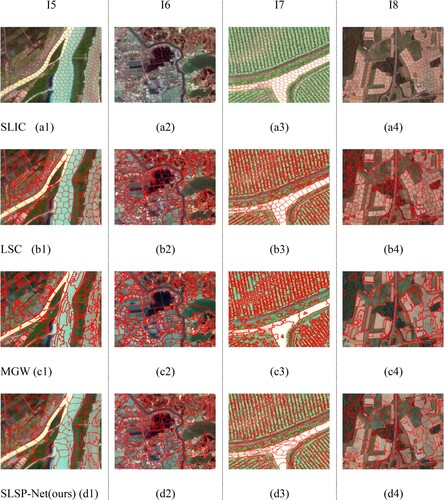
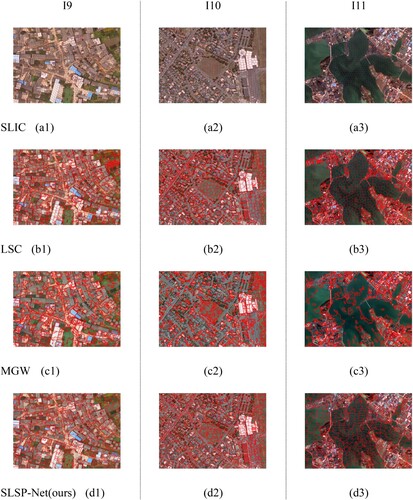
Figure 8. Group 3 super-pixel segmentation results.
To determine the most effective over-segmentation method, we consider the BR, ASA, UE, and Time indices. The results are given in .
Table 4. Segmentation accuracy (BR, ASA, UE, Time) of four over-segmentation algorithms (SLIC, LSC, MGW, SLSP-Net). The best values are in bold.
According to , SLSP-Net and SLIC are the least time-consuming and most efficient methods among the four considered in this experiment. In terms of BR, ASA, and UE, SLSP-Net is superior to the other three methods, mainly because of the high adhesion rate of ground objects. Based on the above analysis, the over-segmentation method proposed in this paper achieves high efficiency and good boundary preservation, and thus provides better pre-segmentation images for later segmentation and merging.
3.3.2. Test results for full-segmentation
The SAW, SoAW, SFFCM, AFCF, RSSFCA, S-SFM, and SLSP-Net methods were used to segment images in three experiments. The results are shown in . Furthermore, the Ru, Ps, Pr, and Re metrics were used to evaluate the segmentation results. The evaluation results are summarized in .
Figure 9. Comparison of experiment 1 segmentation results.
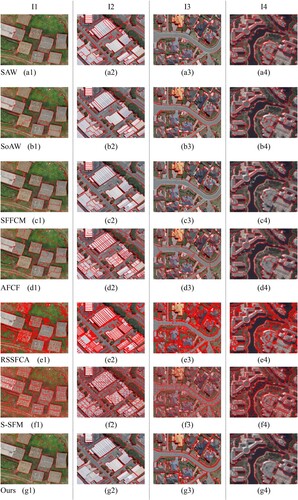
Figure 10. Comparison of experiment 2 segmentation results.
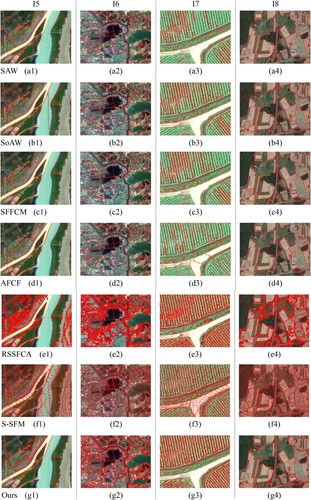
Figure 11. Comparison of experiment 3 segmentation results.
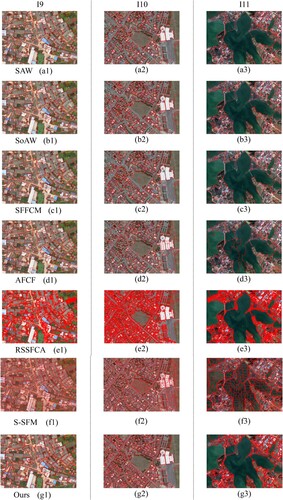
Table 5. Comparison of different indices (Ru, Ps, Pr, Re, DC, JS) for experiment 1 based on seven full-segmentation algorithms (SAW, SoAW, SFFCM, AFCF, RSSFCA, S-SFM, SLSP-Net). Larger values are better. The best values are indicated in bold.
Table 6. Comparison of different indices (Ru, Ps, Pr, Re, DC, JS) for experiment 2 based on seven full-segmentation algorithms (SAW, SoAW, SFFCM, AFCF, RSSFCA, S-SFM, SLSP-Net). Larger values are better. The best values are indicated in bold.
Table 7. Comparison of different indices (Ru, Ps, Pr, Re, DC, JS) for experiment 3 based on seven full-segmentation algorithms (SAW, SoAW, SFFCM, AFCF, RSSFCA, S-SFM, SLSP-Net). Larger values are better. The best values are indicated in bold.
3.3.2.1 Test results from experiment 1
(1) Qualitative Evaluation
shows the segmentation results for the first group of experimental images. This group of images mainly shows dense building areas with complex building types and sizes, rich roof colors, and diverse texture structures. Such objects are easily confused with surrounding objects, which increases the difficulty of segmentation.
According to images I1 and I3, S-SFM and RSSFCA produce serious over-segmentation and poor boundary adhesion; the segmentation shapes given by SAW, SoAW, SFFCM, and AFCF are regular and complete, but the segmentation patches are broken where the over-segmentation problem has not been well solved. The proposed method retains small blocks such as houses and green spaces completely, and yet the buildings are still accurately segmented.
According to images I2 and I4, the segmentation patches produced by AFCF, RSSFCA, and S-SFM have different sizes and shapes. Although the main building boundaries fit the segmentation boundaries well, serious over-segmentation can be observed. SAW, SoAW, and SFFCM produce serious under-segmentation and over-merging of super-pixel regions, and the segmentation produces irregular rectangles. Some positions with fuzzy boundaries are also merged incorrectly. The segmentation effect of SLSP-Net is good, with the building boundaries fitting the segmentation boundaries well; however, there are some instances where roads and buildings are merged incorrectly.
(2) Quantitative Evaluation
According to the segmentation evaluation results in , S-SFM and RSSFCA perform poorly because of their serious over-segmentation. SAW and SoAW combine built and non-built areas incorrectly, and do not improve the over-segmentation of vegetation. The segmentation of buildings by SFFCM and AFCF contains numerous noise points and the boundaries of ground object segmentation are obviously offset, but the roads have been merged quite well. Compared with the other algorithms, the proposed SLSP-Net obtains the best experimental results, demonstrating its superior performance in terms of ground object segmentation. The segmentation effect is best in experiment I1, mainly because the internal spectral details of ground objects in image I1 are simple, the boundaries are obvious, and the contours are simple, which makes it easy to distinguish different objects.
3.3.2.2 Test results from experiment 2
(1) Qualitative Evaluation
shows the segmentation results for the second group of experimental images. This group of images mainly shows vegetation and water bodies, where the intraclass variance is relatively low and there are more types of ground objects than in experiment 1, such as paddy fields, irrigated land, cultivated land, fallow land, and bare land. For these ground types, the internal texture distribution is rich and the boundaries are fuzzy.
Images I5 and I6 mainly cover water bodies and grassland. AFCF and S-SFM produce a large number of noise points when segmenting such ground types, which worsens the overall segmentation effect. The segmentations given by RSSFCA, SAW, SoAW, and AFCF result in fragmented water and vegetation areas exhibiting irregular rectangles, and areas with dense ground objects have been mistakenly merged. The SLSP-Net method improves the over-segmentation effect, and so the size and shape of the segmented objects are more consistent than those of the reference images. However, there are still some mis-segmentations in individual positions, such as water bodies and vegetation.
Images I7 and I8 mainly cover farmland. S-SFM and RSSFCA exhibit high adhesion to ground objects, but produce serious over-segmentation. For SAW, SoAW, and SFFCM, many segmentation errors occur because the spectra of grassland boundary areas and farmland are similar, resulting in low accuracy. AFCF suffers from a serious under-segmentation problem and the over-merging of super-pixel regions. Although the proposed method produces some errors, the fragmentation of the segmentation effect has been improved to a certain extent, which is more in line with the visual effect of segmentation.
(2) Quantitative Evaluation
Compared with the segmentation results of experiment 1, all four index values are slightly lower for experiment 2. This is mainly because of the diversification of ground object types. Although ground objects of the same kinds in different periods and different functions are extremely similar, they have slightly different spectral, texture, and spatial characteristics. Additionally, the heterogeneity within the class is further increased, and the texture structures are more complex, so the segmentation is more difficult. In summary, compared with other experimental methods, SLSP-Net achieves the highest Pr, Ru, Ps, and Re values, demonstrating the applicability of the proposed method.
3.3.2.3 Test results from experiment 3
(1) Qualitative Evaluation
shows the third set of data covering a mixed area of ground objects. Compared with the images in experiments 1 and 2, the spatial relationships among the ground objects are more chaotic, the adjacency relationships are more complex, and the scales of the ground objects are more variable. RSSFCA and AFCF produce a large amount of over-segmentation. Because of the low spectral heterogeneity of buildings in the segmented area, it is difficult to distinguish buildings with similar spectra, resulting in over-segmentation. Compared with RSSFCA and AFCF, the segmentation regions obtained by SAW, SoAW, S-SFM, and SFFCM are closed and independent of each other, and the segmentation accuracy is further improved. However, the problem of image over-segmentation has not been well solved. In particular, changes in light and shade around buildings due to uneven illumination results in over-segmentation. The proposed SLSP-Net method is better able to distinguish houses from roads, and preserves small areas such as houses and green spaces relatively well. However, there are also some shortcomings, such as high sensitivity to the spectral characteristics of water, which produces a small number of segmentation fragments. SLSP-Net effectively solves the problem of mis-segmentation caused by the phenomenon of ‘different objects with the same spectrum and different spectra from the same objects,’ and further improves the segmentation accuracy compared with the other six methods considered in this experiment.
In general, the proposed algorithm takes the uncertainty of homogeneous region features into account, and enhances the expression of uncertainty of pixel categories, thus optimizing the boundary segmentation effect. This ensures greater accuracy of the segmentation results, and makes the size and shape of ground object segmentation more consistent with the reference images.
(2) Quantitative Evaluation
As can be seen in , when the map width, ground object type, spatial distribution, image resolution, and contour complexity increase at the same time, SAW and SoAW both give poor segmentation accuracy. SFFCM, AFCF, RSSFCA, and S-SFM produce stable results, but are greatly impacted by ground objects. In summary, the evaluation indices for the three groups of experimental images decrease as the segmentation difficulty increases. However, compared with other algorithms, the proposed method maintains higher values of these evaluation metrics. From the above analysis, it can be concluded that the visual effect of segmentation results is consistent with the experimental indices, and the segmentation effect and accuracy of SLSP-Net combined with MAFC are better than those of existing techniques.
4 Discussion
A segmentation method has been proposed based on a self-learning super-pixel network and modified automatic fuzzy clustering. Both the visual impression and quantitative results demonstrate that our proposed method generates better super-pixels than existing methods and has a relatively high degree of automation.
SLSP-Net has better generalizability with much less complexity, achieving the best BR, ASA, UE, and runtime results across a series of experiments. This fully proves the applicability of the proposed method (see ). However, there are still some drawbacks to our SLSP-Net method. Due to the sequential training strategy, our model cannot achieve complete convergence, unlike other learning-based methods. This leads to the existence of trivial regions in the super-pixels generated by SLSP-Net, which require post-processing to remove. SLSP-Net uses a lightweight convolutional network and achieves real-time segmentation using a GPU, but the computational load is still high. Therefore, the next step is to merge the super-pixels.
MAFC has the ability to resist noise and effectively merge super-pixels. and (g1–g4) show good area characteristics due to the employment of MAFC. (g1–g4) shows that S-SFM and our proposed method obtain similarly good segmentation results close to expectations, but the latter provides more accurate details than the former. To illustrate these experimental results further, compare the performance of different algorithms. We can see that our proposed method obtains the best performance indices. Therefore, the proposed approach can further improve the accuracy of HSRSI segmentation and play an important role in developing of automatic HSRSI segmentation.
5 Conclusion
To address the problems of an insufficient degree of automation in CNN-based super-pixel models and low FCM clustering accuracy, a method that combines SLSP-Net with MAFC has been described in this paper. First, SLSP-Net accurately retains the boundaries of ground objects and obtains over-segmentation results through feature extraction, non-iterative clustering, and gradient reconstruction. Second, an optimized DP method and PE-FCM are incorporated into MAFC to further improve the accuracy of the segmented images. This allows the clustering blocks to be obtained automatically and the over-segmented regions be merged effectively. Experimental results show that, compared with other methods, the proposed approach accurately segments small ground objects and achieves the highest level of accuracy. Moreover, it reduces the experimental complexity and exhibits good all-round performance.
However, due to the color and texture characteristics commonly encountered in super-pixel regions, the morphological features of the images are ignored. Therefore, future work will focus on the inclusion of morphological features in the MAFC model to achieve high-precision automatic image segmentation.
Author contributions
Acquisition of the financial support for the project leading to this publication, H.N. and L.F. Application of statistical, mathematical, computational, or other formal techniques to analyze or synthesize study data,, Z.Y., L.H., D.X. and X.W. Preparation, creation, and/or presentation of the published work by those from the original research group, specifically critical review, commentary, or revision, including pre- or post-publication stages, H.N., L.F., and Z.Y.
Data availability statement
The code used in this study are available by contacting the corresponding author.
Disclosure statement
No potential conflict of interest was reported by the author(s).
Additional information
Funding
Notes on contributors
Zenan Yang
Zenan Yang (Z.Y.) [email protected] School of Surveying and Land Information Engineering, Henan Polytechnic University, Jiaozuo, 454005, Henan, China.; Research Centre of Arable Land Protection and Urban-rural High-quality Development of of Yellow River Basin, Jiaozuo 454003, Henan, China.
Haipeng Niu
Haipeng Niu (H.N.) [email protected] School of Surveying and Land Information Engineering, Henan Polytechnic University, Jiaozuo, 454005, Henan, China.; Research Centre of Arable Land Protection and Urban-rural High-quality Development of of Yellow River Basin, Jiaozuo 454003, Henan, China.
Liang Huang
Liang Huang (L.H.) [email protected] Faculty of Land Resources Engineering, Kunming University of Science and Technology, Kunming, 650093, Yunnan, China.; Surveying and Mapping Geo-Informatics Technology Research Center on Plateau Mountains of Yunnan Higher Education, Kunming, 650093,Yunnan, China.
Xiaoxuan Wang
Xiaoxuan Wang (X.W.) [email protected] Key Laboratory of Spatio-Temporal Information and Ecological Restoration of Mines of Natural Resources of the People's Republic of China, Henan Polytechnic University, Jiaozuo 454003,Henan, China.
Liangxin Fan
Liangxin Fan (L.F.) [email protected] School of Surveying and Land Information Engineering, Henan Polytechnic University, Jiaozuo, 454005, Henan, China.; Research Centre of Arable Land Protection and Urban-rural High-quality Development of of Yellow River Basin, Jiaozuo 454003, Henan, China.
Dongyang Xiao
Dongyang Xiao (D.X.) [email protected] School of Surveying and Land Information Engineering, Henan Polytechnic University, Jiaozuo, 454005, Henan, China.; Research Centre of Arable Land Protection and Urban-rural High-quality Development of of Yellow River Basin, Jiaozuo 454003, Henan, China.
References
- Achanta, R., A. Shaji, K. Smith, A. Lucchi, P. Fua, and S. Süsstrunk. 2012. “SLIC Superpixels Compared to State-of-the-art Superpixel Methods.” IEEE Transactions on Pattern Analysis and Machine Intelligence 34: 2274–2282.
- Ahmadi, S., M. Zoej, H. Ebadi, and A. Mohammadzadeh. 2010. “Automatic Urban Building Boundary Extraction from High Resolution Aerial Images Using an Innovative Model of Active Contours.” International Journal of Applied Earth Observations & Geoinformation 12: 150–157.
- Arbeláez, P., M. Maire, C. Fowlkes, and J. Malik. 2011. “Contour Detection and Hierarchical Image Segmentation.” Pattern Analysis and Machine Intelligence, IEEE Transactions on 33: 898–916.
- Awrangjeb, M. 2016. “Using Point Cloud Data to Identify, Trace, and Regularize the Outlines of Buildings.” International Journal of Remote Sensing 37: 551–579.
- Chen, J., Z. Li, and B. Huang. 2017. “Linear Spectral Clustering Superpixel.” IEEE Transactions on Image Processing 26: 3317–3330.
- Goh, K. L., G. W. Ng, M. Hamzah, and S. S. Chai. 2021. “Sizes of Superpixels and Their Effect on Interactive Segmentation.” 2021 IEEE International Conference on Artificial Intelligence in Engineering and Technology (IICAIET), 1–5. doi:10.1109/IICAIET51634.2021.9573623.
- Goodfellow, I. , J. Pouget-Abadie, M. Mirza, B. Xu, D. Warde-Farley, S. Ozair, and Y. Bengio. 2014. “Generative Adversarial Nets.” In Advances in Neural Information Processing Systems, 2672–2680. Cambridge: The MIT Press. doi:10.1145/3422622. Source: arXiv.
- Gu, J., L. Jiao, S. Yang, and F. Liu. 2018. “Fuzzy Double c-Means Clustering Based on Sparse Self-Representation.” IEEE Transactions on Fuzzy Systems 26: 612–626.
- Himabindhu, J., and V. S. Anusha. 2020. “Color Image Segmentation Using Superpixel-Based Fast FCM.” ICCCE 2020, Proceedings of the 3rd International Conference on Communications and Cyber Physical Engineering, 385–391. doi:10.1007/978-981-15-7961-5_38.
- Hou, M., J. Yin, J. Ge, Y. Li, and Q. Feng. 2020. “Land Cover Remote Sensing Classification Method of Alpine Wetland Region Based on Random Forest Algorithm.” Transactions of the Chinese Society for Agricultural Machinery 51: 220–227.
- Huang, X., Y. Cao, and J. Li. 2020. “An Automatic Change Detection Method for Monitoring Newly Constructed Building Areas Using Time-Series Multi-View High-Resolution Optical Satellite Images.” Remote Sensing of Environment 244: 111802.
- Huang, L., B. Yao, P. Chen, A. Ren, and Y. Xia. 2020. “Superpixel Segmentation Method of High Resolution Remote Sensing Images Based on Hierarchical Clustering.” J.Infrared Millim.Waves 39: 263–272.
- Jampani, V., D. Sun, M. Liu, M. Yang, and J. Kautz. 2018. “Superpixel Sampling Networks.” Computer Vision and Pattern Recognition.(Springer, Cham) 11211: 352–368.
- Jia, X., T. Lei, X. Du, S. Liu, and A. K. Nandi. 2020. “Robust Self-Sparse Fuzzy Clustering for Image Segmentation.” IEEE Access 8: 146182–146195.
- Ji, S., S. Wei, and M. Lu. 2018. “Fully Convolutional Networks for Multi-Source Building Extraction from An Open Aerial and Satellite Imagery Dataset.” IEEE Transactions on Geoscience and Remote Sensing 57: 574–586.
- Ji, S., B. Wei, Z. Yu, G. Yang, and Y. Yin. 2014. “A new Multistage Medical Segmentation Method Based on Superpixel and Fuzzy Clustering.” Computational and Mathematical Methods in Medicine 2014: 747549.
- Jia, S., and C. Zhang. 2014. “Fast and Robust Image Segmentation Using an Superpixel Based FCM Algorithm.” 2014 IEEE International Conference on Image Processing(ICIP) 29: 947–951.
- Kumar, S. N., A. L. Fred, and P. S. Varghese. 2019. “Suspicious Lesion Segmentation on Brain, Mammograms and Breast MR Images Using New Optimized Spatial Feature Based Super-Pixel Fuzzy C-Means Clustering.” Journal of Digital Imaging 32: 322–335.
- Lei, T., X. Jia, T. Liu, S. Liu, H. Meng, and A. K. Nandi. 2019. “Adaptive Morphological Reconstruction for Seeded Image Segmentation.” IEEE Transactions on Image Processing 28: 5510–5523.
- Lei, T., X. Jia, Y. Zhang, S. Liu, H. Meng, and A. K. Nandi. 2018. “Superpixel Based Fast Fuzzy c-Means Clustering for Color Image Segmentation.” Fuzzy Systems, IEEE Transactions on 27: 1753–1766.
- Lei, T., P. Liu, X. Jia, H. Meng, and A. K. Nandi. 2020. “Automatic Fuzzy Clustering Framework for Image Segmentation.” IEEE Transactions on Fuzzy Systems 28: 2078–2092.
- Li, Z., and J. Chen. 2015. “Superpixel Segmentation Using Linear Spectral Clustering.” 2015 IEEE Conference on Computer Vision and Pattern Recognition (CVPR), 1356–1363. doi:10.1109/CVPR.2015.7298741.
- Li, J., X. Huang, and J. Gong. 2019. “Deep Neural Network for Remote Sensing Image Interpretation: Status and Perspectives.” National Science Review 6: 1082–1086.
- Liu, C., X. Huang, Z. Zhu, H. Chen, X. Tang, and J. Gong. 2019a. “Automatic Extraction of Built-up Area from ZY3 Multi-View Satellite Imagery: Analysis of 45 Global Cities.” Remote Sens. Environ 226: 51–73.
- Liu, J., and M. Xu. 2008. “Kernelized Fuzzy Attribute C-Means Clustering Algorithm.” Fuzzy Sets and Systems 159: 2428–2445.
- Liu, X., X. Zhu, M. Li, L. Wang, E. Zhu, T. Liu, M. Kloft, D. Shen, J. Yin, and W. Gao. 2019b. “Multiple Kernel k-Means with Incomplete Kernels.” IEEE Transactions on Pattern Analysis and Machine Intelligence 42: 1191–1204.
- Milletari, F., N. Navab, and S. Ahmadi. 2016. “A. V-net: Fully Convolutional Neural Networks for Volumetric Medical Image Segmentation.” 2016 Fourth International Conference on 3D Vision (3DV), 565–571. doi:10.1109/3DV.2016.79.
- Pal, N. R., and S. K. Pal. 1993. “A Review on Image Segmentation Techniques.” Pattern Recognition 26: 1277–1294.
- Santos, J., and P. Gosselin. 2012. “Philipp-Foliguet, R.; Torres, R.; Falcao, A. Multiscale Classification of Remote Sensing Images.” IEEE Transactions on Geoscience and Remote Sensing 50: 764–3775.
- Shen, Y., Y. Yuan, J. Peng, X. Chen, and Q. Yang. 2020. “River Extraction from Remote Sensing Images in Cold and Arid Regions Based on Deep Learning.” Transactions of the Chinese Society for Agricultural Machinery 51: 192–201.
- Sinaga, K. P., and M. Yang. 2020. “Unsupervised K-Means Clustering Algorithm.” IEEE Access 8: 80716–80727.
- Sirmacek, B., and C. Unsalan. 2011. “A Probabilistic Framework to Detect Buildings in Aerial and Satellite Images.” IEEE Transactions on Geoscience and Remote Sensing 49: 211–221.
- Suzuki, T. 2020. “Superpixel Segmentation via Convolutional Neural Networks with Regularized Information Maximization.” In IEEE International Conference on Acoustics, Speech and Signal Processing (ICASSP), 2573–2577. doi:10.1109/ICASSP40776.2020.9054140.
- Thakur, P., and V. Nileshsingh. 2013. “An Overview of Image Segmentation Algorithms.” International Journal of Image Processing and Vision Science 1: 150–156.
- Troya-Galvis, A., P. Gancarski, N. Passat, and L. Berti-Equille. 2015. “Unsupervised Quantification of Under- and Over-Segmentation for Object-Based Remote Sensing Image Analysis.” IEEE Journal of Selected Topics in Applied Earth Observations and Remote Sensing 8: 1936–1945.
- Tu, w., M. Liu, V. Jampani, D. Sun, and J. Kautz. 2018. “Learning Superpixels with Segmentation-Aware Affinity Loss.” 2018 IEEE/CVF Conference on Computer Vision and Pattern Recognition (CVPR). IEEE 2: 568–576.
- Wang, C., W. Pedrycz, Z. Li, M. Zhou, and J. Zhao. 2020. “Residual Sparse Fuzzy c-Means Clustering Incorporating Morphological Reconstruction and Wavelet Frame.” IEEE Transactions on Fuzzy Systems 29: 3910–3924.
- Wang, E., K. Qi, X. Li, and L. Peng. 2019. “Semantic Segmentation of Remote Sensing Image Based on Neural Network.” Acta Optica Sinica 39: 93–104.
- Xia, G., X. Bai, J. Ding, Z. Zhu, S. Belongie, J. Luo, M. Datcu, M. Pelillo, and L. Zhang. 2018. “DOTA: A Large-Scale Dataset for Object Detection in Aerial Images.” 2018 IEEE/CVF Conference on Computer Vision and Pattern Recognition, 3974–3983. doi:10.1109/CVPR.2018.00418.
- Xu, J., T. Zhao, and G. Feng. 2021. “A Fuzzy C-Means Clustering Algorithm Based on Spatial Context Model for Image Segmentation.” International Journal of Fuzzy Systems 23: 816–832.
- Yang, F., Q. Sun, H. Jin, and Z. Zhou. 2020. “Superpixel Segmentation with Fully Convolutional Networks.” 2020 IEEE/CVF Conference on Computer Vision and Pattern Recognition (CVPR), 13961–13970.
- Zhang, H., Z. Wang, and D. Liu. 2014. “A Comprehensive Review of Stability Analysis of Continuous-Time Recurrent Neural Networks.” IEEE Transactions on Neural Networks and Learning Systems 25: 1229–1262.
- Zhang, J., and L. Zhang. 2017. “A Watershed Algorithm Ccombining Spectral and Texture Information for High Resolution Remote Sensing Image Segmentation.” Geomatics and Information Ence of Wuhan University 42: 449–455.