
 ?Mathematical formulae have been encoded as MathML and are displayed in this HTML version using MathJax in order to improve their display. Uncheck the box to turn MathJax off. This feature requires Javascript. Click on a formula to zoom.
ABSTRACT
Water color is a crucial optical indicator of water quality, polluted water bodies often show water color anomalies. To comprehensively understand the occurrence of water color anomalies in inland lakes, an integrated method was designed using the hue angle based on the Forel-Ule Index (FUI) model, and other remote sensing indices, including the Turbid Water Index (TWI), Floating Algae Index (FAI), and Cyanobacteria and Macrophytes Index (CMI). Based on all available Landsat-8 OLI images from 2013 to 2020, continuous monitoring was conducted in three different lakes in the middle of the Yangtze River, China. The results demonstrated that: (1) The proposed method can accurately identify algal blooms, high sediment loads, and eutrophication from the abnormal water color areas; (2) The calculated hue angles of sediment-dominated water were significantly higher than those of algal blooms and aquatic vegetation, providing a noticeable visual discoloration of water; (3) These water color anomalies exhibited significant correlations with the water quality and environmental conditions. This study serves as an example for accurate and spatially continuous assessment of water color anomaly and supports practical information to facilitate local water environment conservation.
1. Introduction
Lakes, as typical inland water bodies, are known to be sentinels of global environmental change, playing a vital role in maintaining ecological balance and protecting global biodiversity (Allan et al. Citation2013; Tranvik et al. Citation2009). Lakes provide water resources and aquatic products for the development of industry, agriculture, and communities; hence, they often experience intense human activities and developments (Guan et al. Citation2020; Xu et al. Citation2018). In a lake system, the lake can meet the needs of irrigation, farming, shipping, and regulating microclimate. Meanwhile, the lacustrine wetlands have great potential in stabilizing the atmospheric abundance of carbon dioxide and other greenhouse gases to mitigate the risks of global warming (Eid and Shaltout Citation2013; Xu et al. Citation2021). However, human activities and climate change have posed threats to the water quantity and quality of lakes, leading to an increase in the frequency of cyanobacterial blooms and a decrease in water resources and food supply capacity (Phillips, Willby, and Moss Citation2016; Shi et al. Citation2017; Zhang et al. Citation2017). As the lake water is exposed to eutrophication, the water color and odor change, and the lake ecosystem eventually loses its original functionality (Chen, Huang, and Tang Citation2020).
Water color is the result of the interaction between sunlight and substances in water, which is closely related to the absorption and scattering of chlorophyll, suspended matter, and colored dissolved organic matter (CDOM) (Barysheva Citation1987; Kondratyev, Pozdnyakov, and Pettersson Citation1998), and it can provide information about colored water quality characteristics on a regional or global scale. Chlorophyll-a is the main phytoplankton pigment in natural water systems, and its absorption is strong in red and blue wavelengths, but weak in green wavelengths; thus, water with more chlorophyll is prone to green. Likewise, if water has a high enough concentration of yellow substance, the water body will be yellow-brown. Also, the different states of water are visible to the naked eye because the predominant color of a lake lies along a spectrum from blue (oligotrophic) to green (eutrophic); to brown (dystrophic, as dissolved carbon concentrations increase). (Topp et al. Citation2021; Webster et al. Citation2008). Consequently, the water color changes are directly related to the optical properties of component concentrations in the water; thus, the water color is a crucial optical feature of water quality.
Remote sensing is an effective means of environmental monitoring over larger areas with more continuous spatial and more frequent temporal observations than other methods (Chen and Feng Citation2018). At present, many satellite sensors, such as the Medium Resolution Imaging Spectrometer (MERIS) (Woerd and Wernand Citation2015), the Moderate Resolution Imaging Spectroradiometer (MODIS) (Wang et al. Citation2018), the Sea-viewing Wide Field-of-view Sensor (SeaWiFS) (Guan et al. Citation2020), and Landsat-8 (Urbanski et al. Citation2016), have been used in monitoring the marine and coastal water environment. These spectrometers are also designed specifically to detect the physical and chemical composition of water, such as the turbidity (Zhou et al. Citation2021; Sun et al. Citation2021), the Secchi disk depth (SDD) (Wang et al. Citation2020; Yin et al. Citation2021), the chlorophyll-a (Cao et al. Citation2020, Citation2022), and other colored components. Researchers have recorded the water color from satellite images and used this to develop the water color grade Forel-Ule Index (FUI) through water-leaving reflectance based on the Commission on Illumination (CIE) colorimetry system that is not sensitive to atmospheric correction accuracy (Chen, Huang, and Tang Citation2020; Van der Woerd and Robert Wernand Citation2018; Wang et al. Citation2019; Wernand, van der Woerd, and Gieskes Citation2013). Studies have illustrated that the FUI or hue angle can be calculated from satellite reflectance according to the band settings of different spectrometers, including MODIS, MERIS, Sentinel-3, and Landsat-8, for its strong stability and the ability to transform between different sensors (Lehmann et al. Citation2018; Van der Woerd and Robert Wernand Citation2018). These early studies indicate that the remotely sensed water color parameters have great potential to monitor the water environment changes and characterize water quality over a long-time scale.
In addition, satellite collections with long-term recorded lake information have been widely applied to monitor lacustrine environments. Many different methods for measuring water color parameters have been proposed in previous publications (Feng, Hou, and Zheng Citation2019; Jally, Mishra, and Balabantaray Citation2021; Kumar Jally, Kumar Mishra, and Balabantaray Citation2020; Wang et al. Citation2020). For example, transparency, turbidity, and suspended matter concentrations are used to quantify the turbidity degree of the waterbody. The turbid water index (TWI), a robust retrieval algorithm, on the basis of atmospherically corrected surface reflectance at 645 nm, with 1240 nm data serving as a reference for aerosols, was established to estimate concentrations of total suspended sediments (TSS) and identify areas of high turbidity (Feng et al. Citation2012; Liang et al. Citation2017). The Floating Algae Index (FAI) proposed by Hu (Citation2009) was widely used to identify and extract algal bloom information, and obtain the spatio-temporal distribution for further analysis, monitoring and early warning purposes (Hu et al. Citation2010; Hu et al. Citation2019; Wang and Hu Citation2016). Since both cyanobacterial blooms and aquatic vegetation have the spectral characteristics of vegetation, especially reflective valleys in the red band and reflective peaks in the near-infrared band, making it difficult to isolate cyanobacterial blooms. A new cyanobacteria and macrophytes index (CMI) put forward by Liang et al. (Citation2017) behaved well to distinguish between algal blooms and aquatic vegetation in lakes. These remote sensing indices have been widely used for monitoring the inland water environment.
The inland water environment is extremely complex. When a component concentration increases, the optical signal of the water body will change, thereby affecting the assessment of other components (Duan et al. Citation2014). For water color, researchers have mainly analysed colors associated with water quality parameters, such as chlorophyll-a or water clarity (Wang et al. Citation2020), then used the statistics of water quality over a wider area for a coarse estimation (Hou et al. Citation2020; Xiao, Rohrlack, and Riise Citation2020; Feng, Hou, and Zheng Citation2019). These aforementioned studies rarely focus on the trends of water color anomalies. To examine changes in the true color and capture the anomalies, we used the hue angle to extract the change of water color and identify these abnormal zones. For areas with abnormal water color, multiple indicator remote sensing indices (TWI, FAI, CMI) were combined to identify the water color anomalies including algal blooms, high sediment loads, and eutrophication. Based on that, the interference of natural events and human activities was further analysed. And the widespread monitoring of trends in the water environment is of great practical significance for the scientific understanding of the relationship between the basin environment and economic development.
In this study, the water color spatio-temporal patterns from 2013 to 2020 in the selected three lakes in the middle of the Yangtze River were analysed using Landsat-8 OLI observations. There were three objectives: (a) to delineate the water color variation in the three lakes using the hue angle based on the Forel-Ule Index model; (b) to identify the water color anomalous zones including algal bloom, high sediment loads, and eutrophication by integrating multiple remote sensing indices; and (c) to explore the related factors of water environment anomalies with the water quality data and environmental data. This study elucidated the variation of water color in more detail than previous studies and examined the factors influencing different water color anomalous areas. This is an important progression in our understanding of water color changes in lake ecosystems affected by human impacts and natural variability.
2. Study area and datasets
2.1. Study area
High turbidity and intensified eutrophication have started to threaten the supply of drinking water and the survival of wildlife (Xu et al. Citation2021; Feng, Hou, and Zheng Citation2019). In this study, to understand the changes in inland water environments, three lakes along the Yangtze River, including Lake Tangxun (the largest urban lake in China), Lake Changhu (which has a large area of aquaculture), and Lake Longgan (which is the typical freshwater shallow lake) (Guo et al. Citation2019; Guo et al. Citation2020; Tan et al. Citation2020), were chosen to monitor and analyse the water color anomaly.
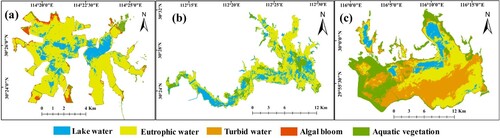
Lake Changhu ((a)), the third-largest freshwater lake in Hubei Province, is located in the northeast suburbs of Jingzhou City (30°22′–30°33′ N, 112°12′–112°31′ E). It is a momentous wetland in the middle reach of the Yangtze River, surrounded by dikes and canals. The basin area of Lake Changhu is approximately 140 km2 with functions of fish breeding, flood control and storage, and domestic water supply. Due to reclamation, overfishing, seine farming and pollution, the lake is in a eutrophic state and the biodiversity of different trophic groups of organisms shows a strong degradation. Changes in diversity, dominant population and community structure of aquatic plants have led to simplification and dysfunction in the lake ecosystem, which has changed from a grassy lake to an algal lake (Guo et al. Citation2019).
Figure 1. Map of the study area. Three typical water color anomalies are shown in the RGB images of Landsat atmospheric-corrected data in (a), (b), and (c). There is a clear color difference in the framed part of the RGB image of Lake Changhu (the upper right corner is a magnified image of this part), which is identified as aquatic vegetation (a). The algal boom and turbid water are framed in Figures (b) and (c) also present differently from the water’s true color.
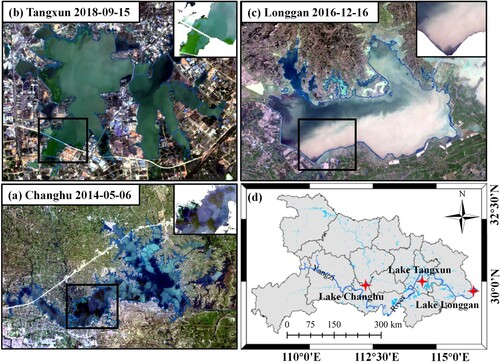
Lake Tangxun ((b)) is located in the southeast of Wuhan, Hubei Province (30°22′–30°28′ N, 114°18′–114°26′ E). It is the largest urban lake in China with a surface area of 52.19 km2 and a watershed area of 240 km2 (Wei et al. Citation2020). The terrain belongs to a monadnock alluvial plain of rivers and lakes, flat and low-lying. In recent years, the measured water quality shows that the discharge of various point and non-point source pollutants into the lake has led to continuous deterioration in water quality, and the concentration of various pollutants turns out to rise (Guo et al. Citation2020). As a consequence, the water environmental capacity has been significantly insufficient, meanwhile, the water body cannot meet its functional requirements.
Lake Longgan ((c)) is a typical shallow freshwater lake covering an area of more than 300 km2 (29°52′ –30°06′ N, 115°57′–116°20′ E), located at the junction of Hubei Province and Anhui Province. The main inflows to the lake are originally from the upper Taibai Lake and northwestern hillocks of the Dabie Mountain; then the outflow drains into the Yangtze River (Zhang et al. Citation2012). The average spring water depth of the lake is 1–2 m, with a maximum summer depth of 3–5 m, varying from year to year (Tan et al. Citation2020). In the past hundred years, the environment of Longgan basin has changed dramatically, accompanied by a substantial population increase, reclamation of hilly land, and more intense cultivation. The morphology and water quality in this area have been considerably affected.
2.2. Datasets
2.2.1. Landsat-8 OLI dataset
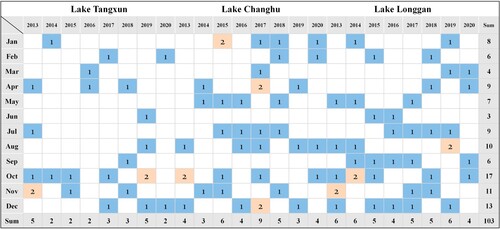
The Landsat dataset has sparked a high number of time-series analyses in water environment monitoring (Kuhn et al. Citation2019; Ren et al. Citation2018). The Landsat OLI data, with a spatial resolution of 30 m and a high signal-to-noise ratio (SNR), allows for the observation of water color in inland waters. A total of 103 scenes () of the surface reflectance (SR) products were downloaded from the Google Earth Engine (GEE, https://earthengine.google.com/) platform (Gorelick et al. Citation2017). The images were visually selected to avoid the influence of clouds, aerosols, and sun glint (Shi et al. Citation2015).
Figure 2. The datasets of Landsat-8 OLI images used in this study. Blue boxes represent one image available within a month, while orange boxes show two images were available within a month.
The Landsat-8 OLI SR products are generated by the Landsat Surface Reflectance Code (LaSRC) (Vermote et al. Citation2016), and atmospherically corrected based on the second simulation of the satellite signal in the solar spectrum (6SV) model (Vermote et al. Citation1997). The SR products have been widely validated over complex inland waters (Kuhn et al. Citation2019; Wei et al. Citation2018), and they can be used to accurately estimate inland water quality parameters and perform on par with water-specific atmospheric correction algorithms (Chen et al. Citation2020b; Gomes et al. Citation2020). In this study, the SR products downloaded by GEE were applied to derive water color, which is an intuitive measure of lake water properties that can be calculated without any knowledge of the inherent optical properties of the water column (Gardner et al. Citation2021; Giardino et al. Citation2019).
2.2.2. Ancillary datasets
The daily mean meteorological data including rainfall and wind speed from 2013 to 2020 were acquired from the China Meteorological Data Service Center (CMDC, http://data.cma.cn/). The water quality statistical datasets were collected from local environmental agency websites (Jingzhou Ecological Environment Bureau, http://sthjj.jingzhou.gov.cn/; Wuhan Ecological Environment Bureau, http://hbj.wuhan.gov.cn/; and Huanggang Ecological Environment Bureau, http://hbj.hg.gov.cn/), and are shown in . The datasets included the monthly concentration of nutrients (total phosphorus (TP) and ammonium-nitrogen (NH3-N)) and the monthly lake average Trophic Level Index (TLI). TLI represents the trophic state from oligotrophic to eutrophic, and this was used in factorial analysis to explain the water quality variation. Vegetation coverage, which quantifies the soil erosion conditions in the basin, was characterized by normalized differential vegetation index (NDVI). The monthly NDVI products were collected from EarthData (https://earthdata.nasa.gov/).
Table 1. The water quality data and environmental data from 2013 to 2020 used in this study.
3. Methodology
3.1. The analysis framework
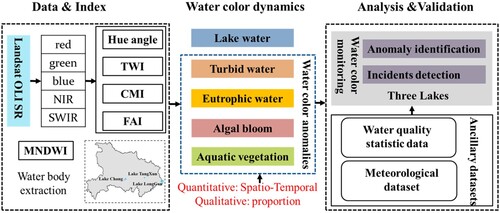
An integrated method was designed to identify the water color anomalies including algal blooms, high sediment loads, and eutrophication. The overall analysis procedure is summarized in . First, remotely sensed images were preprocessed to get the data of variables, including the hue angle, TWI, FAI and CMI. Then, the water color pattern was assessed using hue angle, and the anomalies were further identified pixel by pixel using TWI, FAI and CMI. The water color anomalies were classified to turbid water, eutrophic water, algal blooms, and aquatic vegetation, and the rest were considered to be the lake water without anomaly. Finally, the potential factors that brought about these anomalies were analysed. Ancillary sources, including the water quality data from statistical bulletins and other meteorological data, were also used in the analysis.
Figure 3. The analysis flowchart consists of input datasets, remotely sensed data preprocessing, identification of water color anomalies, and evaluation of results.
3.2. Evaluation of water color using the FUI
The hue angle based on FUI model was applied to examine the water color changes. Theoretically, color parameters are calculated from the three visible bands (red, green and blue) of satellite imagery into the CIE color space (CIE Citation1932; Wang et al. Citation2018). This colorimetry system was designed to simulate the comprehensive effect of the X, Y, and Z tristimulus values perceived by human eyes. The transformation from RGB to X, Y, Z can be expressed as EquationEq. (1(1)
(1) ):
(1)
(1) where
,
and
represent the reflectance at the red, green and blue bands, respectively. CIE chromaticity coordinates x, y, z are normalized tristimulus values between 0 and 1 calculated from the X, Y, Z using EquationEq. (2
(2)
(2) ):
(2)
(2)
Then, the hue angle (α) which can represent any pair of coordinates (x’, y’) of an upwelling radiance spectrum was calculated as EquationEq. (3(3)
(3) ):
(3)
(3)
In particular, α refers to the angle between the vector of coordinates (x′, y′) and the negative x′-axis (at y = 1/3) in the converted coordinate system (). It is worth noting that, for the convenience of calculation, the hue angle α starts from the negative -axis to remain positive from 0° to 360°, which is consistent with the definition reported in Wang et al. (Citation2014). To eliminate the color difference caused by the Landsat band setting, the hue angles were recalibrated using a delta correction designed for Landsat OLI sensors (Pitarch et al. Citation2019; Van der Woerd and Robert Wernand Citation2018).
Figure 4. An example of the processing of satellite images with the FUI model. Taking Lake Changhu as an example, the RGB images of Landsat-8 raw data (a), atmospheric-corrected data (b) and hue angle images (c) from October 16, 2015 are shown. Hue angle α in the CIE chromaticity diagram (d) refers to the intermediate parameter of the FUI model (Wang et al. Citation2018).
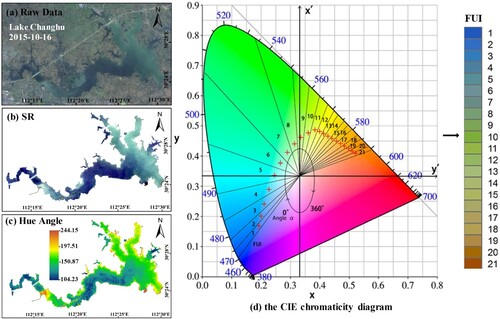
Generally, an increasing hue angle represents a water body that tends to turn from blue-to-green to yellow-to-brown (Xu et al. Citation2021). shows the example of Lake Changhu in which the RGB true color images and the corresponding hue angle are compared. Abnormal changes in the hue angle can show both a surplus of nutrients and the timing of key events such as algal blooms, heavy rainstorms, or even vegetation invasion. As a consequence, the hue angle derived from the Landsat images can be used to monitor inland water anomalies.
3.3. Multivariate integrated method for water color anomaly identification
In most cases, water color anomalies mainly related to the concentration of the parameters including chlorophyll, suspended matter, and CDOM in waters (Barysheva Citation1987; Kondratyev, Pozdnyakov, and Pettersson Citation1998). The water is generally prone to be eutrophic or even blooms when the concentration of chlorophyll is high in lakes. Besides, a high level of turbidity can also lead to discoloration in lakes. Thus, to reflect the comprehensive water color anomalies in inland waters, the driver factors of the abnormal zones in water color were mainly simplified by three variables, including eutrophication, turbidity, and other aquatic plant condition, and each of them was represented by a remote sensing index. The areas of water anomaly were finally identified as algal blooms, aquatic plants, high sediment loads, and eutrophication.
When very high levels of suspended sediments are present, they can dominate the optical signal, leading to abnormal water color. The TWI was applied to identify areas of high turbidity. The algorithm was based on the atmospherically corrected surface reflectance at the red band, with the short-wave infrared (SWIR) band serving as a reference to remove aerosol contributions (Feng et al. Citation2012; Liang et al. Citation2017). The approach for suspended solids in Case II water was defined as EquationEq. (4(4)
(4) ):
(4)
(4)
Besides, the distribution of algae and other aquatic plants in the waters also would lead to a discoloration of water. Here, the FAI (Hu Citation2009) was used for detecting floating algae in lakes. In addition, the CMI was chosen to distinguish waters with cyanobacterial scums from those dominated by aquatic macrophytes, following a baseline subtraction similar to the FAI index with clearly different band combinations (Chen et al. Citation2020a; Liang et al. Citation2017). The use of the baseline subtraction method removed additional impacts from atmospheric effects. FAI and CMI were described as EquationEq. (5(5)
(5) ) and (Equation6
(6)
(6) ):
(5)
(5)
(6)
(6) where
,
,
,
and
represent the reflectance at the blue, green, red, near-infrared and short-wave infrared bands, respectively. For Landsat-8 OLI images, the bands are
= 490 nm,
= 560 nm,
= 655 nm,
= 865 nm and
= 1610 nm.
Here, the framework of water color anomalies is constructed with five steps (): Step 1: exclude the water color anomaly zones according to the selected thresholds of the hue angle in the three lakes; Step 2: identify and calculate the areas of turbid water using the TWI; Step 3: obtain the lake water with vegetation (including algae and aquatic plants) based on FAI; Step 4: identify which was existing in the pixel, cyanobacterial scum or aquatic macrophytes using CMI; Step 5: allocate the residual abnormal part of the water as eutrophication. It is worth noting that the threshold development was the crucial step for distinguishing the different water color anomalous zones.
Figure 5. The integrated method to distinguish water color anomalies.
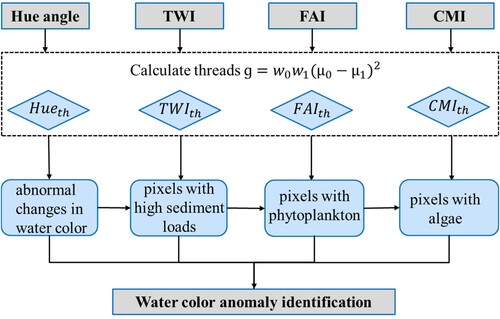
The maximum category variance method (Otsu) is a global binarization algorithm and an adaptive threshold acquisition method, and it has been widely used in previous studies (Chen et al. Citation2020a; Liang et al. Citation2017). The otsu algorithm divides the image into two parts, the target (the proportion , and the average
) and the background (the proportion
, and the average
), according to the grayscale characteristics of the image. The inter-class variance of the two parts is largest when the optimal threshold value (g) is chosen.
(7)
(7)
Hence, this method was selected to calculate the threshold of each hue angle image (with land and cloud masked). Then, the hue angle threshold (Hueth) was defined as the mean value of the thresholds calculated from all images of each lake. This method was also applied to determine the TWI, FAI and CMI threshold (TWIth, FAIth, CMIth) for the image on different dates of three lakes.
4. Results
4.1. Spatio-temporal pattern of water color
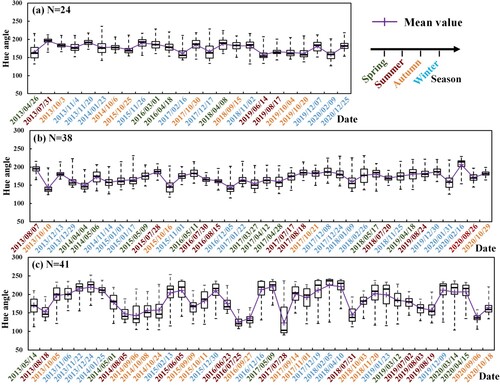
The water color changes in Lakes Tangxun, Changhu, and Longgan from 2013 to 2020 were elucidated by calculating the hue angle values for all pixels from each Landsat-8 OLI image. The increase of hue angle indicated that the water color changed from blue-to-green to yellow-to-brown, and vice versa (Xu et al. Citation2021). The water color box plot gave a clear presentation of the temporal variability (). The hue angle values ranged between 50 and 250 in the three lakes, and the lake water color changed from dark blue to yellowish brown. The maximum values of hue angle in Lake Tangxun and Lake Changhu were approximately 210, while in Lake Longgan they were between 200 and 250. The minimum values of hue angle in Lake Tangxun and Lake Changhu were approximately 140, while those of Lake Longgan varied from 100 to 150. It suggested that the water color variations in Lake Tangxun and Lake Changhu were relatively stable with slight fluctuations, while more substantial changes occurred in Lake Longgan. Moreover, it was found that the hue angles of Lake Tangxun were higher than that of Lake Changhu over the long time, indicating that the overall water quality of Lake Tangxun was worse than that of Lake Changhu. A dramatic change was shown in Lake Longgan as the mean values of hue angle changed drastically from a minimum value of 123 on July 28, 2017 to a maximum value of 225 on February 5, 2018. Additionally, the water color of Lake Longgan exhibited a distinct seasonal variation, from blue-to-green in summer to yellow-to-brown in winter, which suggested that the water quality in summer was better than that in winter.
Figure 6. The box-plot and data distribution of hue angle (2013–2020) in Lake Tangxun (a), Lake Changhu (b), and Lake Longgan (c), where N is the number of valid images of each lake. The x-axis is the image acquisition date. The y-axis is the hue angle.
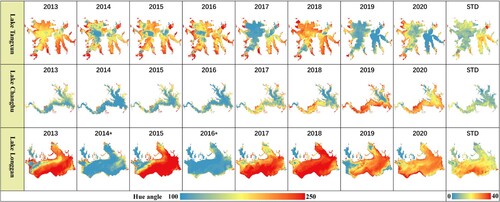
The annual spatial distribution of water color in three lakes was further ascertained. The annual water color dynamics were plotted in , and a noticeable visual discoloration of water was displayed. The water color spatial pattern of Lake Tangxun showed an apparent change from yellow-to-brown to blue-to-green during the eight years, except for the abnormal variation in 2018. The deterioration of the overall water quality occurred in 2018 due to the algal bloom. As shown by the standard deviation (STD) image of the lake, the eastern part of Lake Tangxun changed more substantially than the other parts. Lake Changhu showed an opposite trend, as the lake water color changed from blue-to-green to yellow-to-brown. The STD image showed that the hue angle values in the relatively narrow western water area of Lake Changhu varied greatly. In both Lake Tangxun and Lake Changhu, the water color was prone to be dark on all the margins, while the water was clearer in the centre of the lake. In Lake Longgan, the water color remained at a state of yellow-to-brown, except for 2014 and 2016 when there was a lack of valid images in winter. Additionally, the water color presented tremendous changes as shown in the STD image in the southern part of Lake Longgan.
Figure 7. Annual variation of the hue angle in Lake Tangxun, Lake Changhu, and Lake Longgan from 2013 to 2020. * Indicates that there are not adequate valid images in winter; thus, the value of the annual average hue angle is smaller than usual.
Above all, the water color variations in Lake Tangxun and Lake Changhu showed a distinct temporal trend, while the changes in Lake Longgan behaved more differently. From the shore to the centre of the lake, the water color of Lake Tangxun and Lake Changhu turned from blue-to-green to yellow-to-brown. The water color changed from blue-to-green to yellow-to-brown annually in Lake Changhu, while the opposite trend was shown in Lake Tangxun. Lake Longgan had a stronger seasonal variation in water color derived from the images as shown in . The water color anomalies that caused these variations required further analysis to give a comprehensive understanding of the water environment. Therefore, these water color anomalies were further discussed and analysed.
4.2. Identification of water color anomalies
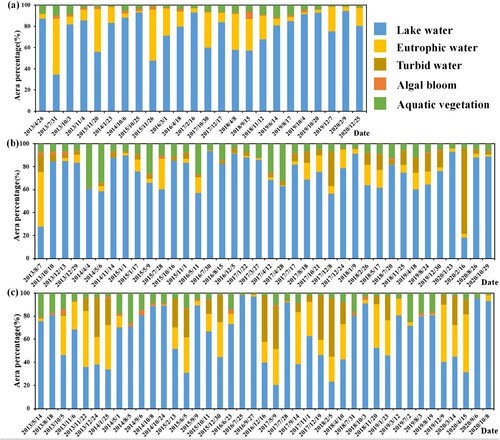
To identify the areas with abnormal changes in water color, multiple remote sensing indices (TWI, FAI, and CMI) were used to classify eutrophic water, turbid water, algal blooms, and aquatic plants in the natural lake water for each Landsat-8 OLI image from 2013 to 2020 (). It can be seen that the higher the proportion of the abnormal water color area was, the higher the corresponding hue angle value was (). The identification results for Lake Tangxun showed that the eutrophic water often accounted for more than 20% of the lake area, implying possibly polluted lake water ((a)). Besides, the proportion of algal blooms (approximately 6% or 3 km2) was abnormally high in Lake Tangxun on September 15, 2018, along with a relatively larger area of eutrophication. The aquatic vegetation and turbid water calculated from the images accounted for only a fraction of the lake without abnormal variations. This urban lake is far from farming land, meaning that it is not substantially affected by human activities. Long-term monitoring showed that turbid water seldom appeared in Lake Tangxun. The turbid water in Lake Changhu ((b)) revealed noticeable changes, accompanied by widespread eutrophic water. Especially, the area of turbid water on February 16, 2020 accounted for 70% of Lake Changhu. In addition, aquatic plants were abundant with a seasonal variation (particularly high in April) and up to 30% of the area was covered by aquatic plants in the spring of 2014. The area of aquatic vegetation in Lake Changhu was decreased after 2017, with the largest area only accounting for approximately 12% in July 2018, and even less after 2019. In Lake Longgan ((c)), the aquatic vegetation also displayed a seasonal variation, being abundant in July and August with an area proportion of approximately 15%. However, the area of the turbid water calculated from the images fluctuated greatly along with a relatively large scale of eutrophication. The total area of turbid water and eutrophication accounted for more than half of the lake, mostly appearing in spring or winter.
Figure 8. The identified water color anomalies (2013–2020) in Lake Tangxun (a), Lake Changhu (b), and Lake Longgan (c).
Further, the spatial distribution of water color anomalies was obtained according to the occurrence frequency of anomalies in each pixel in Lake Tangxun (a), Lake Changhu (b) and Lake Longgan (c) from 2013 to 2020 (). In Lake Tangxun, the lake had been in the eutrophication state for a long time, and even a small area of water bloom appeared at the shore of the lake. Moreover, it is found that the water quality in the central part of the lake was much better than that in the cyanobacteria-dominated zone. There was abundant aquatic vegetation in Lake Changhu, and a large area of water eutrophication occurred around the aquatic vegetation area. The aquatic vegetation in Lake Changhu was artificially cultivated, and the water quality was likely to be seriously affected by the inflow of a large quantity of nutrients. Lake Longgan was also rich in aquatic vegetation, mainly distributed in the western part of the lake. Large area of turbid water was often accompanied by massive eutrophication in the southern part of Lake Longgan. Different variations of the water color anomalies indicated that the water environment of Lake Longgan was more drastic and complicated compared with that of Lake Tangxun and Lake Changhu.
Figure 9. The spatial distribution of water color anomalies in Lake Tangxun (a), Lake Changhu (b) and Lake Longgan (c) from 2013 to 2020.
In conclusion, the long-term changes in the aquatic vegetation displayed a seasonal variation in Lake Changhu and Lake Longgan without abrupt changes. The eutrophication variations of the three lakes were slightly different. In Lake Tangxun, the eutrophication area covered approximately 30% of the lake, and the eutrophic water areas in the other two lakes were more likely to change along with the area of turbid water. Turbid water rarely appeared in Lake Tangxun, but was more common in Lake Changhu and Lake Longgan. The large area of agricultural land around the lakes increased the likelihood that they would be affected by natural environment factors.
4.3. Validation of identification results in three lakes
The aforementioned studies have confirmed that the TWI can identify areas of high turbidity, the FAI combined with CMI has also been maturely employed for distinguishing the algal bloom and the aquatic vegetation from the pure water. Therefore, the integrated method based on TWI, FAI, and CMI was designed to quantify the areas of the water color anomalies including turbid water, algal blooms, and aquatic plants in this study. Direct validation of the identification results can not be done since there is no large-scale automated surface water quality monitoring station datasets for these lakes. Therefore, the water quality statistic data in three lakes and the existing research results, including the water color results derived by Xu et al. (Citation2021), the monthly TLI (2013–2020) datasets collected from the National Surface Water Quality Monitoring Report, and the ecology analysis in Lake Records of Hubei Province (2014), were adapted for an auxiliary validation.
According to the water color results derived by Xu et al. (Citation2021) in the three lakes, the average annual hue angle was higher in Lake Longgan contrasted with the other two lakes. In Lake Tangxun, the annual hue angle in 2018 was particularly high, and the hue angle in Lake Changhu increased from 2017. These results were basically consistent with derived water color results in this study. Moreover, the identification results were also confirmed by the Lake Records of Hubei Province. According to the records, the coverage rate of aquatic vegetation in Lake Changhu was abundant in early years, and this decreased to 30% in 2014, the trend of the aquatic vegetation in Lake Changhu was consistent with the calculation results. The decline of water quality in Lake Changhu was likely to be caused by aquaculture as it accounted for about 46.3% of the lake area. To maintain the water environment of Lake Changhu, purse seine aquaculture in the lake was completely dismantled in 2017. Therefore, the aquatic vegetation in Lake Changhu was greatly reduced. Besides, on the basis of the monthly water quality classification data in lakes from the National Surface Water Quality Monitoring Report (2013–2020), the water in Lake Tangxun was always in a state of moderate eutrophication from 2013 to 2020, and a relative large-scale bloom occurred in August 2018. Lake Longgan has been in a state of mild/moderate eutrophication for a long time. Overall, these datasets manifest that the identified results based on water color anomalies were relatively reliable, which proved the applicability for this new strategy in the detection of water color anomalies.
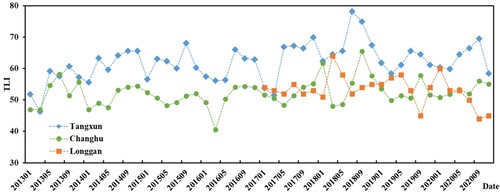
The monthly TLI (2013–2020) were collected to evaluate the water quality of the three lakes. The TLI is divided into three levels, oligotrophic (TLI < 30), mesotrophic (30 < TLI < 50), and eutrophic (TLI > 50). It can be seen that the TLI values varied between 50 and 60 and indicated slight eutrophication in all three lakes (). The TLI values of Lake Tangxun were higher than the other two lakes, suggesting that the water in Lake Tangxun was at greater risk of eutrophication. The inter-annual variability showed that the values of TLI in Lake Tangxun and Lake Changhu were higher in summer and lower in winter, while Lake Longgan showed an opposite situation with TLI values higher in winter and lower in summer. In addition, the TLI of Lake Tangxun was especially high in September 2018 when the algal bloom occurred and the lake water was exposed to eutrophication. These variations of TLI were same as the water color calculated from hue angle.
Figure 10. The monthly average TLI (2013–2020) datasets in the three lakes, which shows the trophic state change from oligotrophic to eutrophic. The valid data of TLI in Lake Longgan began in 2017.
When abnormal environment events occurred in the water, there would be a noticeable feature on the RGB images. Therefore, images with massive areas of anomalies in Lakes Tangxun, Changhu, and Longgan were selected to examine the identification results with the RGB visual interpretation (). It can be seen that the spatial distribution of the identification areas was basically consistent with the results from the visual interpretation. In addition, the area of identified anomalies was further compared with the visual interpretation results (). The APE (Absolute Percentage Error) between the identification results and the results of visual interpretation was within 20%, which proved that this integrated method could well identify the abnormal state of water color in complex inland water bodies.
Figure 11. The extracted result superimposed on the RGB image (a) The algal bloom occurred in Lake Tangxun. (b) and (c) The aquatic plants in Lakes Changhu and Longgan. (d), (e) and (f) The turbid water in Lakes Changhu and Longgan.
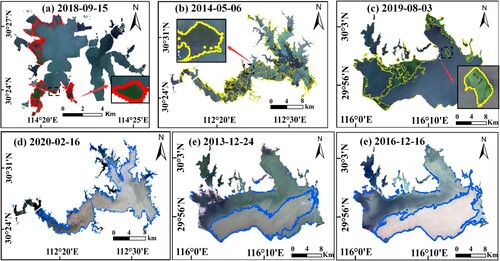
Table 2. Comparison of the selected identified areas and the visual interpretation results in the three lakes.
5. Discussion
5.1. Interpretation of the relationship between hue angle and different anomalies
To examine the variations in hue angle for algal blooms, aquatic vegetation, and turbid water, four days with massive areas of anomalies in Lakes Tangxun, Changhu, and Longgan were selected (). On September 15, 2018, algal blooms broke out in Lake Tangxun, accounting for approximately 6% of the lake area. The hue angles of the day displayed that the average value of the hue angle was 181, with a minimum of 150, a maximum of 209 and standard deviation of 13. The values of the hue angle in the bloom area were approximately 185 and at a moderate level. The true color of algal bloom is usually green in filed observations. In this incident, the hue angle changed from blue to green and brown (Xu et al. Citation2021; Van der Woerd and Robert Wernand Citation2018); thus, the hue angle values of algal blooms were not high. As a consequence, it was difficult to identify the algal blooms from the eutrophic water with high chlorophyll concentration only by the hue angle.
Table 3. The hue angle values of algal blooms, aquatic plants, and turbid water in three lakes of selected dates.
Lakes Longgan and Changhu had abundant aquatic vegetation of different species (Guo et al. Citation2019; Zhang et al. Citation2012). May 6, 2014 and August 3, 2019 were chosen, with aquatic vegetation proportion of 34% in Lake Changhu and 17% in Lake Longgan, respectively. The average value of hue angle was 162 on August 3, 2019 in Lake Longgan, with a minimum value of 128, a maximum value of 204 and a standard deviation of 16. The hue angle values of aquatic vegetation in Lake Longgan were approximately 170, which were rather close to the hue angle value of the algal blooms. On May 6, 2014, the average value of hue angle was 173 in Lake Changhu, with a minimum value of 134, a maximum value of 206 and a standard deviation of 19. The hue angle values of aquatic vegetation in Lake Changhu were approximately 181, which were slightly higher than those in Lake Longgan. The species of aquatic vegetation were complex and diverse, including submerged macrophytes, emergent macrophytes, and phytoplankton (Liu et al. Citation2015). In accordance with their growth characteristics, the hue angle values of aquatic vegetation were slightly different.
From the identification results, it can be seen that turbid water covering more than 30% of the lake was common to be seen in Lake Longgan ((c)). Taking December 16, 2016 as an example, hue angle values in Lake Longgan reflected higher values with an average hue angle value of 213, a minimum value of 131, a maximum value of 239, and a standard deviation of 26. The hue angle values of turbid water ranged around 230, which were higher than the hue angle values of aquatic vegetation and algal blooms. The true color of turbid water is brown, and it is more sensitive to the hue angle.
Overall, based on the hue angle values of these diverse anomalies, the hue angle of lakes with areas of algal blooms and turbid water were generally higher. These anomalies could contribute to extensive eutrophication of the lake according to the identification results. Large-scale reclamation and agricultural planting, such as around Lake Changhu (Guo et al. Citation2019), might also contribute to the occurrence of eutrophication, although natural aquatic vegetation in lake water did not have a significant impact on the water body quality (Liu et al. Citation2015), such as in Lake Longgan. Therefore, the recognition of water color anomalies through the integrated method can be conducted to manage and protect the lakes in a targeted manner.
5.2. Potential factors for the water color anomalies
To get a more comprehensive understanding of the impacts from the factors influencing water color anomalies, water quality datasets, including total nitrogen and phosphorus, meteorological factors such as wind speed, rainfall, temperature and sunshine, as well as NDVI datasets reflecting soil erosion, were used to conduct an in-depth analysis of water color changes in the three lakes (). According to the dynamics of the monthly average NDVI values of the three lake basins from 2013 to 2020 ((a)), the same change trend was shown. On the whole, the NDVI value of Lake Tangxun was lower than that of Lake Changhu and Lake Longgan. This indicated that Lake Tangxun, as an urban lake, was less affected by soil erosion and agricultural planting, while Lake Longgan and Lake Changhu were more affected by these factors. (b) depicted the trend of the nutrients concentration changes in three lakes. Due to data acquisition limits, data began in 2014 for Lake Changhu, and for Lake Longgan began in 2017. When a large quantity of nutrients such as nitrogen and phosphorus, the two main nutrients leading to lake eutrophication, enter slow-flowing water bodies such as lakes, rivers, and bays, abnormal growth of algae will be induced, which could eventually accumulate to form algal blooms (Anttila et al. Citation2018; Hu et al. Citation2021). The over-standard TP and NH3-N concentrations could account for the long-term eutrophication in Lake Tangxun. Since 2017, the concentration of TP in Lake Changhu has been in a downward trend, which was closely related to the removal of purse seine in Lake Changhu in 2017.
Figure 12. The potential factors for the water color anomalies in Lake Tangxun, Lake Changhu, and Lake Longgan. (a) The monthly dynamic of NDVI in three lakes basin. (b) Changes of TP and NH3-N concentrations in three lakes (the valid observations from 2013 to 2020), the y-axis represents the times that the concentration of the nutrients exceeded the standard value. The Relationship between precipitation, wind speed, temperature, sunshine and water color anomaly in Lake Tangxun (c), Lake Changhu (d), Lake Longgan (e) (The value of wind speed was scaled by a factor of 10 to show it more clearly).
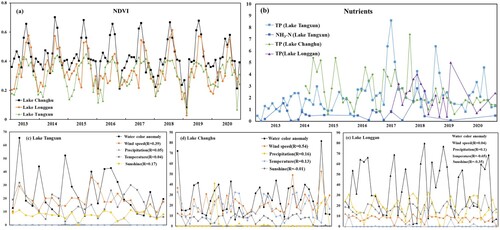
In addition, the correlation between the meteorological factors and the proportion of lake water color anomalies was analysed in the three lakes from 2013 to 2020. The correlations between the water color change of Lake Tangxun and meteorological factors including rainfall, wind speed, temperature and sunshine were relatively low, as shown in (c). Among them, the wind speed change have a slight influence on the water color, but the R only reached 0.39. Therefore, the water anomaly in Lake Tangxun was most likely to be caused by the high concentration of nutrients and the consequent eutrophication. In Lake Changhu, the water color anomaly was more correlated with wind speed (R = 0.54) than rainfall, air temperature and sunshine. Lake Changhu has an elongated shape and is surrounded by aquaculture (Guo et al. Citation2019), so that extreme weather can easily cause the water to become turbid resulting in water anomaly (Sun et al. Citation2021; Kuhn et al. Citation2019; Zhou et al. Citation2021).
Lake Longgan was completely different from Lake Changhu and Lake Tangxun. The abnormal changes of water color in Lake Longgan were slightly correlated with temperature (R = −0.65) and sunshine (R = −0.35), showing strong seasonality. Lake Longgan is a typical shallow freshwater lake with a water depth ranging from 1 to 2 m, and this gives rise to apparent seasonal variations in transparency (Shi et al. Citation2018). The water volume increased in summer and decreased in winter, leading to a flood and dry period for the lake. During the dry season, the lake is relatively shallow, and the wind can more easily transport the sediment and other particulate matter from around the lake into the water, resulting in high turbidity. Moreover, nutrients from farmlands around Lake Longgan can also be brought into the lake. Therefore, the area proportion of turbid water and eutrophic water was significantly higher in winter. Another factor that should also be considered is the substrate sludge of the lake, which may greatly affect the optical signal of the water (Liang et al. Citation2017; Feng et al. Citation2012), causing the lake to look turbid and increasing the uncertainty of the long-term remote sensing monitoring. When high level of suspended sediments or substrate sludge of the lake dominate the optical signal, there is a tendency to misidentify these areas of high turbidity as other anomalies such as cyanobacterial scums (Liang et al. Citation2017). Therefore, monitoring the water environment in shallow water areas ought to combine field sampling and remote sensing to comprehensively evaluate water quality and water body abnormalities.
6. Conclusions
In this study, an integrated method based on the hue angle, combined with TWI, FAI, and CMI, was developed to identify the water color anomaly. The hue angle was applied to estimate water color dynamics in three selected lakes in the middle of the Yangtze River, China using Landsat-8 OLI images from 2013 to 2020. Then, the areas of the water color anomalies including algal blooms, high sediment loads, and eutrophication were quantified by the integrated method and the water environment factors were further explored. The synthesis results showed that:
Water color variations were relatively stable with slight fluctuations in Lake Tangxun and Lake Changhu, but dramatic changes were found in Lake Longgan due to turbid water. The calculated hue angles of sediment-dominated water were significantly higher than those of algal blooms and aquatic vegetation, suggesting a noticeable visual discoloration of water.
Large areas of turbid water accompanied by massive eutrophication occurred repeatedly in Lakes Changhu and Longgan. In Lake Tangxun, the lake water has been in a state of eutrophication for years. These water color anomalies showed certain correlations with the environmental factors.
The method of integrating multiple remote sensing indices used in this study showed great performance for dynamic monitoring of inland lakes.
This study confirmed the feasibility of this integrated method to monitor water color anomaly variations in inland lakes. Since the technology of multi-sensor combination with an improved capability in temporal resolution for lake dynamic monitoring, combinations of other higher spatial resolution sensors like Sentinel-2 (10-20 m) are expected to support more detailed, large-scale, and long-time water color anomaly monitoring in future works.
Disclosure statement
No potential conflict of interest was reported by the author(s).
Data availability statement
The Landsat-8 OLI images are openly available in Google Earth Engine. The meteorological data were acquired from the China Meteorological Data Service Center (CMDC, http://data.cma.cn/). The water quality data were collected from local environmental agency websites (Jingzhou Ecological Environment Bureau, http://sthjj.jingzhou.gov.cn/; Wuhan Ecological Environment Bureau, http://hbj.wuhan.gov.cn/; and Huanggang Ecological Environment Bureau, http://hbj.hg.gov.cn/). The monthly NDVI dataset was collected from EarthData (https://earthdata.nasa.gov/). The results of this paper can be asked by corresponding email.
Additional information
Funding
References
- Allan, J. David, Peter B McIntyre, Sigrid DP Smith, Benjamin S Halpern, Gregory L Boyer, Andy Buchsbaum, G. A. Burton, Linda M. Campbell, W. Lindsay Chadderton, and Jan J.H. Ciborowski. 2013. “Joint Analysis of Stressors and Ecosystem Services to Enhance Restoration Effectiveness.” Proceedings of the National Academy of Sciences 110 (1): 372–377. doi:10.1073/pnas.1213841110.
- Anttila, Saku, Vivi Fleming-Lehtinen, Jenni Attila, Sofia Junttila, Hanna Alasalmi, Heidi Hällfors, Mikko Kervinen, and Sampsa Koponen. 2018. “A Novel Earth Observation Based Ecological Indicator for Cyanobacterial Blooms.” International Journal of Applied Earth Observation and Geoinformation 64: 145–155. doi:10.1016/j.jag.2017.09.007.
- Barysheva, L. 1987. “On the Issue of Intercorrespondence of Color Scales Used in Limnology.” Remote Monitoring of Large Lakes, 60–65.
- Cao, Zhigang, Ronghua Ma, Hongtao Duan, Nima Pahlevan, John Melack, Ming Shen, and Kun Xue. 2020. “A Machine Learning Approach to Estimate Chlorophyll-a from Landsat-8 Measurements in Inland Lakes.” Remote Sensing of Environment 248: 111974. doi:10.1016/j.rse.2020.111974.
- Cao, Zhigang, Ronghua Ma, John M. Melack, Hongtao Duan, Miao Liu, Tiit Kutser, Kun Xue, Ming Shen, Tianci Qi, and Huili Yuan. 2022. “Landsat Observations of Chlorophyll-a Variations in Lake Taihu from 1984 to 2019.” International Journal of Applied Earth Observation and Geoinformation 106: 102642. doi:10.1016/j.jag.2021.102642.
- Chen, X., and L. Feng. 2018. “Remote Sensing of Lakes’ Water Environment - ScienceDirect.” Comprehensive Remote Sensing 8: 249–277. doi:10.1016/B978-0-12-409548-9.10408-7.
- Chen, Qi, Mutao Huang, and Xiaodong Tang. 2020. “Eutrophication Assessment of Seasonal Urban Lakes in China Yangtze River Basin Using Landsat 8-Derived Forel-Ule Index: A six-Year (2013–2018) Observation.” Science of the Total Environment 745: 135392. doi:10.1016/j.scitotenv.2019.135392.
- Chen, Nengcheng, Siqi Wang, Xiang Zhang, and Shangbo Yang. 2020a. “A Risk Assessment Method for Remote Sensing of Cyanobacterial Blooms in Inland Waters.” Science of the Total Environment 740: 140012. doi:10.1016/j.scitotenv.2020.140012.
- Chen, Jiang, Weining Zhu, Yong Q. Tian, and Qian Yu. 2020b. “Monitoring Dissolved Organic Carbon by Combining Landsat-8 and Sentinel-2 Satellites: Case Study in Saginaw River Estuary, Lake Huron.” Science of the Total Environment 718: 137374. doi:10.1016/j.scitotenv.2020.137374.
- CIE, CUPC. 1932. Commission Internationale de L'eclairage Proceedings, 1931.” Cambridge: Cambridge University.
- Duan, Hongtao, Ronghua Ma, Steven Arthur Loiselle, Qiushi Shen, Hongbin Yin, and Yuchao Zhang. 2014. “Optical Characterization of Black Water Blooms in Eutrophic Waters.” Science of the Total Environment 482: 174–183. doi:10.1016/j.scitotenv.2014.02.113.
- Eid, Ebrahem M, and Kamal H Shaltout. 2013. “Evaluation of Carbon Sequestration Potentiality of Lake Burullus, Egypt to Mitigate Climate Change.” The Egyptian Journal of Aquatic Research 39 (1): 31–38. doi:10.1016/j.ejar.2013.04.002.
- Feng, Lian, Xuejiao Hou, and Yi Zheng. 2019. “Monitoring and Understanding the Water Transparency Changes of Fifty Large Lakes on the Yangtze Plain Based on Long-Term MODIS Observations.” Remote Sensing of Environment 221: 675–686. doi:10.1016/j.rse.2018.12.007.
- Feng, Lian, Chuanmin Hu, Xiaoling Chen, Liqiao Tian, and Liqiong Chen. 2012. “Human Induced Turbidity Changes in Poyang Lake Between 2000 and 2010: Observations from MODIS.” Journal of Geophysical Research: Oceans 117: C7. doi:10.1029/2011JC007864.
- Gardner, John R, Xiao Yang, Simon N Topp, Matthew RV Ross, Elizabeth H Altenau, and Tamlin M Pavelsky. 2021. “The Color of Rivers.” Geophysical Research Letters 48 (1): e2020G–L088946. doi:10.1029/2020GL088946.
- Giardino, Claudia, Kerttu-Liis Kõks, Rossano Bolpagni, Giulia Luciani, Gabriele Candiani, Moritz K Lehmann, Hendrik Jan Van der Woerd, and Mariano Bresciani. 2019. “The Color of Water from Space: A Case Study for Italian Lakes from Sentinel-2.” In Geospatial Analyses of Earth Observation (EO) Data. IntechOpen, doi:10.5772/intechopen.86596.
- Gomes, Ana Carolina, Enner Alcântara, Thanan Rodrigues, and Nariane Bernardo. 2020. “Satellite Estimates of Euphotic Zone and Secchi Disk Depths in a Colored Dissolved Organic Matter-Dominated Inland Water.” Ecological Indicators 110: 105848. doi:10.1016/j.ecolind.2019.105848.
- Gorelick, Noel, Matt Hancher, Mike Dixon, Simon Ilyushchenko, David Thau, and Rebecca Moore. 2017. “Google Earth Engine: Planetary-Scale Geospatial Analysis for Everyone.” Remote Sensing of Environment 202: 18–27. doi:10.1016/j.rse.2017.06.031.
- Guan, Qi, Lian Feng, Xuejiao Hou, Guy Schurgers, Yi Zheng, and Jing Tang. 2020. “Eutrophication Changes in Fifty Large Lakes on the Yangtze Plain of China Derived from MERIS and OLCI Observations.” Remote Sensing of Environment 246: 111890. doi:10.1016/j.rse.2020.111890.
- Guo, Minli, Xiaolu Li, Chunlei Song, Guanglong Liu, and Yiyong Zhou. 2020. “Photo-induced Phosphate Release During Sediment Resuspension in Shallow Lakes: A Potential Positive Feedback Mechanism of Eutrophication.” Environmental Pollution 258: 113679. doi:10.1016/j.envpol.2019.113679.
- Guo, Kun, Naicheng Wu, Chao Wang, Deguo Yang, Yongfeng He, Jingbo Luo, Yi Chai, Ming Duan, Xiaofeng Huang, and Tenna Riis. 2019. “Trait Dependent Roles of Environmental Factors, Spatial Processes and Grazing Pressure on Lake Phytoplankton Metacommunity.” Ecological Indicators 103: 312–320. doi:10.1016/j.ecolind.2019.04.028.
- Hou, Xuejiao, Lian Feng, Jing Tang, Xiao-Peng Song, Junguo Liu, Yunlin Zhang, Junjian Wang, Yang Xu, Yanhui Dai, and Yi Zheng. 2020. “Anthropogenic Transformation of Yangtze Plain Freshwater Lakes: Patterns, Drivers and Impacts.” Remote Sensing of Environment 248: 111998. doi:10.1016/j.rse.2020.111998.
- Hu, Chuanmin. 2009. “A Novel Ocean Color Index to Detect Floating Algae in the Global Oceans.” Remote Sensing of Environment 113 (10): 2118–2129. doi:10.1016/j.rse.2009.05.012.
- Hu, Chuanmin, Zhongping Lee, Ronghua Ma, Kun Yu, Daqiu Li, and Shaoling Shang. 2010. “Moderate Resolution Imaging Spectroradiometer (MODIS) Observations of Cyanobacteria Blooms in Taihu Lake, China.” Journal of Geophysical Research: Oceans 115: C4. doi:10.1029/2009JC005511.
- Hu, Lianbo, Kan Zeng, Chuanmin Hu, and Ming-Xia He. 2019. “On the Remote Estimation of Ulva Prolifera Areal Coverage and Biomass.” Remote Sensing of Environment 223: 194–207. doi:10.1016/j.rse.2019.01.014.
- Hu, Minqi, Yuchao Zhang, Ronghua Ma, Kun Xue, Zhigang Cao, Qiao Chu, and Yuanyuan Jing. 2021. “Optimized Remote Sensing Estimation of the Lake Algal Biomass by Considering the Vertically Heterogeneous Chlorophyll Distribution: Study Case in Lake Chaohu of China.” Science of the Total Environment 771: 144811. doi:10.1016/j.scitotenv.2020.144811.
- Jally, S. K., A. K. Mishra, and S. Balabantaray. 2021. “Retrieval of Suspended Sediment Concentration of the Chilika Lake, India Using Landsat-8 OLI Satellite Data.” Environmental Earth Sciences 80 (8): 1–18. doi:https://doi.org/10.1007/s12665-021-09581-y.
- Kondratyev, K Ya, DV Pozdnyakov, and LH Pettersson. 1998. “Water Quality Remote Sensing in the Visible Spectrum.” International Journal of Remote Sensing 19 (5):957-979. https://doi.org/10.1080/014311698215810.
- Kuhn, Catherine, Aline de Matos Valerio, Nick Ward, Luke Loken, Henrique Oliveira Sawakuchi, Milton Kampel, Jeffrey Richey, Philipp Stadler, John Crawford, and Rob Striegl. 2019. “Performance of Landsat-8 and Sentinel-2 Surface Reflectance Products for River Remote Sensing Retrievals of Chlorophyll-a and Turbidity.” Remote Sensing of Environment 224: 104–118. doi:10.1016/j.rse.2019.01.023.
- Kumar Jally, S., A. Kumar Mishra, and S. Balabantaray. 2020. “Estimation of Trophic State Index of Chilika Lake Using Landsat-8 oli and Liss-iii Satellite Data.” Geocarto International, doi:10.1080/10106049.2018.1533593.
- Lehmann, Moritz K, Uyen Nguyen, Mathew Allan, and Hendrik Jan Van der Woerd. 2018. “Colour Classification of 1486 Lakes Across a Wide Range of Optical Water Types.” Remote Sensing 10 (8): 1273. doi:10.3390/rs10081273.
- Liang, Qichun, Yuchao Zhang, Ronghua Ma, Steven Loiselle, Jing Li, and Minqi Hu. 2017. “A MODIS-Based Novel Method to Distinguish Surface Cyanobacterial Scums and Aquatic Macrophytes in Lake Taihu.” Remote Sensing 9 (2): 133. doi:10.3390/rs9020133.
- Liu, Xiaohan, Yunlin Zhang, Kun Shi, Yongqiang Zhou, Xiangming Tang, Guangwei Zhu, and Boqiang Qin. 2015. “Mapping Aquatic Vegetation in a Large, Shallow Eutrophic Lake: A Frequency-Based Approach Using Multiple Years of MODIS Data.” Remote Sensing 7 (8): 10295–10320. doi:10.3390/rs70810295.
- Phillips, Geoff, Nigel Willby, and Brian Moss. 2016. “Submerged Macrophyte Decline in Shallow Lakes: What Have we Learnt in the Last Forty Years?” Aquatic Botany 135: 37–45. doi:10.1016/j.aquabot.2016.04.004.
- Pitarch, J., Hjvd Woerd, Rjw Brewin, and O. Zielinski. 2019. “Optical Properties of Forel-Ule Water Types Deduced from 15 Years of Global Satellite Ocean Color Observations.” Remote Sensing of Environment 231: September. doi:10.1016/j.rse.2019.111249.
- Ren, Jingli, Zhubin Zheng, Yunmei Li, Guonian Lv, Qiao Wang, Heng Lyu, Changchun Huang, Ge Liu, Chenggong Du, and Meng Mu. 2018. “Remote Observation of Water Clarity Patterns in Three Gorges Reservoir and Dongting Lake of China and Their Probable Linkage to the Three Gorges Dam Based on Landsat 8 Imagery.” Science of the Total Environment 625: 1554–1566. doi:10.1016/j.scitotenv.2018.01.036.
- Shi, Kun, Yunlin Zhang, Yongqiang Zhou, Xiaohan Liu, Guangwei Zhu, Boqiang Qin, and Guang Gao. 2017. “Long-term MODIS Observations of Cyanobacterial Dynamics in Lake Taihu: Responses to Nutrient Enrichment and Meteorological Factors.” Scientific Reports 7 (1): 1–16. doi:10.1038/srep40326.
- Shi, Kun, Yunlin Zhang, Guangwei Zhu, Xiaohan Liu, Yongqiang Zhou, Hai Xu, Boqiang Qin, Ge Liu, and Yunmei J. Li. 2015. “Long-term Remote Monitoring of Total Suspended Matter Concentration in Lake Taihu Using 250 m MODIS-Aqua Data.” Remote Sensing of Environment 164: 43–56. doi:10.1016/j.rse.2015.02.029.
- Shi, Kun, Yunlin Zhang, Guangwei Zhu, Boqiang Qin, and Delu Pan. 2018. “Deteriorating Water Clarity in Shallow Waters: Evidence from Long Term MODIS and in-Situ Observations.” International Journal of Applied Earth Observation and Geoinformation 68: 287–297. doi:10.1016/j.jag.2017.12.015.
- Sun, Xianghan, Jianqiang Liu, Jianru Wang, Liqiao Tian, Qu Zhou, and Jian Li. 2021. “Integrated Monitoring of Lakes’ Turbidity in Wuhan, China During the COVID-19 Epidemic Using Multi-Sensor Satellite Observations.” International Journal of Digital Earth 14 (4): 443–463. doi:10.1080/17538947.2020.1868584.
- Tan, Wenxia, Jindi Xing, Shao Yang, Gongliang Yu, Panpan Sun, and Yan Jiang. 2020. “Long Term Aquatic Vegetation Dynamics in Longgan Lake Using Landsat Time Series and Their Responses to Water Level Fluctuation.” Water 12 (8): 2178. doi:10.3390/w12082178.
- Topp, Simon N, Tamlin M Pavelsky, Hilary A Dugan, Xiao Yang, John Gardner, and Matthew RV Ross. 2021. “Shifting Patterns of Summer Lake Color Phenology in Over 26,000 US Lakes.” Water Resources Research:E (2020W): R029123. doi:10.1029/2020WR029123.
- Tranvik, Lars J, John A Downing, James B Cotner, Steven A Loiselle, Robert G Striegl, Thomas J Ballatore, Peter Dillon, Kerri Finlay, Kenneth Fortino, and Lesley B Knoll. 2009. “Lakes and Reservoirs as Regulators of Carbon Cycling and Climate.” Limnology and Oceanography 54 (6part2): 2298–2314. doi:10.4319/lo.2009.54.6_part_2.2298.
- Urbanski, Jacek Andrzej, Agnieszka Wochna, Iwona Bubak, Waldemar Grzybowski, Katarzyna Lukawska-Matuszewska, Magda Łącka, Sylwia Śliwińska, Bożena Wojtasiewicz, and Marek Zajączkowski. 2016. “Application of Landsat 8 Imagery to Regional-Scale Assessment of Lake Water Quality.” International Journal of Applied Earth Observation and Geoinformation 51: 28–36. doi:10.1016/j.jag.2016.04.004.
- Van der Woerd, Hendrik Jan, and Marcel Robert Wernand. 2018. “Hue-angle Product for low to Medium Spatial Resolution Optical Satellite Sensors.” Remote Sensing 10 (2): 180. doi:10.3390/rs10020180.
- Vermote, Eric, Chris Justice, Martin Claverie, and Belen Franch. 2016. “Preliminary Analysis of the Performance of the Landsat 8/OLI Land Surface Reflectance Product.” Remote Sensing of Environment 185: 46–56. doi:10.1016/j.rse.2016.04.008.
- Vermote, Eric F, Didier Tanré, Jean L Deuze, Maurice Herman, and J.-J. Morcette. 1997. “Second Simulation of the Satellite Signal in the Solar Spectrum, 6S: An Overview.” IEEE Transactions on Geoscience and Remote Sensing 35 (3): 675–686. doi:10.1109/36.581987.
- Wang, Mengqiu, and Chuanmin Hu. 2016. “Mapping and Quantifying Sargassum Distribution and Coverage in the Central West Atlantic Using MODIS Observations.” Remote Sensing of Environment 183: 350–367. doi:10.1016/j.rse.2016.04.019.
- Wang, Shenglei, Zhongping Lee, Shaoling Shang, Junsheng Li, Bing Zhang, and Gong Lin. 2019. “Deriving Inherent Optical Properties from Classical Water Color Measurements: Forel-Ule Index and Secchi Disk Depth.” Optics Express 27 (5): 7642–7655. doi:10.1364/OE.27.007642.
- Wang, Shenglei, Junsheng Li, Qian Shen, Bing Zhang, Fangfang Zhang, and Zhaoyi Lu. 2014. “MODIS-based Radiometric Color Extraction and Classification of Inland Water with the Forel-Ule Scale: A Case Study of Lake Taihu.” IEEE Journal of Selected Topics in Applied Earth Observations and Remote Sensing 8 (2): 907–918. doi:10.1109/JSTARS.2014.2360564.
- Wang, Shenglei, Junsheng Li, Bing Zhang, Zhongping Lee, Evangelos Spyrakos, Lian Feng, Chong Liu, Hongli Zhao, Yanhong Wu, and Liping Zhu. 2020. “Changes of Water Clarity in Large Lakes and Reservoirs Across China Observed from Long-Term MODIS.” Remote Sensing of Environment 247: 111949. doi:10.1016/j.rse.2020.111949.
- Wang, Shenglei, Junsheng Li, Bing Zhang, Evangelos Spyrakos, Andrew N Tyler, Qian Shen, Fangfang Zhang, Tiit Kuster, Moritz K Lehmann, and Yanhong Wu. 2018. “Trophic State Assessment of Global Inland Waters Using a MODIS-Derived Forel-Ule Index.” Remote Sensing of Environment 217: 444–460. doi:10.1016/j.rse.2018.08.026.
- Webster, Katherine E, Patricia A Soranno, Kendra Spence Cheruvelil, Mary T Bremigan, John A Downing, Peter D Vaux, Timothy R Asplund, Linda C Bacon, and Jody Connor. 2008. “An Empirical Evaluation of the Nutrient-Color Paradigm for Lakes.” Limnology and Oceanography 53 (3): 1137–1148. doi:10.4319/lo.2008.53.3.1137.
- Wei, Jianwei, Zhongping Lee, Rodrigo Garcia, Laura Zoffoli, Roy A Armstrong, Zhehai Shang, Patrick Sheldon, and Robert F Chen. 2018. “An Assessment of Landsat-8 Atmospheric Correction Schemes and Remote Sensing Reflectance Products in Coral Reefs and Coastal Turbid Waters.” Remote Sensing of Environment 215: 18–32. doi:10.1016/j.rse.2018.05.033.
- Wei, Yang, Li Yuanxi, Liu Yu, Xu Mingxiang, Zhang Liping, and Deng Qiuliang. 2020. “Impacts of Rainfall Intensity and Urbanization on Water Environment of Urban Lakes.” Ecohydrology & Hydrobiology 20 (4): 513–524. doi:10.1016/j.ecohyd.2020.06.006.
- Wernand, Marcel R, Hendrik J van der Woerd, and Winfried WC Gieskes. 2013. “Trends in Ocean Colour and Chlorophyll Concentration from 1889 to 2000, Worldwide.” PLOS one 8 (6): e63766. doi:10.1371/journal.pone.0063766.
- Woerd, Hendrik J, and Marcel R Wernand. 2015. “True Colour Classification of Natural Waters with Medium-Spectral Resolution Satellites: SeaWiFS, MODIS, MERIS and OLCI.” Sensors 15 (10): 25663–25680. doi:10.3390/s151025663.
- Xiao, Yihua, Thomas Rohrlack, and Gunnhild Riise. 2020. “Unraveling Long-Term Changes in Lake Color Based on Optical Properties of Lake Sediment.” Science of the Total Environment 699: 134388. doi:10.1016/j.scitotenv.2019.134388.
- Xu, Yang, Lian Feng, Xuejiao Hou, Junjian Wang, and Jing Tang. 2021. “Four-decade Dynamics of the Water Color in 61 Large Lakes on the Yangtze Plain and the Impacts of Reclaimed Aquaculture Zones.” Science of the Total Environment 781: 146688. doi:10.1016/j.scitotenv.2021.146688.
- Xu, Xuan, Xiaolong Huang, Yunlin Zhang, and Dan Yu. 2018. “Long-term Changes in Water Clarity in Lake Liangzi Determined by Remote Sensing.” Remote Sensing 10 (9): 1441. doi:10.3390/rs10091441.
- Yin, Ziyao, Junsheng Li, Yao Liu, Ya Xie, Fangfang Zhang, Shenglei Wang, Xiao Sun, and Bing Zhang. 2021. “Water Clarity Changes in Lake Taihu Over 36 Years Based on Landsat TM and OLI Observations.” International Journal of Applied Earth Observation and Geoinformation 102: 102457. doi:10.1016/j.jag.2021.102457.
- Zhang, Enlou, Yanmin Cao, Peter Langdon, Richard Jones, Xiangdong Yang, and Ji Shen. 2012. “Alternate Trajectories in Historic Trophic Change from two Lakes in the Same Catchment, Huayang Basin, Middle Reach of Yangtze River, China.” Journal of Paleolimnology 48 (2): 367–381. doi:10.1007/s10933-012-9608-3.
- Zhang, Yunlin, Erik Jeppesen, Xiaohan Liu, Boqiang Qin, Kun Shi, Yongqiang Zhou, Sidinei Magela Thomaz, and Jianmin Deng. 2017. “Global Loss of Aquatic Vegetation in Lakes.” Earth-Science Reviews 173: 259–265. doi:10.1016/j.earscirev.2017.08.013.
- Zhou, Qu, Jianru Wang, Liqiao Tian, Lian Feng, Jian Li, and Qianguo Xing. 2021. “Remotely Sensed Water Turbidity Dynamics and its Potential Driving Factors in Wuhan, an Urbanizing City of China.” Journal of Hydrology 593: 125893. doi:10.1016/j.jhydrol.2020.125893.