
 ?Mathematical formulae have been encoded as MathML and are displayed in this HTML version using MathJax in order to improve their display. Uncheck the box to turn MathJax off. This feature requires Javascript. Click on a formula to zoom.
ABSTRACT
The rising prosperity of Location-based Social Networks (LBSNs) witnessed an explosion in the availability of geo-tagged social media data, which enables tremendous location-aware online services, especially next point of interest (POI) recommendation. However, previous next POI recommendation studies usually adopt fix-length time windows for user check-in sequence modeling, leading to a limited capacity in capturing fine-grained user temporal preferences that easily change over time. Besides, existing methods often directly leverage multi-modal contexts as auxiliary to alleviate the data sparsity issue, which fails to fully exploit the sequential patterns of contextual information for inferring user interest drift. To address the above challenges, we propose a novel framework named iTourSPOT which extends traditional collaborative filtering methods with a context-aware POI embedding architecture. For enhancing temporal interests modeling capacity, we associate the context feature extraction with varying-length sessions and incorporate check-in frequencies of POIs as prior knowledge to instruct the session representation learning of our model. Moreover, a collaborative sequence transduction model is designed for joint context sequence modeling and session-based POI recommendation. Experimental results on a real-world geo-tagged photo dataset clearly demonstrate the effectiveness of the proposed framework when compared with state-of-the-art baseline methods, especially in both sparse and cold-start scenarios.
1. Introduction
Thanks to the rising prosperity of location-based social networks (LBSNs) like Foursquare, Gowalla, and GeoLife, recent decades have witnessed an explosion of check-in points-of-interest (POIs) associated with contexts (e.g. timestamp, categories, location, and visual content) (Logesh et al. Citation2019; Gasparetti et al. Citation2019; Bujosa, Torres, and Riera Citation2018), which shows promise for the task of next POI recommendation (Feng et al. Citation2015). The next POI recommendation aims to predict POIs that a user will likely visit in the near future through additional consideration of sequential patterns of user behaviors other than their general preferences (Shoujin Wang et al. Citation2019).
One of the significant challenges for the next POI recommendation is how to capture users' temporal preferences that easily change over time. Such temporal dynamics of user preferences on POIs usually present in two aspects. On the one hand, users may prefer to visit specific POIs at specific timestamps, for example visiting public parks in the morning while going to shopping malls at night. On the other hand, there is always a particular chronological order between users' check-ins, which also reflects user interest drift (Zhao et al. Citation2019). For example, although both the two users like to have dinner after school, user A prefers to go to the gym after dinner, while user B goes to watch movies. Expect users' general preferences that can be directly derived from their check-in histories. However, the temporal information of individual user's check-in sequences (i.e. short-term preferences) is hard to be exploited by traditional collaborative filtering or matrix factorization methods (Aliannejadi, Rafailidis, and Crestani Citation2019). Failing to capture transition patterns of user interests often leads to the low diversity of recommendation lists (Shoujin Wang et al. Citation2019).
To this end, several studies (Rendle, Freudenthaler, and Schmidt-Thieme Citation2010; Yuan et al. Citation2013; Majid et al. Citation2015; Hidasi et al. Citation2015) seek to adopt fixed-length time windows (i.e. sessions) to capture user interest drift within periods. For instance, Yuan et al. (Citation2013) leveraged temporal information to recommend POIs for a given user at a specific time in a day. Majid et al. (Citation2015) considered contextual information like date and weather and conducted sequential pattern mining to capture user preference within the fixed time interval. Hidasi et al. (Citation2015) apply recurrent neural networks to infer short-term user preference with manually defined sessions. However, user preference identification in such an inflexible manner may undermine the integrity of user check-in sequences and ignore the temporal dynamics of users' interests (Ding and Chen Citation2018; Shoujin Wang et al. Citation2019; Jiacheng Li, Wang, and McAuley Citation2020). This is mainly because, as representative implicit feedback, check-in data only reflects the interactions between users and POIs without any explicit ratings or comments (Aliannejadi, Rafailidis, and Crestani Citation2019). Check-in sequence segmentation in such an implicit scenario does make user short-term preferences more accessible, but the results may be unreliable due to the lack of prior knowledge. We argue that places with higher check-in frequency are more crucial in modeling user preferences than those with fewer check-ins. This observation motivates us to incorporate check-in frequencies of POIs as prior knowledge for user preference modeling and arrange individual users' check-in histories into varying-length sessions.
In addition, the data sparsity problem also poses significant challenges for the next POI recommendation (Aliannejadi, Rafailidis, and Crestani Citation2019; Zhao et al. Citation2019). While there are plenty of POIs in LBSNs, an individual user is just able to visit a handful of locations. This may be even worse in the session-based scenario because the number of check-ins within a particular session is rather less compared to the original sequence. In the literature, an intuitive solution for data sparsity issues is incorporating multi-modal contextual information of POIs as the auxiliary for the original check-in data (Feng et al. Citation2015; Aliannejadi, Rafailidis, and Crestani Citation2019; Zhao et al. Citation2019). In recent years, temporal dynamics and geographical constraints like time, location, weather, and social media sentiment have gradually been proven to be effective for the next POI recommendation (Zhang and Wang Citation2015; Yin et al. Citation2016; Villegas et al. Citation2018). However, most of them directly take the feature vectors derived from contexts as the network input while ignoring the sequential patterns of contexts. We argue that contextual constraints may evolve together with user preferences over time. For example, weather conditions could change very rapidly within one day, which definitely affects users' visiting behavior. In such a scenario, user preferences could vary dramatically, but current methods are insufficient to identify such co-evolving patterns between user preferences and contexts, leading to unsatisfactory recommendation results.
In this paper, we propose a novel recommender framework iTourSPOT for personalized next POI recommendation tasks in location-based social networks (LBSNs). Firstly, we thoroughly analyze the difficulties of the next POI recommendation. Based on the above analysis, this manuscript puts forward a flexible POI embedding framework for length-varying sessions-based recommendation. Considering multi-modal information associated with POIs, including weather conditions, spatial distribution, and visual contents, the proposed framework has the capability to extract context-aware representations for sessions. In order to capture sequential dependencies between adjacent sessions, a collaborative sequence transduction model is designed to predict an individual's next destination. From our experiments on the real-world geo-tagged dataset, we observe that our framework outperforms state-of-the-art methods on both sparse and cold-start issues.
The main contributions of this paper are summarized as follows:
We propose a novel context-aware recommendation framework utilizing multi-modal contextual information, which is one of the pioneers to use length-varying sessions for user preference identification.
A novel sequential POI recommender architecture is designed for joint feature learning and session-based recommendation.
The performance of the proposed solution is evaluated thoroughly via experiments on a real-world geo-tagged photo dataset from LBSNs. The results of the Top-N recommendation surpass state-of-the-art methods, which is a strong verification of the superiority of our approach.
The rest of this paper is organized as follows. Section 2 mainly deals with the relevant research on the next POI recommendation. In Section 3, we formulate our research problem and give an overview of the proposed framework. When it comes to Sections 4 and 5, the technical details of journey feature extraction and user preferences identification involved in iTourSPOT are elaborated, respectively. What's more, extensive experiments on real-world datasets collected from Beijing, which evaluates the recommendation performance of the proposed framework, are described in Section 6. Last but not least, Section 7 mainly discusses the conclusions and future research directions of our work.
2. Related work
There seems mainly two lines of related literature for our work, named context-aware and next POI recommendation, respectively. In this section, we review the recent advances in both directions.
2.1. Context-aware POI recommendation
Context-aware POI recommendation aims to exploit the contextual information involved with check-in records (i.e. POI category, geographic location, or the timestamp) for more accurate user preference identification. Over the past five years, temporal dynamics and geographical constraints like time, location, weather, and social media sentiment have gradually been proven to be effective for context-aware POI recommendation (Zhang and Wang Citation2015; Yin et al. Citation2016; Villegas et al. Citation2018). For example, the geographical influence which indicates that users tend to visit nearby POI from the previous POI (Ye et al. Citation2011). Vahidnia (Citation2022) implies that the similarity of POI can be obtained by spatial kernel weighting, which was previously used in the geographically weighted regression. Thus, higher weight values generated by the spatial kernel function are applied to them. With the rapid accumulation of social media data in LBSNs, recent research interest in context-aware POI recommendation has been extended to multi-modal context modeling that maps heterogeneous tour contexts into unified latent space. Specifically, Majid et al. (Citation2015) acquired tourist attractions in a city through geo-tagged photos clustering and modeled users' check-in sequences with weather and temporal information. Following their work, Korakakis, Mylonas, and Spyrou (Citation2016) further leveraged more spatio-temporal data to capture the trajectory patterns of tourists and determined the most popular POIs in any given city. Cesario, Comito, and Talia (Citation2017) propose the trajectory pattern miner algorithm to detect dense regions and analyze patterns from these regions. Huayu Li et al. (Citation2016) exhibit a collaborative POI recommendation algorithm by means of geographical, social, and categorical associations on user and POI sides, respectively. Comito (Citation2018) use social media data like Twitter to analyze the context pattern of users' POI with a particular trajectory similarity measurement. Aliannejadi and Crestani (Citation2018) addresses the data sparsity problem by performing personalized boosting of location keywords in a user's check-in history. Ding and Chen (Citation2018) utilize the deep neural network to incorporate various contexts and learn their joint influence on user behavior. Wan et al. (Citation2018) present BAyes-Knn, a hybrid ensemble learning algorithm to predict tourist routes by mining their geographical preferences. Sun et al. (Citation2019) propose a two-stage model consisting of a support vector machine and gradient boosting regression tree for candidate ranking, which effectively mitigates the cold start situation and long tail data issues. In this study, we apply a user-based collaborative filtering method and model the geographical influence by mining massive user historical trajectory data. The neighborhood relationships between POIs are evaluated by order of users' visits in a sequential manner instead of traditional geographical distance.
2.2. Next POI recommendation
The next POI recommendation models each user's travel history as a sequence of POIs visited previously and aimed to predict the next POI that a user prefers to visit based on existing sequential patterns. In literature, it has been proven that the interpretation of users' short-term preferences plays a predominant role in the next POI recommendation since it directly reflects their current travel intention. From a methodology perspective, existing studies followed a session-based strategy that splits users' sequential check-in records into fix-length sessions according to timestamps. For example, Yuan et al. (Citation2013) split one day into multiple equal time slots down to the hour and acquired users' short-term preferences from each time slot, respectively. Cheng et al. (Citation2013) propose a tensor-based model, named FPMC-LR, that leverage first-order Markov Chains to model POI transitions under corresponding distance constraints. Inspired by recent advances in the natural language processing (NLP) field, some researchers propose to apply state-of-the-art sequence transduction models for a more accurate next POI recommendation. For instance, Feng et al. (Citation2015) utilize personalized ranking metric embedding to integrate sequential information, individual preference, and geographical influence for personalized next POI recommendation. Xie et al. (Citation2016) establish bipartite graphs according to user interaction sequences and embedded context factors with a unified dimension reduction pipeline. Zhao et al. (Citation2019) focus on the spatio-temporal intervals between adjacent check-ins and propose a long short-term memory network(LSTM) to capture such spatio-temporal relationships. Massimo and Ricci (Citation2018) propose a novel approach to model user behavior based on inverse reinforcement learning. Jiacheng Li, Wang, and McAuley (Citation2020) consider absolute lengths of time intervals between adjacent interactions and improved transformer model with time interval aware self-attention. Comito (Citation2020) leverage frequent pattern mining and feature-based supervised classification to extract spatial-temporal features and a decision tree model to make POI recommendations. Bao et al. (Citation2021) apply bidirectional long short-term memory network (BiLSTM) and convolutional neural network to extract contextual characteristics of users' arrival sequence from geotagged social media data.
3. Preliminaries
3.1. Problem formulation
The context-aware POI recommendation framework proposed in this paper takes users' previous sequential footprints under corresponding tour contexts as training data. It aims to predict POIs that users prefer to visit in the near future. More formally, let U and P represent the user and POI set respectively, for a specific user u, the user's footprint sequences denoted as where
is a tuple of POI p, corresponding contexts c, and timestamp ts. In this study, we involve climate, POIs' geographic distribution, and travel photographs as contextual information. That is, the ith footprint of traveler
will be defined as:
(1)
(1) Given the previous interaction sequences
of all users, the personalized next POI recommendation task is to generate a list of POIs from P for each user and evaluate whether the POIs in
will be exhibited in the list. Here, following the normative semiotic system, we use upper case bold letters to denote matrices, lower case bold letters to denote column vectors unless otherwise specified, and non-bold letters to represent scalars. The major abbreviations are listed in .
Table 1. List of abbreviations used throughout the paper.
3.2. Framework overview
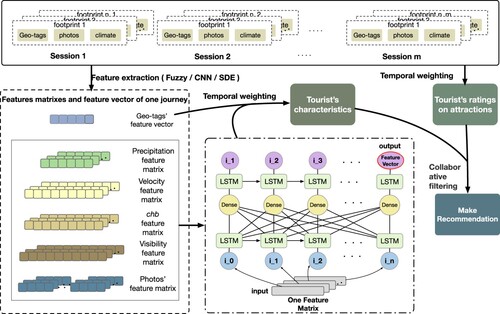
In this paper, we proposed a context-aware framework, iTourSPOT, that leverages user check-in sequences and multi-modal contextual information to make personalized next POI recommendations. To this end, our framework included three main components: (1) density-based session segmentation, (2) context-aware session feature extraction, and (3) jointly sequential pattern learning and user preference modeling. As shown in , iTourSPOT first segment users' footprints into varying-length sessions with density-based clustering techniques according to their timestamps and further associate session feature extraction with corresponding weather information, spatial patterns, and visual patterns of travel photos. The outputs of the previous two modules are fed to an LSTM-based sequential POI recommender architecture for jointly sequential pattern learning and user preference modeling. The final recommendation score of each POI will be generated according to user preferences via temporal weighting and collaborative filtering. In contrast, POIs with top-N scores will be recommended to the corresponding user.
Figure 1. An overview of iTourSPOT framework. Users footprints and corresponding contexts are fed into a session segmentation module to generate varying-length sessions. After context-aware session feature extraction, we employ a LSTM-based structure with Gaussian temporal weighting to capture users' long- and short-term preferences and calculating the ultimate recommendation scores through collaborative filtering.
4. iTourSPOT for personalized next POI recommendation
In this section, we present technical details of the proposed recommendation framework. The iTourSPOT framework takes users' historical footprints, and corresponding contextual information as inputs, counts the personalized next POI recommendation task as a binary classification problem and makes recommendations according to the output score for each POI.
4.1. Personalized session splitting
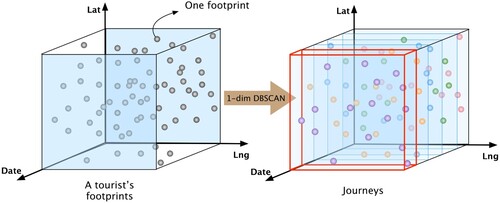
In order to capture the transition patterns of each user's preference accurately, it is crucial to determine appropriate time granularities for preference identification. Previous studies (Gao et al. Citation2013; Xin Li et al. Citation2015; Lyu et al. Citation2019) frequently follow the time sliding window-based strategy that aggregates users' adjacent footprints through fixed-length time intervals like one day, one week,or one month. Unfortunately, such approaches are so inflexible that they inevitably destroy the intrinsic nature of many temporal dynamics. In iTourSPOT, we seek to map individuals' historical footprints into vary-length sessions to capture tourists' short-term preferences in a dynamic manner. As there might be multiple footprints in a particular POI, it is essential to recognize the amount of POIs during data preprocessing. To this end, we follow the same strategy adopted by Lim et al. (Citation2016), Jiang et al. (Citation2016) Vu et al. (Citation2015), and Xiaolu Zhou, Xu, and Kimmons (Citation2015) and employ the existing POI bounds and roads networks to map users' footprints into existing POIs. Considering the impact of the off-peak season on tourist preference, we adopt a time-based DBSCAN algorithm to cluster individuals' footprints into various sessions according to their time density (Khan et al. Citation2014). . gives an interpretation of our algorithm. The algorithm starts with the first footprints in the dataset and retrieves all neighbors of this footprint within Euclidean distance. If the total number of these neighbors exceeds MinPts, a new session will be created, and the footprint with its neighbors will be assigned to this new session. The process is repeated until all of the footprints have been processed. Additionally, we apply the 3-dimensional R-tree index to maintain the distance information and speed up the query process.
Figure 2. The session segmentation process via time-based DBSCAN algorithm. As a result, tourists' original footprints are mapped into varying-length sessions based on their time density.
Algorithm 1 Splitting Footprints into Varying-alg1 Length Sessions
Input: , and
, the minimum the interval of time stamps
Output: sessions of (
,
,…)
1: initialize the set of clustered footprints , and the index of sessions
2: sort footprints in in chronological order according to their time stamps
3: for i in range() do
4: if in
then
5: continue
6: else
7: add into
and
, and define
as a neighbors set of
8: for in range(
) do
9: if in
OR
then
10: continue
11: else if then
12: add into
13: else
14: break
15: end if
16: end for
17: for in N do
18: if in
then
19: continue
20: else
21: add into
and
22: for in range(
) do
23: if in
OR
then
24: continue
25: else if the difference between the time stamps of and
is not bigger than
then
26: add into
27: else
28: break
29: end if
30: end for
31: end if
32: end for
33: k = k + 1
34: end if
35: end for
4.2. Context-aware session feature extraction
Within the POI recommendation field, one of the most effective contexts that count in the interpretation of user preferences is climate conditions and geographical constrains (Yuan et al. Citation2013; Zhang and Wang Citation2015; Yin et al. Citation2016; Villegas et al. Citation2018). This section demonstrates the technical details of context-aware session feature representation involved in iTourSpot from multiple perspectives.
4.2.1. Climate preferences
Climate is a determinant factor for tourism, influencing travelers' motivation and choice of destination. Different weather conditions such as cold, rain, snow, or heat may impact the user's comfort and experience. Meanwhile, visitor preferences and sensitivity to climate and weather in tourism can be derived from related weather variables owing to the multifaceted nature of the atmospheric environment of destinations (Hewer, Scott, and Gough Citation2018; Steiger, Abegg, and Jänicke Citation2016; De Freitas Citation2015). Several efforts have been made to explore the climate preferences of tourists in different types of destinations (Førland et al. Citation2013; Day et al. Citation2013; Capriello et al. Citation2013). However, most of these researches focus on either measuring and rating of weather conditions for specific tourist destinations (Georgopoulou et al. Citation2018; Bujosa, Torres, and Riera Citation2018; Jeuring Citation2017), or identifying the optimal or ideal climate conditions for tourism (Scott et al. Citation2016) through questionnaires and so on. These studies are rarely founded on tourists' actual in-situ perceptions of weather at specific destinations. Therefore, considerable attention has been paid to climate as a destination attribute (Dubois et al. Citation2016). On the other hand, good and bad weather may vary with circumstances and an individual's current preferences, rather than being absolute concepts. Therefore, users' satisfaction is likely to be at least partly weather dependent, and we can employ such satisfactions to model user preferences for more accurate POI recommendations.
In iTourSPOT, we involved climatic factors such as precipitation (rain), temperature (T), humidity (Rh), wind velocity (vel),and visibility (view) to reflect characteristics of each session. Specifically, as shown in Equation (Equation2(2)
(2) ), we further introduce the comfort of human body index (chb) as combination of the T, Rh and vel to evaluate the weather condition in a more personalized manner.
(2)
(2) where the units of T, Rh and vel are
C,
and
respectively.
In reality, it is tough to accurately indicate the classification threshold between ‘hot’ and ‘cold’ through traditional probability-based or count-based methods. Accordingly, we employ the fuzzy set proposed by Zadeh (Citation1978) to distinguish complex climate states due to its inherent ability to represent uncertainty and vagueness with membership functions. The following membership functions are designed according to Equation (Equation3(3)
(3) ) and grade scales of Rain, Vel, View and chb (–).
(3)
(3) where
,
is the support of the fuzzy number and b is the center. We use the notation
to refer to a triangular fuzzy number.
Table 2. The scales of wind velocity.
Table 3. The scale of precipitation in 24 hours.
Table 4. The scale of visibility.
Table 5. The scale of comfort of human body index.
Accordingly, states of rain, vel, view and chb can be incorporated into the corresponding fuzzy number vectors ,
,
,
to generate a better representation of one footprint's climatic attributes. Thereafter, all footprint feature vectors in a particular session
are integrated to obtain this session's four climatic feature matrices, denoted as
,
,
,
, respectively, where
4.2.2. Spatial patterns
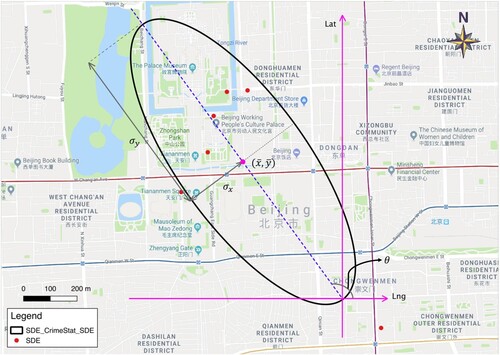
In addition to climate, the geographical distribution of users' footprints is another important context for preference identification. To capture spatial patterns of sessions, we introduce the standard deviation ellipse (SDE) (Bin Wang, Shi, and Miao Citation2015), which explores the geographical distribution of travel behaviors to facilitate the policy-making to cope with urban tourism reduction. SDE delineates spatial points by using three measures: average location, dispersion (or concentration) and orientation (). Besides classical mean center measurement, weighted mean or median are also adopted into different SDE variants. In iTourSPOT, we use average center location ( and
) of discrete points to summarize their spatial characteristics of geographic features, such as central tendency, dispersion, and directional trends.
(4)
(4) where θ is rotation of this ellipse, A and B equal
and
, respectively. Now, it is convenience to obtain ellipse's major axis and minor axis.
(5)
(5)
(6)
(6) Afterwards, parameters of one standard deviation ellipse, ie.
,
, θ,
,
, are integrated to construct the spatial feature vectors of the corresponding session
.
(7)
(7)
Figure 3. The standard deviation ellipse of footprints in one session.
4.2.3. Visual contents
People often choose to embed geographic information referring to POIs into travel photos when uploading them to online social platforms. These images contain rich information about user preferences and informative descriptions of POIs, i.e. shapes, structures and textures. For example, a user who posts many architectural photographs is more likely to visit famous landmarks. At the same time, one who uploads some images of grassland has more incentive to visit natural landscapes.
In iTourSPOT, photos' features are decoded by the deep convolutional neural networks (DCNN), one robust artificial neural network for learning high-level visual patterns for image classification and object detection (Suhang Wang et al. Citation2017). Furthermore, we leverage the ResNet50 network, composed of 49 convolutions, one fully connected, one max pooling, one average pooling and 18 ReLu layers, for photo feature representation. The network input is an image of size , where
is the size of the image and 3 is the number of channels, i.e. RGB channels.
Specially, we pretrained our model on Place365-Stand database (Bolei Zhou et al. Citation2017) that has more than 1.8 million images from 365 scene categories based on the transfer learning theory (Morales, Huamán, and Telles Citation2018). The final outputs of this DCNN model are vectors of size (Equation (Equation8
(8)
(8) )).
(8)
(8) where
is the ResNet50 model, and
is the photos' features matrix of
, through combining photos' features of all footprints with their corresponding sessions.
5. User preferences identification and POI recommendation
This section describes our approach to user preference identification and final POI recommendation. We conduct an LSTM-based workflow which considers both the content relevance and sequential dependencies between adjacent tour contexts and interactively models the relations of users' long-term and short-term preferences.
5.1. User preference identification
One of the critical challenges in a personalized sequential recommender system is that it requires us to infer both users' short-term and long-term preferences with latent transition patterns. We get the representations of each journey as travel sequences from the weather, spatial, and visual aspects as mentioned in Section 4. How to aggregate such contexts and leverage their sequential dependencies to interpret travelers' short-term preferences is one of the critical challenges in iTourSpot. Inspired by recent advances in natural language processing, LSTM (Greff et al. Citation2017) has shown promising capacity in detecting long-term and short-term dependencies hidden in such sequential data. Compared to previous studies that apply LSTM to model users' interaction sequence directly, in this paper, we utilize it to exhibit the sequential dependency of tour contexts. This is even more necessary in the context-aware sequential recommendation, as contexts may also change over time. We take each journey as a text, every footprint as a word, and then employ the LSTM cell to capture the transition patterns of user short-term preferences under changeable contexts.
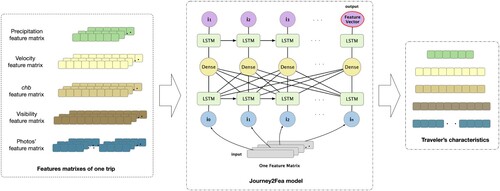
As shown in , our model involves two LSTM layers and one Dense layer and produces the aggregate feature representation of each journey through the last cell in the second LSTM layer. We use the final outputs as the embedding vectors of users' short-term preferences, which can be denoted as:
(9)
(9) where
.
Figure 4. The embedding process of LSTM-based workflow.
The optimization objective is to find parameters that yield predictions that are close to the actual choice, i.e.
(10)
(10) where y is the ground truth,
represents the prediction.
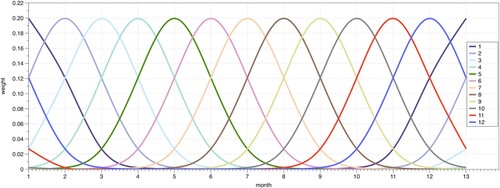
Since it is evident that users' long-term preference is the combination of short-term ones, and each element may have different importance to the final results, in iTourSPOT, we adopt the attention mechanism through Gaussian kernel functions (Kusano, Hiraoka, and Fukumizu Citation2016) to weight the past journeys while considering the influence of year and month, simultaneously. Attention mechanism has become a core component of various sequence modeling tasks without regard to their distance in the input or output sequences. Due to there is a considerable difference in POIs' popularity between the high season and low season in the tourism industry (de Queiroz Falcão et al. Citation2018), in this paper, we further introduce a novel distance metric (Equation (Equation11(11)
(11) )) into the original attention mechanism to measure the difference between months by considering the cyclicality of seasons ().
(11)
(11) And the ultimate weighted function can be denoted as follow:
(12)
(12) where
, and t is the current time under month and year level respectively.
Figure 5. The influences of different months according to their cyclicality.
Eventually, we aggregate feature representations of each individual's whole journeys through temporal weighting as the overall preferences of users, which can be further used to make a personalized recommendation.
(13)
(13) where
is the trip's number of tourist u up to time t.
5.2. Make recommendation
The personalized top-N recommendation can seem like synthesizing rating prediction and ranking tasks. Regarding the rating prediction stage, the inherent cold-start issue always poses great challenges to the recommendation accuracy. At the same time, this is even more serious in POI recommender systems as there are many tourists without any footprints. To relieve this problem, we introduced collective wisdom for the preference prediction of such cold-boot travelers utilizing existing tourists' characteristics. Specifically, based on the assumption that cold-boot tourists will plan their first trips more likely than people who just experienced the interest in travel, we randomly selected α of tourists with less than two footprints. We used the mean value of their preference embedding vectors to represent the preferences of a specific cold-boot tourist. Due to the sequential recommendation scenario, we primarily calculate historical ratings for each POI and leverage the results to evaluate the current rating scores of each user. As shown in Equation (Equation14(14)
(14) ), the ratings of historical traveler u in POI poi up to date t, depends on the temporal information and check-in times.
(14)
(14) where
is an indication function, it equals 1 if
, equals 0 otherwise.
Then, based on collaborative filtering, users' current ratings can be estimated through similarities between their embedding vectors. Since we involved multimodal tour contexts in the preference identification process, when calculating user similarities, we assigned personalized weights to specific context according to their impact on user preferences shown in Equation (Equation15(15)
(15) ).
(15)
(15) where
,
and
stand for mean, standard deviation and cosine similarity method respectively.
In addition, the number of each user's journeys is also involved into the similarity calculation and the ultimate similarity metric are defined as follow:
(16)
(16) We select β most similar travelers and employ their historical rating to obtain the current rating of a specific user. POIs with the top-N ratings are recommended for performance evaluation.
(17)
(17) where
means the predicting rating of traveler
for tourist attraction poi at date t.
6. Experiments and discussions
In this section, we demonstrate the effectiveness of iTourSPOT by conducting comprehensive experiments on a multimodal social media dataset collected from Beijing between January 2006 and May 2016. Our experiments are designed to answer the following research questions:
| RQ1: | Can the proposed framework outperform state-of-the-art baselines for the next POI recommendation tasks? | ||||
| RQ2: | Is our framework effective for the cold start issue? | ||||
| RQ3: | Which dynamic or static journey partition is more suitable for the next POI recommendation? | ||||
| RQ4: | Are all involved contexts helpful in this model? | ||||
| RQ5: | How do the hyper-parameters affect the overall performance, such as the minimal distance for the DBSCAN clustering algorithm, the number of most similar users we involved to address the cold start problem, and other weighting parameters we consider? | ||||
6.1. Datasets
Our experiments were mainly based on four interrelated multimodal datasets obtained from Beijing: (1) geo-tagged Flickr photos, (2) weather information, (3) road networks and (4) poi boundaries data. The geo-tagged pictures are obtained from Flickr.com and the weather data is obtained from Weather Underground. Among them, we performed a data quality control to ensure low-quality photos would not be considered. As s result, we involved 176,386 geo-tagged photos posted by 21,434 Flickr users from January 2006 to May 2016 as our primary concern by extracting the following information: Flickr ID, user ID, photo title, location information, photo description, acquisition time, and photo tag.
As mentioned in Section 2, data preprocessing was conducted before the main experiment to detect available POIs. Utilizing road networks and POI boundaries, all photos were mapped into the corresponding POIs through their geo-tags. However, there were many margin points out of the POIs' areas. We removed them as noise because most of them are posted in residential quarters or dormitories. All in all, the remaining 126,459 photos are mapped into 2000 different POIs, which can be roughly divided into 20 categories. We selected all photos taken before 2015 as the training set, while the remaining data were used to test the recommendation performance. and further exhibits some examples of our experimental datasets.
Table 6. Some examples of our geo-tagged photo dataset.
Table 7. Some examples of our weather data.
6.2. Evaluation metrics
We adopt two Top-N metrics, F1@N and Normalized Discounted Cumulative Gain(NDCG@N), to evaluate recommendation performance. F1@N measures the overall recommendation accuracy considering the classification precision and recall. NDCG@N emphasizes the ranking of ground truth and assigns higher weights to higher positions.
(18)
(18)
(19)
(19) where
represents the top-N POIs predicted by the model for user u at time t.
represents the ground truth of user u at time t. U is the set of all users.
(20)
(20)
(21)
(21) NDCG@N is the DCG@N normalized to [0, 1], where one signifies a perfect ranking.
Besides, in terms of the heterogeneity of contextual information, we design a novel similarity metric to measure the effectiveness of each context (Equation (Equation22(22)
(22) )). We also devise a specific evaluation method for spatial patterns (Equation (Equation23
(23)
(23) )) because the descriptions of its feature vectors are parameters of eclipses, which could not be compared through Equation (Equation22
(22)
(22) ).
(22)
(22)
(23)
(23) where
is the trip's prediction feature of u at time t,
,
and
are two SDEs, and
is employed to calculate the area of a circle, of which center is the average center of
and radius equals i, moreover,
is a function to measure common area of two circles.
For all metrics, higher value means higher performance.
6.3. Baselines and implementation details
To further verify the effectiveness of iTourSPOT, we involved five benchmark methods as baselines:
| Most popular. | This is the simplest baseline that makes recommendations only according to POIs' popularity. | ||||
| FPMC (Rendle, Freudenthaler, and Schmidt-Thieme 2010). | This method applies matrix factorization to first-order Markov Chains and captures users' long-term preferences and temporal dynamics simultaneously | ||||
| GRU4Rec+ (Hidasi et al. 2015). | Models user interaction sequences with GRU units for the session-based recommendation. Compared to its original version, this variant chooses a reformative loss function and sampling strategy that achieves tremendous improvement in accuracy. | ||||
| TMF (Lo et al. 2018). | It develops a temporal matrix factorization (MF) approach for tracking concept drift in each tourist latent vector, and the number of time slices in this model is set as one year. | ||||
| FUP (Xu and Watada 2014). | This model transforms rating schema into fuzzy user profiles to record users' preferences. It can deal with different system rating schema and improve the scalability of recommender systems. In this model, we set k to be 25 and use the quarter and three-quarters of the tourist scores as the lower and upper bounds, respectively. | ||||
For GRU4Rec+, we used code provided by the corresponding authors. For FPMC, TMF, and FUP, we implemented them using TensorFlow. For all hyper-parameters, we used the best combination suggested in the original paper. We implemented iTourSPOT with TensorFlow. All parameters are initialized using truncated normal distribution in the range of . We train the model using Adam with a learning rate of 1e−4, weight decay of 0.01, and linear decay of the learning rate. All the models are trained end-to-end without pre-training on a single NVIDIA GeForce GTX 1080Ti GPU with a batch size of 128.
6.4. Overall recommendation performance comparison
As a data-driven research direction, recommender system allows for promising results when obtaining High-quality data, that is, the more data used for model training, the higher recommendation performance will be achieved. However, the historical travel records were quite sparse for POI recommendation, or rather there were less than 2 visit records for most POIs, which may contribute to unexpected predictions. To alleviate this problem, we replaced specific POIs with their categories and evaluated the performance of iTourSPOT by applying it to next POI recommendation tasks.
summarizes the best results of all models on the experimental dataset (RQ1). The last column is the performance of the proposed iTourSPOT framework. It can be observed that:
Table 8. Comparisons between integrating distinct tour contexts with different F-measure (old user).
The non-personalized, most popular approach exhibits the worst performance since it does not depict users' personalized preferences through historical travel records. Among all the baselines, Sequential models(FPMC and GRU4Rec+) outperform non-sequential methods (TMF and FUP) on all evaluation metrics comprehensively, which verifies that considering sequential dependencies of user behaviors is beneficial to improving performances in recommender systems. Among sequential recommendation baselines, GRU4Rec+ outperforms FPMC on our sparse experimental dataset. This observation suggests that the deep neural network is a more powerful tool for the next POI recommendation than traditional Markov-chain based methods.
According to , it is obvious that iTourSPOT framework performs best among all models on the experimental datasets in terms of all evaluation metrics. There are 13.6% F1 and 5.7% NDCG average improvements against the most outstanding baseline. Although the TMF model utilizes a time sliding window for journey partition and introduces many temporal patterns, it still suffers from the sparse data issue because of the insufficient window size. This will definitely affect the performance of matrix factorization. The FUP approach employs a fuzzy method and clustering algorithm to find similar tourists. However, it is still hard to relieve the cold start problem, which influences the prediction of user ratings on POIs. Additionally, both overlook the influences of climate factors (i.e. humility) and the changeable user attention during the trip, which may reflect a large number of travelers' potential preferences.
The possible explanations for the performance improvement may be that, on the one hand, our framework takes advantage of the flexible observation granularity, which can produce multi-length time intervals for preference identification, while previous models only leverage fixed-length time sliding window. On the other hand, iTourSPOT is beneficial for interpreting the sequential transitions of tour contexts when facing the cold-start problem. We will further discuss the effect of the two factors in the following sections, respectively.
6.5. Effectiveness of iTourSPOT for the cold start problem
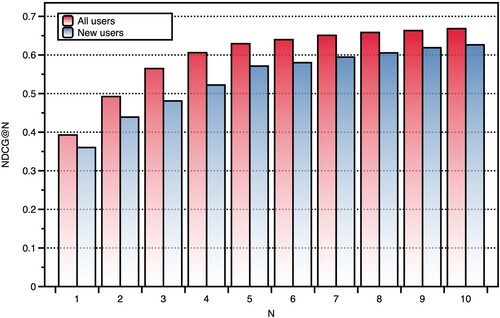
Since users may only visit a few POIs during their trips, the inherent cold-start problem poses a great challenge to the accuracy of the next POI recommendation. Specifically, there are 367 cold-boot users without any travel records in the test set. In iTourSPOT, we leverage collective wisdom to address this issue by considering the average preference of α of users with less than two travel records (α is set from 0.1 to 1). The NDCG@N (N from 1 to 10)is used to evaluate the recommendation performance for cold-boot users compared to the performance of all users.
According to , iTourSPOT can well predict the next POI for cold-boot users, which indicates that the collaborative social wisdom used in our framework can effectively alleviate the cold start problem(RQ2).
Figure 6. Evaluate the performance of iTourSPOT on cold-boot users and all users with NDCG@N.
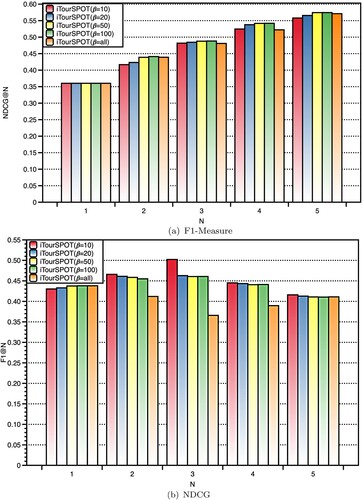
In iTourSPOT, we leverage the hyperparameters β to select users according to their preference similarity and apply collective wisdom to alleviate the cold start problem. shows F1-measure and NDCG for β from {10,20,30,40,50,all} while keeping the other optimal hyperparameters unchanged (RQ5). In most cases, a larger β leads to better recommendation performance. Besides, when β is set to 100, the best average performance can be observed on the experimental dataset.
Figure 7. Evaluate the influence of hyperparameter β in iTourSPOT with F1-measure and NDCG. (a) F1-Measure and (b) NDCG.
6.6. Comparisons of different time granularity
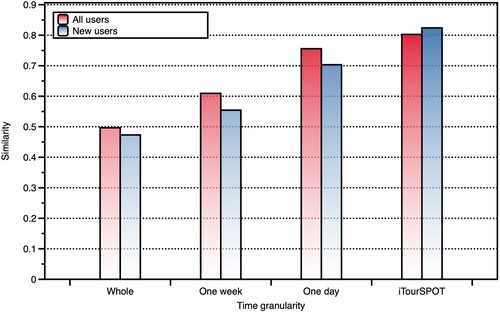
Given the motivation for comparing the performance of models which only use static time sliding windows, we let iTourSPOT only consider fixed-length time intervals during the journey partition process. We involve time granularity used in previous studies such as one day, one week, and whole travel records and use our own-designed similarity (Equation (Equation22(22)
(22) )) for comparison.
summarizes the results of all observation granularity on the experimental dataset (RQ3). It is obvious that the dynamic observation granularity used in iTourSPOT does improve the recommendation performance. Among all static methods, the non-partition one, which considers all travel records as a whole, gives the worst performance. Meanwhile, Finer granularity shows better performance as travel records within one day may reflect users' short-term preferences in a relatively accurate manner.
Figure 8. Compare the performance of iTourSPOT and other static partition methods through the similarity metric.
6.7. Effectiveness of involving tour contexts
In iTourSPOT, we consider climate, spatial patterns and visual contents as tour contexts for journey feature representation. In this section, we evaluate the performance of context-aware journey feature representation through the permutation and combination strategy. Specifically, we divide our baselines into two categories: (1) considering only one context and (2) combining any two contexts, e.g. climate and visual contents, to compare prediction results with the features of the user's next journey. Specifically, We leverage extensive F-Measure as evaluation metrics as follows:
(24)
(24) Furthermore, when it comes to the cold-boot user, we compared models' performances against regular users. and shows the significant improvements achieved by integrating multi-modal tour contexts for user preference identification, which also showed definitely effectiveness on solving cold-start problem (RQ2 and RQ4).
Table 9. Comparisons between integrating different tour contexts with different F-measure (cold-boot user).
Table 10. Comparisons between integrating different tour contexts with different F-measure (regular user).
7. Conclusions and future work
In this study, we proposed a framework iTourSPOT for the next POI recommendation tasks. iTourSPOT leverage density-based partition algorithm to obtain multi-length journey and capture users' short-term preferences by incorporating multimodal contextual information. We emphasize the sequential dependencies of tour contexts and leverage an RNN-based workflow to interpret such transition patterns with the state-of-the-art attention mechanism.
To evaluate the performance of iTourSPOT, we proposed novel evaluation metrics based on the similarity to measure the accuracy of journey feature representation and evaluate the recommendation performance with general metrics F-measure and NDCG. A series of comparative experiments on a real-world geo-tagged social media dataset demonstrate that our framework achieves higher performance than other state-of-the-art models.
There is still much room for further research. First, we desire to incorporate more contexts (such as POIs around tourist attractions, traffic condition settings, reviews and more fine-grained user profiles extracted from social media) into our framework for more accurate tour recommendations. Moreover, from a practical application perspective, more spatial-temporal constraints such as the time required for the entire trip and the seasonal distribution states of different POIs should be considered. Another focus of our future work will be developing a mobile application based on iTourSPOT to recommend personalized itineraries and share travelers' wonderful experiences. We firmly believe that such an app would definitely simplify the plan-making process of travel and enhance the connection of all travelers.
Data availability statement
The data were derived from the following resources available in the public domain: https://www.flickr.com/
Disclosure statement
No potential conflict of interest was reported by the author(s).
Additional information
Funding
References
- Aliannejadi, Mohammad, and Fabio Crestani. 2018. “Personalized Context-Aware Point of Interest Recommendation.” ACM Transactions on Information Systems 36 (4): 1–28.
- Aliannejadi, Mohammad, Dimitrios Rafailidis, and Fabio Crestani. 2019. “A Joint Two-Phase Time-Sensitive Regularized Collaborative Ranking Model for Point of Interest Recommendation.” IEEE Transactions on Knowledge and Data Engineering 32 (6): 1050–1063.
- Bao, Yi, Zhou Huang, Linna Li, Yaoli Wang, and Yu Liu. 2021. “A BiLSTM-CNN Model for Predicting Users' Next Locations Based on Geotagged Social Media.” International Journal of Geographical Information Science 35 (4): 639–660.
- Bujosa, Angel, Cati Torres, and Antoni Riera. 2018. “Framing Decisions in Uncertain Scenarios: An Analysis of Tourist Preferences in the Face of Global Warming.” Ecological Economics 148: 36–42.
- Capriello, Antonella, Peyton R. Mason, Boyd Davis, and John C. Crotts. 2013. “Farm Tourism Experiences in Travel Reviews: A Cross-Comparison of Three Alternative Methods for Data Analysis.” Journal of Business Research 66 (6): 778–785.
- Cesario, Eugenio, Carmela Comito, and Domenico Talia. 2017. “An Approach for the Discovery and Validation of Urban Mobility Patterns.” Pervasive and Mobile Computing 42: 77–92.
- Cheng, Chen, Haiqin Yang, Michael R. Lyu, and Irwin King. 2013. “Where You like to Go Next: Successive Point-of-Interest Recommendation.” In Proceedings of the Twenty-Third International Joint Conference on Artificial Intelligence, 2605–2611. Beijing, China: AAAI Press.
- Comito, Carmela. 2018. “Human Mobility Prediction Through Twitter.” Procedia Computer Science134: 129–136.
- Comito, Carmela. 2020. “NexT: A Framework for Next-Place Prediction on Location Based Social Networks.” Knowledge-Based Systems 204: Article ID 106205.
- Day, Jonathon, Natalie Chin, Sandra Sydnor, and Keith Cherkauer. 2013. “Weather, Climate, and Tourism Performance: A Quantitative Analysis.” Tourism Management Perspectives 5: 51–56.
- De Freitas, C. R. 2015. “Weather and Place-Based Human Behavior: Recreational Preferences and Sensitivity.” International Journal of Biometeorology 59 (1): 55–63.
- de Queiroz Falcão, Roberto Pessoa, Andrea Ribeiro Carvalho de Castro, Estefanie Silva do Nascimento, Tania da Silva Barboza, and Jorge Brantes Ferreira. 2018. “Improving Business Performance of Budget Hotels Through Social Media.” Rev. ACADÊMICA Obs. INOVAÇÃO DO Tur. 12 (1): 45–65.
- Ding, Ruifeng, and Zhenzhong Chen. 2018. “RecNet: A Deep Neural Network for Personalized POI Recommendation in Location-Based Social Networks.” International Journal of Geographical Information Science 32 (8): 1631–1648.
- Dubois, Ghislain, Jean-Paul Ceron, Stefan Gössling, and C. Michael Hall. 2016. “Weather Preferences of French Tourists: Lessons for Climate Change Impact Assessment.” Climatic Change 136 (2): 339–351.
- Feng, Shanshan, Xutao Li, Yifeng Zeng, Gao Cong, Yeow Meng Chee, and Quan Yuan. 2015. “Personalized Ranking Metric Embedding for Next New POI Recommendation.” In Proceedings of the 24th International Conference on Artificial Intelligence, IJCAI'15, 2069–2075. Buenos Aires, Argentina: AAAI Press.
- Førland, Eirik J, Jens Kr Steen Jacobsen, Jon Martin Denstadli, Martin Lohmann, Inger Hanssen-Bauer, Hans Olav Hygen, and Hans Tømmervik. 2013. “Cool Weather Tourism under Global Warming: Comparing Arctic Summer Tourists' Weather Preferences with Regional Climate Statistics and Projections.” Tourism Management 36: 567–579.
- Gao, Huiji, Jiliang Tang, Xia Hu, and Huan Liu. 2013. “Exploring Temporal Effects for Location Recommendation on Location-Based Social Networks.” In Proceedings of the 7th ACM Conference on Recommender Systems, RecSys '13, 93–100. New York, NY, USA: Association for Computing Machinery.
- Gasparetti, Fabio, Damianos Gavalas, Sergio Ilarri, Francesco Ricci, and Zhiwen Yu. 2019. “Mining Social Networks for Local Search and Location-Based Recommender Systems.” Personal and Ubiquitous Computing 23 (2): 179–180.
- Georgopoulou, E., S. Mirasgedis, Y. Sarafidis, V. Hontou, N. Gakis, and D. P. Lalas. 2018. “Climatic Preferences for Beach Tourism: An Empirical Study on Greek Islands.” Theoretical and Applied Climatology 137 (1): 667–691.
- Greff, Klaus, Rupesh K. Srivastava, Jan Koutnik, Bas R. Steunebrink, and Jurgen Schmidhuber. 2017. “LSTM: A Search Space Odyssey.” IEEE Transactions on Neural Networks and Learning Systems 28 (10): 2222–2232.
- Hewer, Micah J., Daniel J. Scott, and William A. Gough. 2018. “Differential Temperature Preferences and Thresholds Among Summer Campers in Ontario's Southern Provincial Parks: a Canadian Case Study in Tourism Climatology.” Theoretical and Applied Climatology 133 (3-4): 1163–1173.
- Hidasi, Balázs, Alexandros Karatzoglou, Linas Baltrunas, and Domonkos Tikk. 2015. “Session-Based Recommendations with Recurrent Neural Networks.” arXiv preprint arXiv:1511.06939.
- Jeuring, Jelmer Hendrik Gerard. 2017. “Weather Perceptions, Holiday Satisfaction and Perceived Attractiveness of Domestic Vacationing in The Netherlands.” Tourism Management 61: 70–81.
- Jiang, Shuhui, Xueming Qian, Tao Mei, and Yun Fu. 2016. “Personalized Travel Sequence Recommendation on Multi-Source Big Social Media.” IEEE Transactions on Big Data 2 (1): 43–56.
- Khan, Kamran, Saif Ur Rehman, Kamran Aziz, Simon Fong, and S. Sarasvady. 2014. “DBSCAN: Past, Present and Future.” In The Fifth International Conference on the Applications of Digital Information and Web Technologies (ICADIWT 2014), Bangalore, India, 232–238.
- Korakakis, Michalis, Phivos Mylonas, and Evaggelos Spyrou. 2016. “Xenia: A Context Aware Tour Recommendation System Based on Social Network Metadata Information.” In 2016 11th International Workshop on Semantic and Social Media Adaptation and Personalization (SMAP), Thessaloniki, Greece, 59–64.
- Kusano, Genki, Yasuaki Hiraoka, and Kenji Fukumizu. 2016. “Persistence Weighted Gaussian Kernel for Topological Data Analysis.” In Proceedings of the 33nd International Conference on Machine Learning, ICML 2016, New York City, NY, USA, June 19–24, 2016, edited by Maria-Florina Balcan and Kilian Q. Weinberger, Vol. 48 of JMLR Workshop and Conference Proceedings, 2004–2013. JMLR.org.
- Li, Huayu, Yong Ge, Richang Hong, and Hengshu Zhu. 2016. “Point-of-Interest Recommendations: Learning Potential Check-Ins from Friends.” In Proceedings of the 22nd ACM SIGKDD International Conference on Knowledge Discovery and Data Mining, KDD '16, 975–984. New York, NY, USA: Association for Computing Machinery.
- Li, Jiacheng, Yujie Wang, and Julian McAuley. 2020. “Time Interval Aware Self-Attention for Sequential Recommendation.” In Proceedings of the 13th International Conference on Web Search and Data Mining, WSDM '20, 322–330. New York, NY, USA: Association for Computing Machinery.
- Li, Xin, Guandong Xu, Enhong Chen, and Yu Zong. 2015. “Learning Recency Based Comparative Choice Towards Point-of-Interest Recommendation.” Expert Systems with Applications 42 (9): 4274–4283.
- Lim, Kwan Hui, Jeffrey Chan, Christopher Leckie, and Shanika Karunasekera. 2016. “Towards Next Generation Touring: Personalized Group Tours.” In Proceedings of the Twenty-Sixth International Conference on International Conference on Automated Planning and Scheduling, ICAPS'16, 412–420. London, UK: AAAI Press.
- Lo, Yung-Yin, Wanjiun Liao, Cheng-Shang Chang, and Ying-Chin Lee. 2018. “Temporal Matrix Factorization for Tracking Concept Drift in Individual User Preferences.” IEEE Transactions on Computational Social Systems 5 (1): 156–168.
- Logesh, R., V. Subramaniyaswamy, V. Vijayakumar, and Xiong Li. 2019. “Efficient User Profiling Based Intelligent Travel Recommender System for Individual and Group of Users.” Mobile Networks and Applications 24 (3): 1018–1033.
- Lyu, Yan, Chi-Yin Chow, Ran Wang, and Victor C. S. Lee. 2019. “iMCRec: A Multi-Criteria Framework for Personalized Point-of-Interest Recommendations.” Information Sciences 483: 294–312.
- Majid, Abdul, Ling Chen, Hamid Turab Mirza, Ibrar Hussain, and Gencai Chen. 2015. “A System for Mining Interesting Tourist Locations and Travel Sequences From Public Geo-Tagged Photos.” Data & Knowledge Engineering 95: 66–86.
- Massimo, David, and Francesco Ricci. 2018. “Harnessing a Generalised User Behaviour Model for Next-POI Recommendation.” In Proceedings of the 12th ACM Conference on Recommender Systems, RecSys '18, 402–406. New York, NY, USA: Association for Computing Machinery.
- Morales, Giorgio, Samuel G. Huamán, and Joel Telles. 2018. “Cloud Detection in High-Resolution Multispectral Satellite Imagery Using Deep Learning.” In Artificial Neural Networks and Machine Learning – ICANN 2018, 280–288. Cham: Springer International Publishing.
- Rendle, Steffen, Christoph Freudenthaler, and Lars Schmidt-Thieme. 2010. “Factorizing Personalized Markov Chains for Next-Basket Recommendation.” In Proceedings of the 19th International Conference on World Wide Web, WWW '10, 811–820. New York, NY, USA: Association for Computing Machinery.
- Scott, Daniel, Michelle Rutty, Bas Amelung, and Mantao Tang. 2016. “An Inter-comparison of the Holiday Climate Index (HCI) and the Tourism Climate Index (TCI) in Europe.” Atmosphere (Basel).7 (6): 80.
- Steiger, Robert, Bruno Abegg, and Leandra Jänicke. 2016. “Rain, Rain, Go Away, Come Again Another Day. Weather Preferences of Summer Tourists in Mountain Environments.” Atmosphere (Basel)7 (5): 63.
- Sun, Xiaoyu, Zhou Huang, Xia Peng, Yiran Chen, and Yu Liu. 2019. “Building a Model-Based Personalised Recommendation Approach for Tourist Attractions From Geotagged Social Media Data.” International Journal of Digital Earth 12 (6): 661–678.
- Vahidnia, Mohammad H. 2022. “Point-of-Interest Recommendation in Location-Based Social Networks Based on Collaborative Filtering and Spatial Kernel Weighting.” Geocarto International 1–20. doi:10.1080/10106049.2022.2086626.
- Villegas, Norha M., Cristian Sánchez, Javier Díaz-Cely, and Gabriel Tamura. 2018. “Characterizing Context-Aware Recommender Systems: A Systematic Literature Review.” Knowledge-Based Systems 140: 173–200.
- Vu, Huy Quan, Gang Li, Rob Law, and Ben Haobin Ye. 2015. “Exploring the Travel Behaviors of Inbound Tourists to Hong Kong Using Geotagged Photos.” Tourism Management 46: 222–232.
- Wan, Lin, Yuming Hong, Zhou Huang, Xia Peng, and Ran Li. 2018. “A Hybrid Ensemble Learning Method for Tourist Route Recommendations Based on Geo-Tagged Social Networks.” International Journal of Geographical Information Science 32 (11): 2225–2246.
- Wang, Shoujin, Liang Hu, Yan Wang, Longbing Cao, Quan Z. Sheng, and Mehmet Orgun. 2019. “Sequential Recommender Systems: Challenges, Progress and Prospects.” In Proceedings of the Twenty-Eighth International Joint Conference on Artificial Intelligence, IJCAI-19, 6332–6338, Vol. 7. International Joint Conferences on Artificial Intelligence Organization.
- Wang, Bin, Wenzhong Shi, and Zelang Miao. 2015. “Confidence Analysis of Standard Deviational Ellipse and Its Extension Into Higher Dimensional Euclidean Space.” PLoS One 10 (3): Article ID e0118537.
- Wang, Suhang, Yilin Wang, Jiliang Tang, Kai Shu, Suhas Ranganath, and Huan Liu. 2017. “What Your Images Reveal: Exploiting Visual Contents for Point-of-Interest Recommendation.” In Proceedings of the 26th International Conference on World Wide Web, WWW '17, 391–400. Republic and Canton of Geneva, CHE: International World Wide Web Conferences Steering Committee.
- Xie, Min, Hongzhi Yin, Hao Wang, Fanjiang Xu, Weitong Chen, and Sen Wang. 2016. “Learning Graph-Based POI Embedding for Location-Based Recommendation.” In Proceedings of the 25th ACM International on Conference on Information and Knowledge Management, CIKM '16, 15–24. New York, NY, USA: Association for Computing Machinery.
- Xu, Shan, and Junzo Watada. 2014. “A Method for Hybrid Personalized Recommender Based on Clustering of Fuzzy User Profiles.” In 2014 IEEE International Conference on Fuzzy Systems (FUZZ-IEEE),Beijing, China, 2171–2177.
- Ye, Mao, Peifeng Yin, Wang-Chien Lee, and Dik-Lun Lee. 2011. “Exploiting Geographical Influence for Collaborative Point-of-Interest Recommendation.” In Proceedings of the 34th International ACM SIGIR Conference on Research and Development in Information Retrieval, SIGIR '11, 325–334. New York, NY, USA: Association for Computing Machinery.
- Yin, Hongzhi, Bin Cui, Xiaofang Zhou, Weiqing Wang, Zi Huang, and Shazia Sadiq. 2016. “Joint Modeling of User Check-In Behaviors for Real-Time Point-of-interest Recommendation.” ACM Transactions on Information Systems (TOIS) 35 (2): 1–44.
- Yuan, Quan, Gao Cong, Zongyang Ma, Aixin Sun, and Nadia Magnenat Thalmann. 2013. “Time-Aware Point-of-Interest Recommendation.” In Proceedings of the 36th International ACM SIGIR Conference on Research and Development in Information Retrieval, SIGIR '13, 363–372. New York, NY, USA: Association for Computing Machinery.
- Zadeh, Lotfi Asker. 1978. “Fuzzy Sets As a Basis for a Theory of Possibility.” Fuzzy Sets and Systems 1 (1): 3–28.
- Zhang, Wei, and Jianyong Wang. 2015. “Location and Time Aware Social Collaborative Retrieval for New Successive Point-of-Interest Recommendation.” In Proceedings of the 24th ACM International on Conference on Information and Knowledge Management, CIKM '15, 1221–1230. New York, NY, USA: Association for Computing Machinery.
- Zhao, Pengpeng, Haifeng Zhu, Yanchi Liu, Jiajie Xu, Zhixu Li, Fuzhen Zhuang, Victor S. Sheng, and Xiaofang Zhou. 2019. “Where to Go Next: A Spatio-Temporal Gated Network for Next POI Recommendation.” Proceedings of the AAAI Conference on Artificial Intelligence 33 (1): 5877–5884.
- Zhou, Bolei, Agata Lapedriza, Aditya Khosla, Aude Oliva, and Antonio Torralba. 2017. “Places: A 10 Million Image Database for Scene Recognition.” IEEE Transactions on Pattern Analysis and Machine Intelligence 40 (6): 1452–1464.
- Zhou, Xiaolu, Chen Xu, and Brandon Kimmons. 2015. “Detecting Tourism Destinations Using Scalable Geospatial Analysis Based on Cloud Computing Platform.” Computers, Environment and Urban Systems 54: 144–153.