
ABSTRACT
The real-time accurate description of all spatial features of railway and their spatiotemporal relationships is a crucial factor in realizing comprehensive management and related decision-making within the entire life cycle of railways. Nevertheless, available spatiotemporal data models mainly use static historical sequence data, which are insufficient to support multi-source heterogeneous real-time sensed data; they lack a systematic depiction of the interactive relationships among multiple feature entities, and are limited to low-level descriptive analysis. Therefore, this study proposes a data-model-knowledge integrated representation data model for a digital twin railway, which explicitly describes the spatiotemporal, and interaction relationships among railway features through a conceptual knowledge graph. This study first analyzes the characteristics of railway features from above ground to underground, and then constructs a conceptual model to clearly describe the complex relationships among railway features. Secondly, a logical model is developed to illustrate the basic data structure. Thirdly, an ontology model is constructed as a basic framework for further deepening the domain knowledge graph. Finally, considering the prevention of landslides as an example, it demonstrates the abundant spatiotemporal relationships among railway related features. The results of this study bring more clear understanding of the complex interactive relationships of railway entities.
1. Introduction
Due to the characteristics of linear engineering, railway project, especially mega railway engineering, which has a large-scale spatial span and in the face of complicated and changeable physical environments, such as harsh climatic conditions in high-altitude areas, steep terrain in mountainous areas, and complex geological conditions. Under the combined effects of these unfavorable factors, it is bound to considerably increase the difficulty of comprehensive management of the entire life cycle of a railway project. However, the traditional approach of data flow and exchange among different related systems of railway engineering is still mainly based on two-dimensional (2D) data (such as map and plan), which is inefficient; each department updates and maintains data independently, which makes railway spatial information scattered and difficult to share. Meanwhile, the in-depth fusion analysis may lead to the duplication of spatial information systems. The lack of internal connections among systems is another significant obstacle to achieving efficient and comprehensive management of railway engineering from a design to construction then to operation and maintenance from a macro perspective.
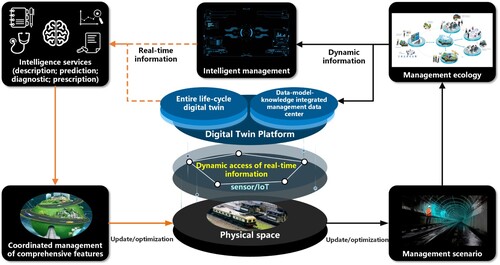
To improve the safety, quality, and efficiency of increasingly complex railway engineering projects throughout the entire life-cycle, utilizing a new generation of computer technology, geographical information system (GIS), building information modeling (BIM), and artificial intelligence (AI) technology to accomplish digitized and intelligent railways has become a trend of modern railway worldwide, such as the European Railway Traffic Management System (ERTMS) (Jabri et al. Citation2010). The very nature of digital twin railway is the digital representation of railway related features (personnel, machine, material, method, and environment) and their dynamic processes, the features can be determined according to different stages (design, construction, and operation) of the entire life-cycle of railway and corresponding practical requirements. It gathers various related multiscale/multiphysics information, aiming to represent the physical entities and their surrounding environments with minimal differences, analyzes the past and predicts the future in the digital space to improve the real-time behavior of interested physical objects, which contributes to various wider applications such as aid decision making and risk assessment (Tao et al. Citation2018; Tomiyama et al. Citation2019; Zhu et al. Citation2022). Most railway projects experience a constant and simultaneous stream of projects at varying stages of completion (Elliot Citation2019), from transportation infrastructure to facilities (tunnel construction, bridge construction, stations, and so on). It includes a series of human engineering activities such as tunnel drilling, blasting, excavation, and filling. As the project progresses, the geographical environment, geological condition and construction equipment/facility will change dynamically, for example, the change in the position of the TBM (tunnel boring machine) with the progress of tunnel construction and the different types of construction methods and equipment used in different geographical and geological environments. Therefore, statically expressing the state of railway engineering and its environment within a certain period can no longer meet the real-time management requirements of modern railway under complex engineering conditions (Körner, Michael, and Wrobel Citation2012; Apputhurai and Stephenson Citation2013). As shown in , by defining the total feature and its interactive relationships, connecting with real-time data gathered from various sensors and the Internet of Things (IoT) and setting up the relationships among ‘data-model-knowledge,’ the digital twin railway is capable of reflecting the entire life cycle of the railway at different scales, from the stage of design, construction to operation management; providing efficient and intelligent management for various scenes (surface/subsurface; indoor/outdoor); and conducting multi-level tasks such as state description, problem diagnosis, process prediction, and aid decision-making on different scales (national, local, and site scales). The precondition to accomplish such functions of a digital twin railway is a spatiotemporal data model that can efficiently and accurately represent the behavior of multi-granularity objects in three-dimensional (3D) railway space and their interaction relationships under a unified time–space framework.
Figure 1. The basic principles of Digital Twin railway.
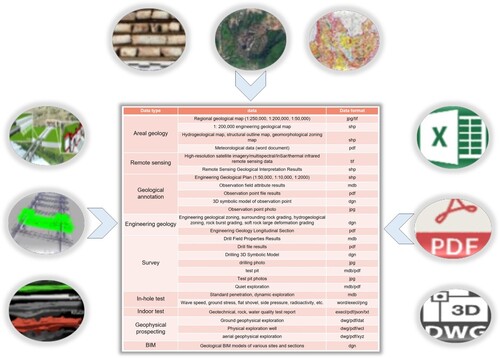
However, as shown in , the survey, design, and construction of railway engineering involves massive multi-source/multi-granularity railway space information data. For instance, from the specialized point of view of geology, it mainly includes basic geology, engineering geology, advance geological forecast, hydrogeology, geophysics, geochemistry, and geological disaster data. The initial data of the survey and design involve profile, drilling data, geophysical exploration and monitoring data, process data such as laboratory experimentation, comprehensive evaluation and analysis, as well as result data such as result record and implementation plan. From the perspective of data type, it includes structured data (such as 3D model, vector/raster data, and EXCEL\CVS) and unstructured data (such as blueprints, documents, and pictures); from the perspective of data level, it includes small, medium, and large scales, that is, low- to high-precision geological data. As different railway project departments use different systems to manage data related to their specific workflows and facility assets, data exist in a variety of forms such as CAD (Computer Aided Design), BIM, GIS, engineering models, tables, databases, documents, real-time and historical networked data streams, images, and point clouds, and data are constantly changing, making it especially difficult to obtain the right information at the right time.
Figure 2. Multi-source data of Digital Twin railway.
Furthermore, with the rapid development of IoT and sensor technology in recent years, 3D comprehensive detection and dynamic observation technology have been widely applied and have been used to continuously obtain the structure, shape, appearance, and other physical and functional attribute information (Aggarwal Citation2011; Li Citation2009). However, it not only provides multi-source dynamic monitoring data with increasingly higher spatiotemporal resolutions but also leads to massive information with the characteristics of multi-source heterogeneous, cross-scale, multi-modal, complex temporal, and spatial correlations among features above and below the ground, which require a higher ability to perceive, process, and analyze the dynamic changes of complex geography, geology, and other related features (Yuan and Hornsby Citation2011; Torrens Citation2009). In addition, efficiently utilizing captured real-time information with minimum cost and reflecting physical changes in the digital twin railway is another issue (Stoter, Arroyo Ohori, and Noardo Citation2021). Thus, structuring data and enabling its use across the entire life cycle remain a major challenge (Erkoyuncu et al. Citation2020).
Compared with natural resource integrated representation of unified management and planning (Ding et al. Citation2022), the circumstances of railway projects are more complicated owing to the multitudinous features of its surrounding environment with dynamic changes following the construction process, meaning more complex relationships among features. Therefore, this study proposes a digital twin railway spatiotemporal data model represented by data model knowledge to support the unified expression and management of features and their spatiotemporal relationships. This model analyzes important features of railway space and their spatiotemporal relationships by applying semantics, multi-scale, and mechanism models to form the foundation of integrated expression of multi-source heterogeneous railway space information data, and then presents a logical model to demonstrate a framework of basic data storage structure. The relationships among features are demonstrated by a conceptual knowledge graph, and those containing specialized knowledge is described through mechanism models. In addition, an ontology model of railway space features is constructed for an in-depth study on domain knowledge graphs to depict more detailed, complicated relationships among features. A case study on landslide prevention and control is presented to verify the validity of the modeling method.
This study presents an integrated data-model-knowledge representation data model for storing and managing digital twin railway information data. Section 2 reviews the related work on spatiotemporal data models. In Section 3, a conceptual model of railway entities is proposed regarding the semantic, scale, and data model–knowledge aspects. Section 4 designs a logical model to illustrate a data storage framework for massive digital twin railway information data, in addition, a digital twin railway space feature ontology model is established to act as a headstone to support the construction of different field knowledge graphs to explicitly represent complex relationships among railway space features. Section 5 demonstrates the use of the ontology model to construct a knowledge graph of the landslides. Finally, Section 6 concludes the study and discusses potential future work.
2. State of the art
Spatiotemporal data are a combination of time, space, and attributes and are the three basic elements that reflect the state and evolution process of railway entities. Early spatiotemporal data models mainly included the sequence snapshot model, ground state correction model, spatiotemporal cube model, and spatiotemporal complex model. The spatiotemporal data model based on ‘snapshot’ is a widely used type and is directly related to concepts such as timestamps and time scales (Worboys Citation2005), which represent spatiotemporal processes through a series of snapshots of time segments, a ‘snapshot’ represents the spatiotemporal changes that occur in a certain area at a certain point in time. The process of spatiotemporal evolution is expressed through state layers corresponding to different times in vector or raster snapshots. This method can be described by comparing state information at different times. The state changes of an entity at two points on the time axis support a simple temporal-information query. However, this method does not express a single entity and cannot handle complex spatiotemporal relationships. At the same time, it indiscriminately stores undifferentiated features. With an increase in snapshots, a significant amount of redundancy will be generated. To solve the redundancy problem, a ground-state correction model is proposed, which only stores the data state (ground state) at a certain point in time and the amount of change relative to the ground state, that is, the changed data will only be stored when the state of the entity object changes. Another problem with this method is that, if a certain state in the past with a large time span needs to be retrieved, it is required to traverse nearly the entire database, resulting in low efficiency. Owing to the use of snapshot views, it is still difficult to deal with the spatial relationships among entities.
To make up for the deficiency of the model using the snapshot principle, the researchers use geometric solid graphics to represent the development and change of 2D graphics along the time dimension, express the evolution of the plane position of the physical world over time, and mark the time on the spatial coordinate points. Thus, it expresses temporal semantics more clearly (Kraak Citation2003), but its disadvantage is that as the amount of data increases, the operations on the cube will become more and more complex and eventually cannot be processed (Bach et al. Citation2017).
The object-oriented spatiotemporal data model establishes the aggregation of spatial, temporal, and attribute features centered on geographic entities, introduces the concept of objects and classes, transfers the perspective of state changes from the whole to each spatiotemporal object, and has a hierarchical relationship, that is, complex objects can be composed of simple objects, and complex spatiotemporal objects can be decomposed into simple objects (Beard Citation2006). After considering the object as the core of the research, many types of changes are classified by the object. For example, the three changes in the temporal characteristics of an object and the differences in the geometric structure (point, curve, surface, and solid) of the spatial characteristics were combined, and the spatial and temporal changes were combined. Summarized into 12 types, and from the perspective of changes in geometry, topology, and properties of geographic entities, there are 8 possible types of changes that a single spatiotemporal object can experience (Pelekis et al. Citation2004). Object-oriented methods can express spatial changes and attribute changes of geographic entities at the same time and can express spatial and temporal topological relationships (Huang and Peng Citation2008; Camossi, Bertolotto, and Bertino Citation2006). To improve the query and retrieval efficiency of the system and provide richer spatiotemporal semantics and dynamic expression capabilities, related research focuses on spatiotemporal variation and multi-scale spatiotemporal features. Representative models include event-based spatiotemporal data models and process-oriented spatiotemporal data models. The event-based spatiotemporal data model regards each state change of a spatial region as an event and uses the event sequence on the one-dimensional time axis to represent the spatiotemporal process (Yuan Citation2001; Beard Citation2006). However, entity objects and their changes cannot be described because they are based on a description of the grid position. Although its modified model has improved data query efficiency and spatiotemporal inversion ability, it still lacks correlation among events (Zheng, Li, and Wei Citation2006; Xia, Li, and Shao Citation2007). The process-oriented spatiotemporal data model provides richer spatiotemporal semantics and a complete dynamic expression framework (Xue et al. Citation2010), but due to its complex modeling methods, there are few successful application cases. The studies on spatiotemporal data models in the past 10 years are more inclined to the design and application of models in a specific field, such as defining the 3D geometric multi-level structure of buildings and thematic semantics describing the relationship between real estate objects and property rights. The semantics-based 3D dynamic hierarchical house property model (Zhu and Hu Citation2010) expresses the dynamic replacement of property rights of 3D buildings, but this model is highly specialized and lacks applicability to other fields.
In general, the existing spatiotemporal data model has been continuously developed and improved, but there are still major limitations in the explicit expression of time, space, attribute, and their complex associations. It is especially obvious in the complex scene of multi-feature types of railway space. Because the spatiotemporal relationship among physical features cannot be fully reflected, multi-scale and multi-source heterogeneous data cannot be efficiently integrated and managed, which makes it difficult to accurately map the entire railway space in a virtual space.
3. Conceptual model
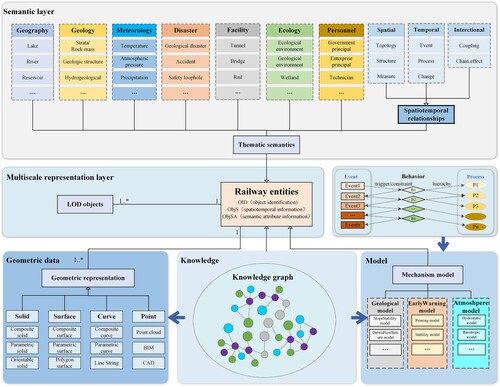
To describe the geometry, scale, topology, attributes, behavior characteristics, and interaction relations of the multi-granularity features of a digital twin railway under a unified spatiotemporal framework, a spatiotemporal data model of geospatial data, model, and knowledge integrated representation for a digital twin railway was established. As shown in , the model is constructed from five levels: semantic layer, multi-scale representation layer, geometric data layer, knowledge layer, and model layer: (1) Semantic layer expands and integrates relevant entities of railway space to form a thematic semantics of seven major feature types (geography, geology, meteorology, facility, disaster, ecology, and personnel) and represents high-level semantic information among features through temporal and spatial relationships and interaction relationships; (2) Multi-scale representation layer represents the railway entities form multiple levels of detail to meet the application requirements of different levels; (3) Geometric data layer realizes the unified expression of the geometric model of the railway space entity features by the combination of point, curve, surface, and solid; (4) Knowledge layer establishes domain knowledge graphs, such as geological hazard knowledge graphs, engineering safety, and quality knowledge graphs; (5) Model layer integrates the mechanism models of different application scenarios, such as the debris flow initiate model used for debris flow warning, to form a model base.
Figure 3. The conceptual model of ‘data-model-knowledge’ integrated representation.
3.1. Semantic layer
The semantic layer is composed of two parts: the classification system of digital twin railway space features and spatiotemporal relationships, including spatial, temporal, and interactive relationships. The intricate relationships among railway space features are depicted by spatiotemporal relationships during the entire life cycle of the digital twin railway. As data are precisely mapped with the feature classification system, this layer can extract the required data and then supports various in-depth applications of digital twin railways.
3.1.1. The classification of railway features
According to the practical requirements of the entire life-cycle of railway, the classification system for features of digital twin railways includes the following seven typical feature types:
Geographical features describe the complex topography and landform and related geographical features in a wide area along the railway, mainly including the water system, topography and landform, and traffic.
Geological features, according to the types of data obtained by railway engineering surveys, including stratum and rock mass/belt, geological structure, hydrogeology, regional geological survey features, engineering geology, and geophysics.
Meteorological features provide important information for the monitoring and early warning of geological disasters such as landslides, mudslides, and rockfalls in mountainous areas, including data acquired from meteorological dynamic monitoring and weather forecasts, such as temperature, air pressure, wind speed, wind direction, precipitation, and visibility.
Disaster features, covering natural disasters and accidents, such as various typical mountain geological disasters and safety accidents during construction and operation, match the results of geological disaster monitoring and early warning systems or other security tasks.
Facilities features, matching and mapping with engineering feature models, BIM models, and so on, including tracks, subgrades, bridges, culverts, tunnels, stations, and other features.
Ecological features and environmental protection are significant aspects of railway engineering; minimizing the damage to the ecological environment in the process of design, planning, and construction requires a lot of simulation analysis and evaluation; therefore, it mainly includes the ecological environment, wetlands, wild animal and plant features, boundaries, and related features.
Personnel features mainly cover decision-making and management personnel of various functional departments as well as personnel perception information for construction personnel, including personnel position information and health information.
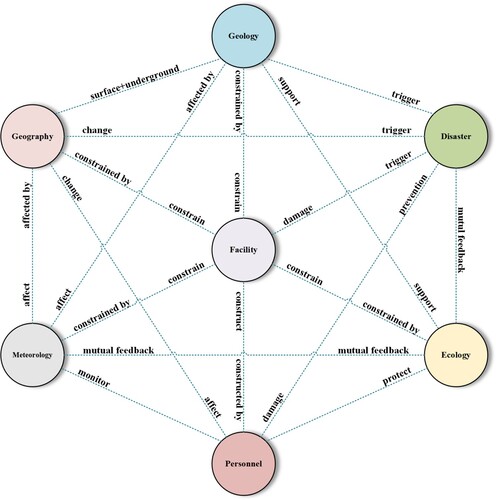
The railway feature classification framework is foundation of the design of conceptual model and ontology model. It initially determines the scope of each independent domain, the basic types of features and their superclass/subclass relationships. Since the superclasses of features are firstly determined, the classification system can be further expanded through a top-down approach. By sorting out the significant features of the digital twin railway and then analyzing the semantic associations among the features, the main relationship network framework of the major categories of features can be constructed, as shown in .
Figure 4. Basic relationships of railway space features
3.1.2. Spatiotemporal relationships
As shown in , the correlation can describe the spatiotemporal relationships among railway features. Its function is to organize the spatial information data of digital twin railways in an orderly manner, form a correlation network among various information resources, and fully exploit the data characteristics and their interrelationships to facilitate the efficient use and management of information resources.
Table 1. Spatiotemporal relationships among railway features.
3.1.2.1. Spatial relationship
A spatial relationship is the description of the topology, structure, and measurement of the railway spatial feature entity. It is applied to describe the relative position relationship among railway spatial elements, such as lakes, rivers, strata, rock masses, and facilities, and is used to analyze the possible results of various features, such as geological disasters under specific spatial location conditions: (1) Topological relationship is spatial relationships among point, line, and surface, such as adjacency, inclusion, connectivity, coverage, and separation (e.g. geological body includes a tunnel); (2) Structure relationship, the arrangement and combination of features in space; and (3) Measurement relationship (scale relationship), relative to the qualitative description of the topological relationship, which is used to quantitatively express the distance among point, line, and surface in space.
3.1.2.2. Time relationships
Time relationships include events, processes, and changes. In the process of spatiotemporal evolution, the state of a certain physical object can be changed under certain conditions; after reaching a certain threshold value, such a change generates an event; if a series of events are arranged in an orderly manner, a spatiotemporal evolution process can be formed. In addition, by understanding the external representation and internal relationship of the spatiotemporal evolution process, the behavioral characteristics of the features are extracted and applied to determine the adopted mechanism model through the characteristic factors and form the precise assimilation of the data and the mechanism model.
3.1.2.3. Interaction relationship
Interaction relationships include coupling relationships and chain influences. It is a unified representation of the mutual feedback relationship of the railway space features. Furthermore, it can be represented as the spatiotemporal evolution process of complex man-made phenomena and natural phenomena. This was also the basis for building a knowledge graph.
3.2. Multi-scale representation layer
From the macro- to the micro-scale, digital twin railways gather different scales of information from multiple sources. The one-size-fits-all property as universally assigned to digital twin railways does not suffice; therefore, the purpose of establishing a multi-scale expression framework for railway spatial information from 2D to 3D is to ensure maximum utilization of data while eliminating unnecessary data interference because higher levels of details do not always lead to better analysis (Stoter, Arroyo Ohori, and Noardo Citation2021). According to the characteristics of railway projects, geology and terrain features are the basic components of the environment, whereas railway facilities are the subject of this project. Therefore, the multi-scale expression layer establishes a reasonable hierarchical structure according to these three entity types. As shown in , the 2D geological survey data at the LOD1 (Level of Details 1) were divided into reconnaissance, enhanced work, preliminary survey, and final survey stages. Different stages not only include the same type of survey data, such as engineering geological maps, but also reflect varying levels of geological information with corresponding scales. At the final survey stage, the scale of the data is flexible, based on specific survey requirements. For 3D geological data, LOD2 is mainly a type of 2.5D surface model for regional-scale geological modeling and LOD3 is a type of 3D solid model for geological BIM and geological voxel models.
Table 2. Geological data classification and levels of detail.
illustrates the multi-LOD of the terrain and railway facility models. According to the different stages of railway engineering from network planning to construction drawing design, terrain data need to obtain DEM (Digital Elevation Model) with different resolutions from LOD1 to LOD4 with corresponding scales. Railway facility entity objects have different levels of information composition at different scales. For instance, a 3D model of a bridge includes piers, supports, abutments, railings, and other components and their related information; nonetheless, a block model can be regarded as an independent object with no components. This is due to the spatial semantic hierarchical relationship of the entities in the physical world; in other words, they have natural multi-scale attributes. Because terrain models and railway facility models are composed of geometry and textures, as the spatial scale increases, a high resolution of the model is required in most situations, and vice versa, which requires the model to have multiple levels of geometric and texture details. In general, the 2.5D/3D model of railway facilities can be divided into three categories from LOD1 to LOD4: central lines of track, GIS surface model, and BIM.
Table 3. Terrain/railway facility data classification and level of detail.
According to ‘Railway Engineering Information Model Expression Standard’ issued by China Railway BIM Alliance (CRBIM 1003-2017 Citation2017), railway project applies BIM of professional level; the level of geometric expression can be further divided depending on the different application stages from L1 to L4 as shown in . A professional BIM of a railway project comprises a multiple component model, where the grade of geometric representation accuracy of the component model corresponds to the level of geometric expression from G1 to G4. Among them, G1 satisfies the geometric accuracy of symbolic identification requirements, G2 represents rough identification requirements such as space occupation, G3 represents real appearance, and G4 represents high-precision identification requirements such as structural construction. Remarkably, the grade of geometric accuracy matched the level of geometric expression in most cases. However, depending on the complexity of the component objects, the geometric accuracy may upgrade or degrade at the same level of geometric expression. For example, tracks under L4 only require G3.
Table 4. BIM classification and level of detail.
The multi-scale representation layer fulfills the construction, expression, and storage of multi-LOD geology, terrain, and railway facility data. In the process of survey, design, and construction of railway projects, owing to the complex environment and features, the information data obtained have significant cross-scale characteristics and will continuously update during the entire construction process (e.g. geological data), which makes the representation of data have the characteristics of multi-scale and multi-precision. Therefore, the representation and storage of railway spatial features are carried out through semantic-based multi-LOD 3D entity objects and associated with the geometric layer to accomplish the representation of 3D entities at different scales.
3.3. Geometry data
This layer expresses the geometric characteristics of a 3D object, such as its position, size, and shape. It contains four types of geometric data features: points, curves, surfaces, and solids, each of which has different geometric expression methods. As illustrated in , the point object refers to a point that is associated with the 3D spatial coordinate system of BIM, CAD, and point cloud, and is used to conduct operations such as vector operations. The curve object represents the linear characteristics of 3D entities (e.g. track, cable) that can be divided into ‘composite curve,’ ‘line string,’ and ‘parametric curve’; the parametric curve is able to represent more complex linear objects such as bridges and trains. The surface object includes ‘polygon surface,’ ‘composite surface,’ and ‘parametric surface.’ The polygon surface expresses basic 2.5D entities (e.g. subgrade), whereas the composite surface represents complicated entities that are composed of simple surface entities. The parametric surface comprises cylindrical, spherical, and ruled surfaces, and the typical use of parametric surfaces is the expression of tunnels. The solid object is composed by ‘composite solid’ and ‘parametric solid’; a bridge pier can be regarded as a solid since it is constituted by surfaces, while a train station can be regarded as a composite solid because it is divided by multiple independent geometry (solid) and connected by common surfaces. A parametric solid refers to a more complicated solid, such as a specific component of bridges or tunnels. The orderly combination and association of geometric data features enables the expression of complex feature entities in digital twin railways such as tunnels, bridges, and geological bodies.
3.4. Mechanism model
The model refers to mechanism models, such as the slope stability, debris flow, and dynamic models. A model represents a method to deal with a certain problem; it is a vessel that contains complicated relationships among multiple features; in other words, it includes specialized knowledge. During the entire life cycle of a digital twin railway, various application services at different levels require the participation of models, such as early warning, prediction, and simulation of geological disasters. In essence, it is the process of adopting different types of models and combining various models on demand. Simultaneously, the mechanism model contains knowledge connections among features. Therefore, through the classification and integration of mechanism models, a model base is acquired that can supplement professional knowledge graphs.
3.5. Knowledge
Exploring the interaction among railway space features to form domain knowledge graphs of different professions, such as geological disaster knowledge graphs, engineering safety and quality knowledge graphs, and conducting semantic matching between multi-source data and entity features through knowledge graphs to achieve data-semantic alignment. It is arranged to collaborate with the mechanism models to guide the design of the optimal framework of the data structure.
4. Logical model and ontology model
This section introduces an extensible logical model of multi-source data related to railway space features, and an ontology model of a digital twin railway is designed to demonstrate the significant feature entities and their basic interactive relationships in railway space.
4.1. Logical model of railway entities
Digital twin railways have multi-level and diversified in-depth applications such as problem diagnosis, risk assessment, trend prediction, and emergency response, which play an important role in ensuring the organic coordination of multi-level and diversified businesses in the process of railway planning, design, construction, operation, and maintenance management. In the other hand, railway spatiotemporal big data have the characteristics of multi-scale heterogeneous data. From the survey and design, construction, and construction to operation management, it includes high-precision real-world 3D models, multi-resolution DEM/DOM (Digital Orthophoto Map)/DLG (Digital Line Graphic), geological survey data, geological data during construction, special geological information data (such as airborne lidar data, hyperspectral/multispectral lithology interpretation data), multi-professional BIM/CAD design model data, geological disaster monitoring, and risk analysis of the entire area. In the face of more than 1 million railway spatiotemporal data entities, applications at different levels need to extract corresponding data from the massive data and require chain of applications such as early warning/prediction, process simulation, and aid decision-making for emergency rescue of multiple types of geological disasters. It is necessary to traverse the entire data layer to extract relevant data, and then analyze the relationship among features to meet a series of in-depth application requirements, which will greatly reduce the performance and response time of the digital twin system. Therefore, establishing a logical relationship among the data in the data layer can provide an important basis for the efficient organization and management of multi-source and multi-modal data of digital twin railways and improve the comprehensive ability of multi-level, diversified, and in-depth applications. The logical model is shown in .
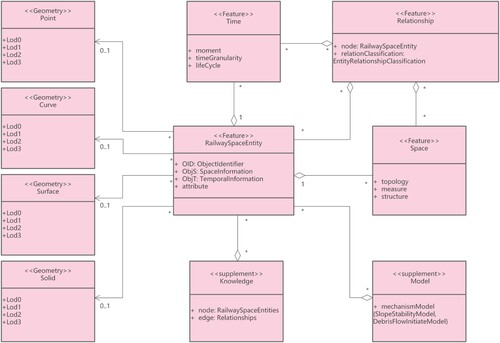
Figure 5. Unified modeling language (UML) diagram of railway space entity logical model.
4.2. Ontology model of digital twin railway entities
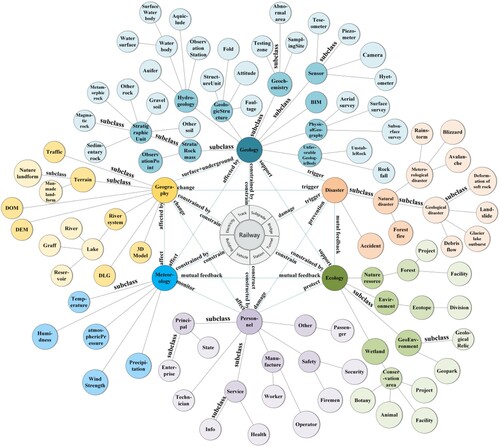
The purpose of a knowledge graph is to depict concepts/entities and their interrelationships in the real world, where the nodes represent concepts or entities, while the edges connecting each node represent the association between concepts/entities. The basic structure of a knowledge graph is the triplet of ‘entity-relationship-entity’ or ‘entity-attribute-attribute value,’ and entities are connected by edges to form a network structure. The architecture of a knowledge graph includes its own logical structure and the technical system used in its construction. The logical structure is further divided into the schema and data layers. The schema layer defines entities, their semantic relationships, and attribute relationships in a ‘top-down’ approach and finally forms an ontology model. The data layer collects and analyzes relevant data, and then uses appropriate methods to extract entities and their relationships, and finally realizes data storage and management. The digital twin railway knowledge graph covers knowledge graphs in many fields, such as the quality/safety/progress of railway construction, the event can be the construction of tunnel, bridge, station, and so forth. Another sort of specialized knowledge graph mainly focuses on the domain of typical geological disasters, for example, landslide, debris flow, and outburst of glacial lake, it provides the foundation of the applications for the prevention/prediction of geological disasters. This study adopts a top-down approach, pre-defining the entities and their superclass/subclass relationships, semantic relationships, and spatiotemporal relationships in the schema layer to form a definite conceptual hierarchy and then constructs the digital twin railway ontology model as the basic framework of the domain knowledge graphs. Ontology determines the conceptual nodes in the knowledge graph and is an important foundation for the construction of domain knowledge graphs. In the chapter of conceptual model, this study has sorted out the seven feature types of railway space; combining with the description of their relationship, the ontology model of digital twin railway is shown in .
Figure 6. Partially ontology model of digital twin railway.
5. Case study
This study considers the early warning/prediction, process simulation, risk assessment, and emergency response of typical geological disasters – landslides in mountainous railways – as an example to construct a landslide domain knowledge graph. First, the landslide scene was analyzed, and the digital twin railway ontology model () was applied as the schema layer. Then, through the bottom-up approach, the data layer was filled with data and connected to the schema layer, and the multi-source data of the digital twin railway were used to extract entities and attribute values. The extracted entities, attributed values, and associations were knowledge-fused to form a knowledge graph, whereas nodes and edges were stored in the graph database. The knowledge graph shown in shows some nodes and their relationships.
Figure 7. Partially landslide knowledge graph.
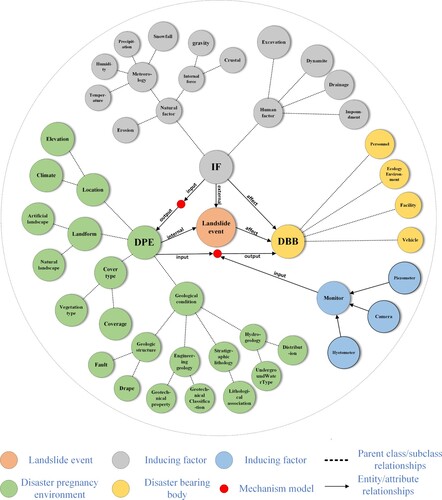
As shown in , a landslide event is defined as a node, and then a triplet of ‘disaster-pregnancy environment,’ ‘inducing factor,’ and ‘disaster-bearing body’ is designed according to the characteristics of the landslide. The disaster-pregnancy environment refers to a geographical and geological environment that is inclined to the occurrence of a landslide, and a series of features strongly related to landslides on the surface and subsurface, including geological features (subsurface) such as geological structure, stratigraphic lithology, hydrogeology, engineering geology, and geographic features (surface), such as location, topography, and land cover type. The inducing factor refers to human engineering activities such as excavation, dynamite, drainage, impoundment and natural factors that are likely to initiate a landslide; natural factors, including meteorological factors, erosion, internal forces, blasting, excavation, and water storage; disaster-bearing bodies refer to entities that are easily affected by landslide disasters, such as personnel, facilities, and ecological environment. In addition, there is a mutual feedback relationship among the triplets. The inducing factor affects the disaster-pregnancy environment, which can lead to the occurrence of landslides, which is the external cause of the landslide event. The disaster-pregnancy environment is determined by its own natural characteristics; thus, it is an internal cause of landslide events. The disaster-bearing body is the bearer of the landslide and is directly or indirectly damaged by the disaster-pregnant environment and the landslide event.
The mechanism model contains specialized knowledge in a certain field. Considering landslide-related research, there are mechanism models such as slope stability models and discrete geotechnical kinematics models. This implies abundant interaction relationships among entities, which is the foundation of in-depth applications, such as prediction, process simulation, and risk assessment of landslides. In this knowledge graph, the mechanism model is designed as nodes on the relationship edges; as suitable data are input and after the calculation of the model, the outcome can be used by other related mechanism models until the end of the workflow.
In addition, real-time monitoring data are the basis for landslide-related applications (Laurini, Servigne, and Noel Citation2005). In this knowledge graph, nodes for real-time disaster information data monitoring equipment were designed to connect with corresponding entities. The knowledge graph shows and expresses the basic spatiotemporal relationship among features of a landslide and provides a basic framework for an efficient data storage structure, while the introduction of the mechanism model improves the capability of the landslide knowledge graph to explicitly express complicated relationships among features.
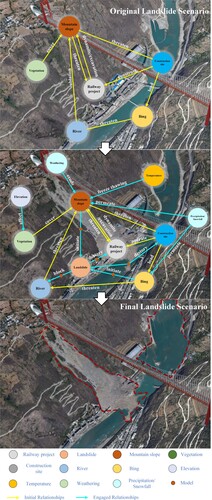
shows a typical railway bridge engineering scenario in a high-altitude mountainous region. The excavation of tunnels and construction of bridges may damage the structural stability of the high and steep slopes and vegetation coverage of the mountain. The heavy rainfall and snowfall events may lead to the occurrence of landslides. Considering the high altitude, the year-round snow accumulation on the mountaintops, as season changes (temperature changes), ice melting is another inducement of landslides. When a landslide occurs, the river can be blocked by falling debris and soil, forming a barrier lake, which threatens settlements or facilities downstream of the river with flooding. Furthermore, a long-term period of natural erosion and weathering is also an incentive for landslides to occur. In addition, the excavation of long-distance tunnels produces a large amount of soil and debris, which may also induce landslides or mudslides under the infiltration of rainwater. The landslide knowledge graph shows the interaction between railway entities and events as well as integrated related data (geographical and geological data) gathered by multi-sensor comprehensive exploration and dynamic observation developed by different discipline such as remote sensing, hydrogeology, geophysics, geochemistry and so forth. It predetermine the geology condition factors and landform factors of disaster bearing body, which is able to support the relevant applications of landslides at a different scale, for instance, the information such as position, gradient, slope orientation, and curvature can be adopted to analyze the circumstances of landslide at a certain interested site, while information such as certain landform, geologic structure, stratum/lithology can be applied to analyze the scale and range of a potential landslide. As the monitoring data of sensors/monitors (water level indicator, displacement meter, osmometer, and so on) reach a certain threshold, a series of mechanism models will be introduced to demonstrate complicated relationships among entities, such as the slope stability model, debris flow infiltration model, and landslide process simulation model. Based on the obtained results, a potential geological disaster chain can be further predicted and simulated using relevant mechanism models.
Figure 8. Landslides scenario of Digital Twin railway supported by knowledge graph.
6. Conclusion
This study proposes a novel spatiotemporal data model of ‘data-model-knowledge’ integrated representation for digital twin railways. Based on the analysis of railway space features, the model consists of semantic layer, multi-scale expression layer as well as ‘data-knowledge-model.’ The model determines the basic temporal and spatial relationships among railway space features and simultaneously describes the complicated relationships among the features through mechanism models. The model adopts the fundamental principle of object-oriented modeling and combines a knowledge graph to explicitly represent the interaction relationships among entities. Considering the characteristics and multi-level applications of digital twin railways, the related 2D-3D data is expressed in multi-scale and multiple LOD. In addition, by analyzing the types of important features of railway spaces and their basic temporal and spatial relationships, a digital twin railway ontology model was constructed, which provided a schema layer for building a domain knowledge graph with a bottom-up method to depict more detailed temporal relationships, space relationships, interaction relationships, and spatiotemporal evolution processes of entities. Lastly, considering landslides as an example in the case study, applying strongly correlated features and their interrelationships, a landslide knowledge graph was established for in-depth applications of digital twin railways, such as early warning/forecasting, process simulation, risk assessment, and emergency response. The knowledge graph explicitly represents the relationships among features of a typical mountainous landslide disaster scene, as well as the integration of mechanism models and access to real-time disaster monitoring data.
Future research should further verify the applicability of the model for the digital twin railway according to various application requirements, providing a more efficient database structure and an enhanced description of the spatiotemporal relationship of features to achieve the accurate mapping of the entire life cycle of the digital twin railway in the virtual space.
Disclosure statement
No potential conflict of interest was reported by the author(s).
Data availability statement
Data not available due to legal restrictions.
Additional information
Funding
References
- Aggarwal, Charu C. 2011. “An Introduction to Social Network Data Analytics.” In Social Network Data Analytics, edited by Charu C. Aggarwal, 1–15. New York: Springer.
- Apputhurai, Pragalathan, and Alec G. Stephenson. 2013. “Spatiotemporal Hierar-chical Modelling of Extreme Precipitation in Western Australia Using Anisotro-pic Gaussian Random Fields.” Environmental and Ecological Statistics 20 (4): 667–677. doi:10.1007/s10651-013-0240-9.
- Bach, Benjamin, Pierre Dragicevic, Daniel Archambault, Christophe Hurter, and Sheelagh Carpendale. 2017. “A Descriptive Framework for Temporal Data Visualizations Based on Generalized Space-Time Cubes.” Computer Graphics Forum 36 (6): 36–61. doi:10.1111/cgf.12804.
- Beard, Kate. 2006. “Modeling Change in Space and Time: An Event Based approach.” In Innovations in GIS: Dynamic and Mobile GIS: Investigating Change in Space and Time, edited by Jane Drummond, Roland Billen, Elsa João, and David Forrest, 55–74. Boca Raton: CRC Press.
- Camossi, Elena, Mario Bertolotto, and Elisa Bertino. 2006. “A Multigranular Object-Oriented Framework Supporting Spatio-Temporal Granularity Conversions.” International Journal of Geographical Information Science 20 (5): 511–534. doi:10.1080/13658810600607451.
- CRBIM 1003-2017. 2017. Railway Engineering Information Model Expression Standard. Beijing: China Railway BIM Alliance.
- Ding, Yulin, Zhaowen Xu, Qing Zhu, Hankan Li, Yan Luo, Ying Bao, Lingju-n Tang, and Sen Zeng. 2022. “Integrated Data-Model-Knowledge Representatio-n for Natural Resource Entites.” Inernational Journal of Digital Earth 15 (1): 653–678. doi:10.1080/17538947.2022.2047802.
- Elliot, Teresa. 2019. “7 Ways Cities Benefit from Digital Twins.” The GIM International, September 24. https://www.gim-international.com/case-study/seven-ways-cities-benefit-from-digital-twins.
- Erkoyuncu, John A, Iñigo Fernández del Amo Blanco, Dedy Ariansyah, Domi-nik Bulka, Rok Vrabič, and Rajkumar Roy. 2020. “A Design Framework for Adaptive Digital Twins.” CIRP Annals-Manufacturing Technology 69 (1): 145–148. doi:10.1016/j.cirp.2020.04.086.
- Huang, Runfei, and Zhongren Peng. 2008. “A Spatiotemporal Data Model for Dynamic Transit Networks.” International Journal of Geographical Information Science 22: 527–545. doi:10.1080/13658810701492399.
- Jabri, Sana, EL Miloudi EL Koursi, Thomas Bourdeaud’huy, and Etienne Lem-aire. 2010. “European Railway Trffic Management System Validation Using UML/Petri Nets Modelling Strategy.” European Transport Research Review 2 (2): 113–128. http://link.springer.com/journal/12544.
- Körner, Christine, May Michael, and Stefan Wrobel. 2012. “Spatiotemporal Modeling and Analysis-Introduction and Overview.” KI-Künstliche Intelligenz 26 (3): 215–221.
- Kraak, Menno-Jan. 2003. “The Space-Time Cube Revisited from a Geovisualizati-on Perspective.” Proceedings of 21st International Cartographic Conference, 1988-1996. Durban, South Africa. http://www.itc.nl/library/Papers_2003/art_proc/kraak.pdf.
- Laurini, Robert, Sylvie Servigne, and Guillaume Noel. 2005. “Soft Real-Time GIS for Disaster Monitoring.” In Geo-information for Disaster Management, edited by Peter Oosterom, Siyka Zlatanova, and Elfriede M. Fendel, 465–479. Heidelberg: Springer.
- Li, Deren. 2009. “An Overview of Earth Observation and Geospatial Information Service.” In Geospatial Technology for Earth Observation, edited by Deren Li, Jie Shan, and Jianya Gong, 1–25. New York: Springer.
- Pelekis, Nikos, Babis Theodoulidis, Ioannis Kopanakis, and Yannis Theodoridis. 2004. “Literature Review of Spatio-Temporal Database Models.” The Knowledge Engineering Review 19 (03): 235–274. doi:10.1017/S026988890400013X.
- Stoter, Jantien, Ken Arroyo Ohori, and Francesca Noardo. 2021. “Digital Twins: A Comprehensive Solution or Hopeful Vision?” The GIM International, October 4. https://www.gim-international.com/content/article/digital-twins-a-comprehensive-solution-or-hopeful-vision.
- Tao, Fei, Fangyuan Sui, Ang Liu, Qinglin Qi, Meng Zhang, Boyang Song, Zi-rong Guo, Stephen C. Y. Lu, and Andrew Y. C. Nee. 2018. “Digital Twin Driven Product Design Framework.” International Journal of Production Research 57 (1): 1–19. doi:10.1080/00207543.2018.1443229.
- Tomiyama, Tetsuo, Eric Lutters, Rainer Stark, and Michael Abramovici. 2019. “Development Capabilities for Smart Products.” CIRP Annals 68 (2): 727–750. doi:10.1016/j.cirp.2019.05.010.
- Torrens, Paul M. 2009. “Process Models and Next-Generation Geographic Information Technology.” In GIS Best Practices: Essays on Geography and GIS, edited by ESRI, 63–75. Redlands: ESRI.
- Worboys, Michael F. 2005. “Event-oriented Approaches to Geographic Phenomena.” International Journal of Geographical Information Science 19 (1): 1–28. doi:10.1080/13658810412331280167.
- Xia, Huiqiong, Deren Li, and Zhengfeng Shao. 2007. “Research and Implementation of Event-Based Spatio-Temporal Data Model with Integrated Vector and Raster Data Structure.” Proceedings of International Symposium on Multi-spectral Image Processing and Pattern Recognition, Wuhan, China, November. doi:10.1117/12.748766.
- Xue, Cunjin, Chenghu Zhou, Fenzhen Su, and Jiong Xie. 2010. “Research on Process-Oriented Spatio-Temporal Data Model.” Acta Geodaetica et Cartogra-phica Sinica 39 (1): 95–101.
- Yuan, May. 2001. “Representing Complex Geographic Phenomena in GIS.” Car-tography and Geographic Information Science 28 (2): 83–96. doi:10.1559/152304001782173718.
- Yuan, May, and Kathleen S. Hornsby. 2011. “Data Modeling Approaches for Geographic Dynamics Understanding.” In Computation and Visualization for Understanding Dynamics in Geographic Domains: A Research Agenda, edited by May Yuan and Kathleen S. Hornsby, 31–46. Boca Raton: CRC Press.
- Zheng, Liang, Deren Li, and Shuangfeng Wei. 2006. “The Application and Research of an Improved Event-Based Spatio-Temporal Data Model.” Proceedings of Society of Photo-Optical Instrumentation Engineers (SPIE) Conference Series. doi: 10.1117/12.712652.
- Zhu, Qing, and Mingyuan Hu. 2010. “Semantics-based 3D Dynamic Hierarchical House Property Model.” International Journal of Geographical Information Science 24 (2): 165–188. doi:10.1080/13658810802443440.
- Zhu, Qing, Liguo Zhang, Yulin Ding, Han Hu, Xuming Ge, Mingwei Liu, and Wei Wang. 2022. “Form Real 3D Modeling to Digital Twin Modeling.” Acta Geodaetica et Cartographica Sinica 51 (6): 1040–1049.