
 ?Mathematical formulae have been encoded as MathML and are displayed in this HTML version using MathJax in order to improve their display. Uncheck the box to turn MathJax off. This feature requires Javascript. Click on a formula to zoom.
ABSTRACT
Travel recommendations form a major part of tourism service. Traditional collaborative filtering and Markov model are not appropriate for expressing the trajectory features, for travel preferences of tourists are dynamic and affected by previous behaviors. Inspired by the success of deep learning in sequence learning, a personalized recurrent neural network (P-RecN) is proposed for tourist route recommendation. It is data-driven and adaptively learns the unknown mapping of historical trajectory input to recommended route output. Specifically, a trajectory encoding module is designed to mine the semantic information of trajectory data, and LSTM neural networks are used to capture the sequence travel patterns of tourists. In particular, a temporal attention mechanism is integrated to emphasize the main behavioral intention of tourists. We retrieve a geotagged photo dataset in Shanghai, and evaluate our model in terms of accuracy and ranking ability. Experimental results illustrated that P-RecN outperforms other baseline approaches and can effectively understand the travel patterns of tourists.
1. Introduction
With the rapid development of tourism industry, major changes have taken place in tourists’ travel behavior (Uriely Citation2005; Rodríguez et al. Citation2012). Pre-organized itineraries or packages recommended by travel agencies are no longer the first choices of tourists. Personalized travel arrangements are favored by more and more tourists (Uriely Citation2005; Hyde and Lawson Citation2003; Mou et al. Citation2020b). Online travel platforms provide tourists with convenient information services, but tourists often need to spend much energy and time reading and filtering information to aid itinerary planning (Majid et al. Citation2013; Kolahkaj et al. Citation2020). Therefore, how to intelligently recommend personalized tourist routes through aggregating information is an urgent problem in tourism research (Leask Citation2010; Buhalis and Law Citation2008; Santos et al. Citation2019).
The popularity of smartphones and the rise of social media have allowed tourists to share their geographic location information anytime and anywhere (Li et al. Citation2019), leading to an accumulation of large amounts of geotagged data on social media (Cai et al. Citation2018b; Koswatte, McDougall, and Liu Citation2018; Yan et al. Citation2020). As a typical representative of tourists’ collective wisdom, these volunteered geographic information data metaphor the travel trajectory, expose travel preferences of tourists, and provide another way for personalized tourist route recommendations research (Xu et al. Citation2021; Huang et al. Citation2021a; Wu et al. Citation2019). Currently, research on using geotagged social media data for travel recommendations has been carried out and with some results (McKercher et al. Citation2014; Hannam, Butler, and Paris Citation2014). However, most of the current research only uses the traditional recommendation model, or make limited improvement, while the research on fine-grained movement pattern analysis and personalized travel recommendation is still in its early stages (Hannam, Butler, and Paris Citation2014; Liao and Zheng Citation2018; Yuan Citation2018).
Firstly, most studies stress travel preferences of the majority, ignoring the specific needs of individual tourists (Kim et al. Citation2013; Zheng, Huang, and Li Citation2017; Xiaoyu Sun, Huang, and Peng Citation2018). Secondly, the existing studies rarely consider the order of visitation of tourist attractions (Xia, Zeephongsekul, and Packer Citation2011; Yang, Fik, and Zhang Citation2013), which is usually thoughtless, for the next visit of the tourist is closely linked to historical choice and its order (Song et al. Citation2010; Zheng, Huang, and Li Citation2017). Thirdly, current research rarely discusses the dynamic change of tourists’ interest, since uncertain information such as traffic, weather, or emergencies is not only random but also changing over time (McKercher et al. Citation2014; Verbeeck, Vansteenwegen, and Aghezzaf Citation2016; Kolahkaj et al. Citation2020), resulting in changes in interest over time. Finally and most importantly, tourists may conduct different travel behaviors at different times, leading to different importance of tourist attractions at different times (Wang et al. Citation2021; Brum-Bastos, Long, and Demšar Citation2018; Xu et al. Citation2022). For example, tourists make their way to airports, hotels, restaurants, and attractions. Airports and hotels have a greater impact on the check-in of attractions than restaurants, although their check-in order is not next to each other. Therefore, how to integrate various complex information to precisely model the behavior of tourists and recommend personalized travel routes still faces many challenges (McKercher et al. Citation2014; Hannam, Butler, and Paris Citation2014).
The latest development of neural networks gives us a new perspective on this issue. In this study, we introduce a personalized recurrent neural network recommendation model, called P-RecN, which can address the temporal relationship of historical visits and capture important travel behaviors. More specifically, a trajectory encoding module is designed to extract semantic features from tourists’ trajectory data and travel background as input. Then, the sequential travel behavior of tourists is simulated using two independent Long Short Term Memory networks (LSTM), one encoding the travel history of the previous stage and the other recommending potential tourist attractions for the next stage with beam search technique. Furthermore, our model introduces a temporal attention mechanism to capture tourists’ movement patterns in temporally correlated environments.
Travel trajectories are reconstructed from geotagged photos and comparative experiments are designed using several state-of-the-art methods. Results indicate that the P-RecN model is achievable, with higher accuracy than other baselines. We further explore the short-term and long-term dependence of various attractions in travel trajectories and explain the travel patterns of tourists. This research may contribute to the expansion of the mobility analysis of tourists in the direction of active integration of artificial intelligence technology into smart tourism.
The rest of this paper is organized as follows: section 2 reviews the related work; section 3 introduces the P-RecN model; section 4 compares the performance of different models; section 5 discusses the advantages and limitations of the model, as well as its application in practice; section 6 concludes this paper and suggests future work.
2. Related work
Numerous work has solved the task of attractions recommendation and route planning in recent years, and we emphasize the three tasks most related to this research and enumerate some representative literature.
2.1 Conventional attraction recommendation
Collaborative filtering (CF), the most representative, achieves recommendation by measuring the similarity of tourists or attractions (Cui, Luo, and Wang Citation2018; Bao et al. Citation2015). Xu, Chen, and Chen (Citation2015) used CF to provide recommendations for tourists with similar topic preferences. Majid et al. (Citation2013) constructed a tourist-attraction adjacency matrix based on geotagged photos and predict the preference value of tourists to attractions. To alleviate data sparsity, different contextual information has been taken into consideration, including geographic influence, social relationships, time, etc. For example, Huang (Citation2016) has designed three context-aware CF that can recommend attractions matching tourists’ preferences and context. Content-based methods are another popular recommendation model that builds preference models by extracting the features of tourists and attractions, which can resist the cold-start problem (Bao et al. Citation2015; Bobadilla et al. Citation2013). But its recommendation accuracy depends on the manual design of feature engineering and the fine construction of preference models. Neural networks have no strict requirements on data, can fit the complex relationship of tourism data and accurately model the implicit features of the interaction between tourists and attractions without complex feature extraction engineering.
The transfer relationship between attractions has been included in travel recommendation and Markov Chain (MC) is a common state transfer model. Xia, Zeephongsekul, and Packer (Citation2011) simulated the temporal and spatial movement of tourists using a Semi-Markov model. Kurashima et al. (Citation2013) presented a Topic-Markov method to analyze tourists’ preferences and achieve continuous attraction prediction. Liu and Wang (Citation2018) used high-order MC to capture sensitive visits in travel history. However, the MC-based method relies on the assumption of strong independence between different positions in the sequence and has a drawback in capturing long-term dependencies. Existing study also shows that high-order MC has complex calculation problems, and discarding part of the data cannot describe the complete information of the entire travel trajectory (Song et al. Citation2010; Zheng, Huang, and Li Citation2017).
Machine Learning has become an increasingly powerful tool in tourism recommendation research (Deng and Li Citation2018; Sun et al. Citation2019). Wan et al. (Citation2018) trained two classifiers, K-Nearest Neighbor and Bayes, to quantify season, temperature, weather and location history of tourists to predict the next attraction. Xiaoyu Sun et al. (Citation2018) used Support Vector Machine (SVM) and Gradient Decision Boosting Tree to improve the sorting effect of the ranking list of attraction recommendations. Ding and Chen (Citation2018) suggested a personalized POI recommendation model, which embeds the categorical, geographical and co-visiting influences into the deep neural network. These studies have made significant contributions to the research on personalized travel recommendation. They concentrate on successful query processing from a given dataset, whereas our model is a semi-supervised learning model that focuses on capturing the intrinsic movement patterns of trajectories from tourists’ travel histories.
2.2 Travel route recommendation
Route recommendation aims to generate a continuous sequence of attractions that meet specific constraints and maximize the obtained utility. Most studies model it as Orienteering Problem (OP) or its variants (Gavalas et al. Citation2014; Gunawan, Lau, and Vansteenwegen Citation2016; Sarkar et al. Citation2020). Kotiloglu et al. (Citation2017) proposed a framework of ‘filter-first, tour-second’ and discussed the multi-constraint and multi-period problems of route planning. Lim et al. (Citation2018) considered the time budget and personalized visit time characteristics to maximize the global benefits of attraction popularity and interest preferences. Different constraints and utility gains will bring different itinerary generation solutions. Zheng, Liao, and Qin (Citation2017) considered the variable sightseeing value of attractions and the aesthetic fatigue of tourists, and proposed a four-step heuristic algorithm for one-day tour routes recommendation. Later, Liao and Zheng (Citation2018) further discussed this issue in a time-related constraint to improve the reliability of route design. These researches have tried to simulate the complex reality of tourists and attractions (such as attraction opening hours, consumption budget, etc.) and excellent recommendation performance has been proven. However, tourism activities are a changeable process, and certain constraints may not support the dynamic use of the model. In contrast, P-RecN is a data-driven algorithm, which relies on the powerful self-learning and self-organization capabilities of neural networks to capture the inherent movement patterns presented by trajectory data.
2.3 RNN-based trajectory learning
Recurrent Neural Network (RNN) has emerged as the most promising model for solving location sequence learning problems, and contextual data can be successfully incorporated into the RNN structure. May Petry et al. (Citation2020) suggested a trajectory classification method based on attribute embedding and RNNs to capture trajectory sequence patterns. Liu et al. (Citation2019) used a Gated Recurrent Unit to model spatio-temporal behavior of tourists. Yi et al. (Citation2020) used Large-scale Information Network Embedding to obtain location vector representation, and applied BiLSTM-CNN for locations recommendation. However, most RNN models rely on the last hidden layer vector when calculating the output, which makes it difficult to understand the specific part of the input sequence. It is worth noting that these works are orthogonal to ours. The difference lies in the fact that we use an encoder-decoder framework to model the location sequence learning problem, propose a semi-supervised learning method to capture the main behavior intention and sequential patterns implicit in the trajectory, and generate the recommended route in an end-to-end manner.
3. Methodology
3.1 Definition and framework
The personalized tourist route recommendation is modeled as a sequence learning problem. Given a tourist’s continuous visit history in a period, the purpose of the P-RecN model is to recommend a tourist route
that the tourist is most likely to visit in the next period, where
represents the i-th visited attraction of the tourist, and
represents the
attraction to be visited next.
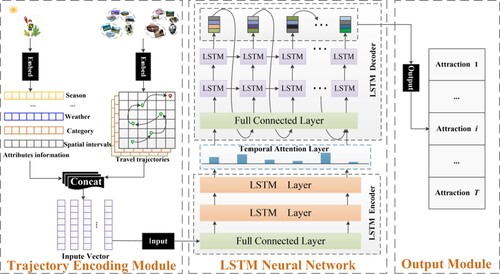
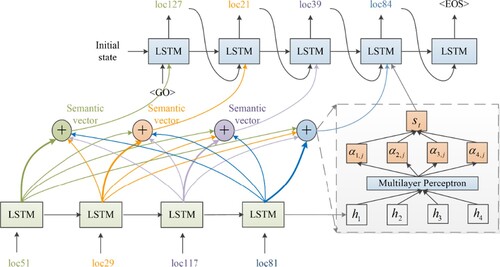
Given the above definition, the workflow of the P-RecN model is shown in , which includes three parts: a trajectory encoding module that integrates tourist trajectory information and context information, an LSTM encoder-decoder neural network module combined with a temporal attention mechanism, and an output module. Detailed information and functions of each part of the model will be introduced in the following sections.
Figure 1. Research workflow of P-RecN.
3.2 Trajectory encoding module
Data in neural networks is transmitted in the form of vectors. The trajectory encoding module of P-RecN can map the trajectory information and context information that affect the selection of attractions into feature vectors, making the training process more efficient. Considering the sparsity and heterogeneity of different information, we use an embedding layer to uniformly encode them. In neural networks, the embedding layer can map enumeration values representing similar patterns into adjacent latent spaces to obtain low-dimensional dense vectors. shows an example of encoding a single tourist trajectory. These different types of context information are mapped into d-dimensional vectors by one-hot encoding. One-hot encoding mainly uses an N-bit state register to encode N states, and only the position of the corresponding attribute value is 1. In our example, there are 9 types of attractions, so the one-hot encoded attraction category vector has 9 dimensions, and Nanjingxilu in corresponds to the third element in the encoded vector. The encoded vectors are multiplied by their respective embedding matrices to convert discrete vectors into efficient but meaningful embedding representations for deep learning algorithms that reduce latent space dimensionality while better measuring their similarity.
Figure 2. An example of tourist travel trajectory embedding.
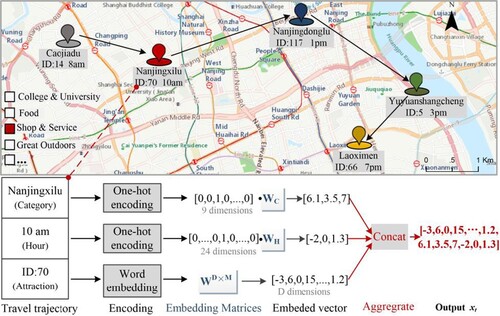
In this paper, we randomly assign each attraction a unique ID to mark the attraction’s unique identity, and tourists’ travel trajectories are represented by continuous attractions ID strings. But ID strings cannot represent the co-occurrence relationship between attractions and cannot be directly used as neural network input. Therefore, the study adopts word embedding technology to learn the representation of attractions. The method converts attraction IDs into a dense vector of continuous values by learning an embedding matrix WD×M, where M is the number of attractions and D is the embedding dimension of the attractions. The word embedding acts on the trajectory data, it is natural to treat each attraction as a word, the attraction set as the total vocabulary, and each attraction is identified by a unique attraction ID in the same way as the word ID. The embedding matrices can be randomly initialized and trained with other components of P-RecN or initialized with pretrained embeddings.
Different information must be aggregated to be fed into the recurrent component of P-RecN for tourist sequence behavior learning. The study employs a connection function to fuse different embedding vectors in a concatenated manner, so that at time t, all trajectory features and contextual information are contained in the input vector xt, as shown in .
3.3 LSTM encoder–decoder neural network
The interaction of attractions occurs in a certain order, and LSTM is the mainstream technology of sequence learning in neural networks, where it is used to capture the high-order dependencies of the previous attraction on the next. LSTM is a variant of RNN (Hochreiter and Schmidhuber Citation1997). It introduces a new hidden state, called cell state, which stores the summary of past interaction. The calculation process is shown in . ft, it, and ot respectively represent the forget gate, input gate and output gate, which control the discarding, updating and outputting of the amount of information in the cell memory.
Figure 3. Structure of LSTM neural network unit repeating module.
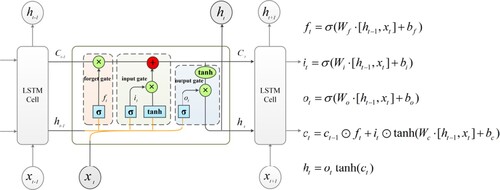
Specifically, given the previous attraction embedding sequence, LSTM takes each attraction interaction as input, and outputs the corresponding hidden state
after three gate mechanisms. Each hidden state ht contains information about the current moment and the previous moment. At the same time, ht also captures the sequential pattern of the entire sequence until time t. Where σ indicates a sigmoid function, defined as
. Tanh, a hyperbolic tangent function, is used to adjust the value flowing through the neural network. ⊙ is element-wise multiplication.
To establish the mapping relationship between historical visits and recommendation results, we stack the LSTM neural units into an encoder-decoder structure. Specifically, the encoder is constructed to analyze the sequence features hidden in the travel trajectory, and the decoder is used to generate the output sequence. Unlike the LSTM structure, the input and output trajectory lengths of LSTM-based encoder-decoder are variable, and its training process is an end-to-end process, which has great flexibility for sequence-to-sequence modeling tasks.
As shown in , the encoder inputs the travel trajectory of length T recursively, and gradually updates the hidden state ht and cell state ct. After T time steps, the encoder compresses the hidden state of each time step into a fixed semantic vector S through a function
. The decoder can be regarded as the inverse operation of the encoder, using a virtual identifier y0 as the first input, and then decoding the corresponding hidden state according to the semantic vector S and the output
of the previous step.
(3.1)
(3.1)
(3.2)
(3.2)
(3.3)
(3.3)
Figure 4. LSTM encoder-decoder module.
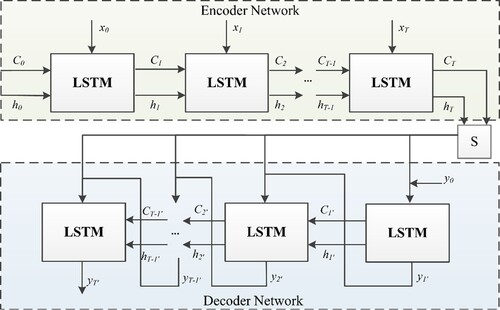
where and
represent the hidden states of the encoding and decoding stages. During the decoding stage, the decoder generally chooses the candidate with the maximum conditional probability as the current optimum result.
(3.4)
(3.4) To reduce the impact of error propagation, beam search technique is used to find the global optimal solution (Sutskever, Vinyals, and Le Citation2014). It can select the K alternatives with the maximum conditional probability for the input of each time step of the decoders. After T iterations, K candidate sequences are generated as the most probable K recommendation results. The K highest probabilities here do not only refer to the highest probability at the current moment but the sum of the cumulative probabilities on the entire path up to now. Like other studies, the K is set to 3, because a larger value does not always help improve model performance (Huang et al. Citation2021b; Li et al. Citation2020). The decoder combined with beam search technology outputs the global optimal solution and inputs it to the output module. The output module acts as a sorting function, selecting the best trip from the candidate paths generated by the decoder as the target route.
Despite using beam search technology, a potential problem of the encoder-decoder is that the encoder compresses all travel history into a fixed-length vector, which will inevitably lose important information. The decoder relies on the final semantic vector and cannot accurately understand the importance of each attraction. Especially, the more tourist attractions tourists visit, the more obvious the importance of tourist attractions at a different time. To fill this gap, a temporal attention mechanism is introduced to force the decoder to select input vectors closely related to the current output.
3.4 Temporal attention mechanism
The attention mechanism can make the neural network pay more attention to the important information in the input and reduce the interference of irrelevant information. It has been widely used in the fields of machine translation and computer vision (Chaudhari et al. Citation2021; Vaswani et al. Citation2017). Here, a temporal attention is designed to allow the decoder to dynamically select important parts of the past behavior sequence to focus on the main intention of the tourist. Its essence is the alignment model between the target attraction and each attraction in the historical trajectory. By learning the influence weights of all hidden states and retrieving their weighted sum, the dynamic time correlation between the future and historical time steps is captured. The weighted sum of the hidden states is interpreted as the main intent feature of the tourist. shows the structure of the model.
Figure 5. The network structure of temporal attention.
Given the previous hidden stateand cell state
in the decoder, the dependency correlation
between the hidden state ht and the output of future time step
is measured by a multilayer perceptron.
(3.5)
(3.5) where
,
,
and
represent the parameters that need to be learned. The temporal attention weights of different hidden states are normalized into [0, 1] using a softmax function. Then the temporal attention semantic vector
is calculated by the weighted sum:
(3.6)
(3.6)
(3.7)
(3.7) Among them,
represents the semantic vector corresponding to time t, and
represents the normalized attention weights. The higher the value is, the more attention will be paid to the input.
3.5 Network learning
Given the historical trajectory record of a tourist
, the current query time
, and the query attractions set
, our goal is to train an optimal parameter loss to match the
mapping relationship. The objective function is formulated by a log-likelihood function as follows:
(3.8)
(3.8) where Θ is the model parameters set. Φ is the set of
and
. The complexity of the model comes mainly from the space complexity and the amount of computation (time complexity). The space complexity O(m) is determined by the number of parameters m of the model. The amount of computation directly determines the forward time of the model and the training/prediction time. The study uses Stochastic Gradient Descent (SGD) technique and Back Propagation Through Time (BPTT) algorithm to optimize the network parameters with a time complexity O(n), where n is the number of multiply-accumulate operations. We also use dropout technology to reduce the risk of overfitting, enabling each neuron to have some probability of not participating in forward and backward propagation.
4. Experiments
4.1 Datasets
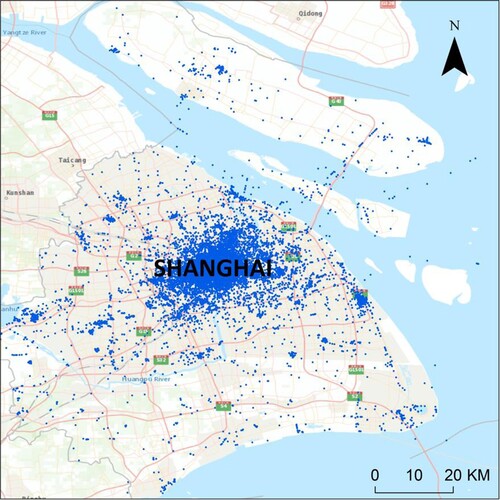
In our work, 768,817 geotagged photos are collected from January 2004 to December 2018 in Shanghai, China through the public API of Flickr. Flickr, a popular social media website, accumulates hundreds of millions of geotagged photos taken by photographers and is a widely used data source in travel recommendations studies (Su et al. Citation2016; Miah et al. Citation2017; Mou et al. Citation2020aa). We also extract the descriptive information of each photo, including: ‘Flickr ID’, ‘user ID’, ‘latitude’, ‘longitude’, ‘datetaken’, ‘tags’, ‘title’, and so on. In order to obtain high-precision data, the original data needs to be preprocessed: (1) Eliminating the records whose geographic locations are outside Shanghai; (2) Deleting duplicate records, that is, there are multiple similar photos in the same location at the same time, and the tag information is used to judge the similarity; (3) Deleting non-tourism data based on whether the tag information is related to Shanghai tourism (Sun et al. Citation2015); (4) Remove local residents. Compared with tourists, residents can take photos at any time of the year, so a heuristic approach based on stay periods was used to distinguish tourists and residents, and the maximum duration is set to 21 days by checking the time span between the first and last photos (De Choudhury et al. Citation2010; Girardin et al. Citation2008; Derdouri and Osaragi Citation2021). Finally, 79,201 photos are retained, and the location distribution is shown in . It can be seen that the spatial distribution of tourists’ photo locations is uneven. Most of the shooting locations are concentrated in the city center, while relatively few are located in the suburban areas.
Figure 6. Spatial distribution of Flickr photo data in Shanghai.
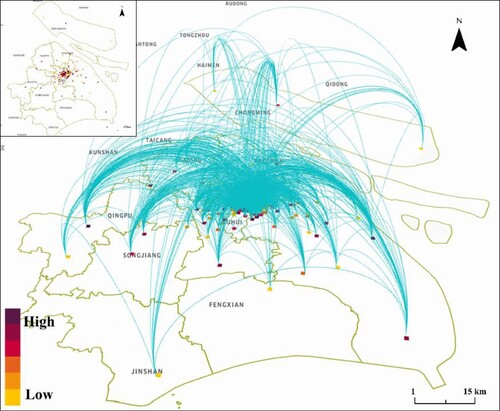
Here, an attraction is defined as a special region that is popular in a city and attracts tourists to visit and take photos. It refers not only to a traditional resort, but also to a park, a museum, and even a popular area on the street. Because of this, the behavior of tourists uploading photos is viewed as a positive vote that the location is worth a visit, and extracting tourist attractions from a Flickr photo collection can be regarded as a clustering problem for identifying dense photographic locations (Chen, Arribas-Bel, and Singleton Citation2019; Chen, Arribas-Bel, and Singleton Citation2020). Therefore, DBSCAN algorithm is used to cluster the geographical location of photos, and each cluster is identified with a uniquely determined ID used to mark the identity of attractions (Sun et al. Citation2015). Based on the time when the photos were taken, connecting tourist attractions allows further building of travel trajectories. If the time difference between visits to consecutive attractions is more than 8 h, we will further divide this travel history into separate travel sequence. Afterward, the tourists with less than three attractions and the attractions visited by less than five tourists are eliminated to address data sparseness issues. In the end, a total of 129 tourist attractions and 11,307 valid trajectory records of 4854 tourist are obtained. plots the distribution of these trajectories in Shanghai.
Figure 7. Spatial distribution of tourist attractions and tourist trajectory.
To better portray tourists’ travel background, other contextual information is added to the original data. shows the specific examples of attraction context information. Weather information is collected in Weather Underground (wundgerground.com) and added to every historical visit of tourists. We define attraction popularity based on the number of attraction visits, and divide attraction categories into nine different types based on Foursquare.com, the nature of local tourist attractions and previous research (Kotiloglu et al. Citation2017; Deng et al. Citation2019): Arts & Entertainment, Great Outdoors, Shop & Service, College & University, Food, Travel & Transport, Residence, Nightlife Spots, Professional & Other Places.
Table 1. Attributes description of tourist attractions in Shanghai.
4.2 Experiment setup
4.2.1 Baseline methods
In the experiments, the P-RecN model is compared with several baselines. For each baseline method, the best parameter settings are used in the paper, and the source code and python package provided by the original paper are used for implementation. Several variants of our methods are also implemented for comparison purposes.
POP: A simple approach that selects popular attractions from all attractions to build recommended sequence.
LSTM: LSTM has shown its superiority in human trajectory learning.
LSTM-seq2seq: One LSTM is used to encode the input sequence, and the other LSTM is used to iteratively predict future sequences.
POIRank: POIRank uses RankSVM to calculate the POI score, taking into account contextual information such as category and popularity, and then connects them according to the score to recommend trajectories.
ST-RNN: An RNN-based method that combines temporal and spatial features to predict the next location.
DeepMove: A recurrent neural network with attention mechanism that jointly integrates several factors to learn trajectory sequential patterns.
PersTour (Lim et al. Citation2018): An OP solution to construct travel itinerary based on tourists’ interest and the variability of the duration of visits to attractions, where the time budget includes both personalized visit duration and traveling time.
PWP (Sarkar and Majumder Citation2021): It provides multiple itineraries considering the interest of visitors, popularity of itineraries and the travel cost.
P-RecN-nc: A variant model of P-RecN without any contextual information.
P-RecN-na: The model uses the same framework of P-RecN, but without attention structure.
4.2.2 Evaluation metrics and parameter setting
This paper uses Recall, Precision and F1-score as the evaluation metrics. Among them, Recall refers to the percentage of attractions that appear in the recommended result as well as in the actual travel route, and Precision refers to the percentage of attractions that appear in the actual travel route as well as in the recommended result. F1-score represents the harmonic mean of Recall and Precision. We also use Mean Absolute Error (MAE) as the model error evaluation metrics to evaluate the reliability and accuracy of recommended itineraries.
The visiting order is a significant part of the recommended route and Pairs-F1 (Chen, Ong, and Xie Citation2016) is adopted to evaluate the quality of sequential recommendations. It considers both visiting order and correctness of each pair of attractions by calculating the F1-score of attraction pairs, regardless of whether they are adjacent.
(3.9)
(3.9)
The value of Pairs-F1 is between 0 and 1, r* and p* are the Recall and Precision of ordered attraction pairs.
According to experimental requirements, each experiment is performed five times, and the average value is recorded as the final result. For the model setting, both the encoder and the decoder are set to have a two-layer LSTM structure. By comparing different values {64,128,256,512}, the final hidden state is set to 256. The model learning rate is set to 0.01, and the batch size is set to 64. To reduce the risk of overfitting, the dropout size is set to 0.5. All experiments are tested with Python 3.6 and TensorFlow 1.8. The implementation process is carried out on a 16G memory platform with Intel (R) Core (TM) i7-8700 @ 3.2 GHz and a single GPU acceleration.
4.3 Performance evaluation
presents the recommendation performance of various models. We can find that POP only gives suggestions through pure popularity selection, with the worst performance. Due to the positive influence of the encoder-decoder framework, the performance of LSTM-seq2seq is better than that of LSTM, but still does not achieve good performance. This indicates that a good neural network architecture is not enough to obtain good accuracy in the task of attraction recommendation. Combining the performance of ST-RNN and DeepMove, it can be seen that the RNN-based network structure combined with context information can better capture the sequence patterns and behavior preferences of tourists. From the performance of the two variants, we can see that the design of the trajectory encoding module and the temporal attention mechanism is indeed conducive to improve performance of route recommendation.
Table 2. Evaluation results among different models.
It can be seen from Pairs-F1 and MAE that the traditional recommendation model lacks the self-adjustment ability and the sequential recommendation performance is not ideal due to the accumulation of errors. In contrast, PWP and PersTour model route planning as an orienteering problem and adds additional constraints to control the selection of candidate attractions, and their performance is no less than that of the proposed model. It is observed that the performance of PWP is better than that of PersTour, which may be due to the fact that PWP places more emphasis on the popularity of itineraries and the interest of tourists. It is worth noting that P-RecN does not explicitly model features such as the popularity and category of attractions like PersTour and POIRank, but P-RecN still shows significant superiority. We attribute it to the result of natural selection during the training phase. In fact, P-RecN learns features such as popularity and category of attractions in an implicit and unexplainable way, and adaptively balances the relationship between the transition probability captured by LSTM and the context feature during the recommendation process. In short, as the motivation of our work, P-RecN is superior to previous work in learning the implicit information of trajectory data, especially the performance of sequence recommendation proves that the network architecture based on LSTM is effective in maintaining the order of attractions.
4.4 Sensitive analysis
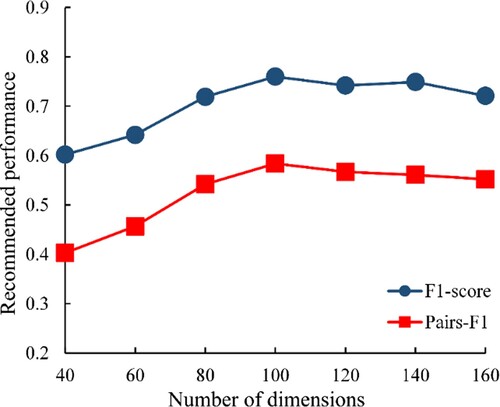
4.4.1 Influence of embedding dimension size
The embedding vector represents the location description of the real geographic entity in the latent space. The semantic relationship between attractions is learned from their co-occurrence (neighborhood relationship) in geographic space. Generally speaking, the larger the embedding dimension is, the more useful information the model captures. In , the performance of P-RecN increases as the embedding dimension increases, indicating that P-RecN cannot learn interactions of features with too small dimensions. It may be that the embedding dimension is too small and the hidden patterns are lost, and the embedding vector cannot satisfactorily express the implicit relationship between the attractions. On the other hand, the implicit interaction between attractions may be too complicated. Too high embedding dimension will weaken the relationship between attractions and lead to overfitting, i.e. P-RecN performs well on the training set but not well on the test. Of course, the larger the dimension, the greater the demand for computing resources (processing speed, memory consumption).
Figure 8. Influence of embedding dimension size.
4.4.2 Influence of different length input and output trajectories
shows the performance of the model under different length input and output sequences. We can find that the predictability of tourist preferences varies with the length of the input trajectory. On the one hand, with the increase of travel route length, the model can describe more travel information and its performance is improved. Good performance only on medium-length input trajectories may be due to the limitation of the Flickr data in Shanghai and that most tourists travel in a hurry and their trajectory is short. These problems force the model to use collective wisdom to generate recommendations. The recommendation bias may be caused by the inconsistency of some tourists’ travel intentions with the mainstream society. On the other hand, the performance of the model does not decrease significantly as the length of the travel trajectory increases, which means that the preference of tourists is not merely controlled by the length of the route. Contextual information, the dependence between different attractions, and the degree of dependence will also affect tourists’ travel decision-making.
Figure 9. Performance of different length input and output trajectories. (a) The performance of different length input trajectories; (b) the performance of different length output trajectories.
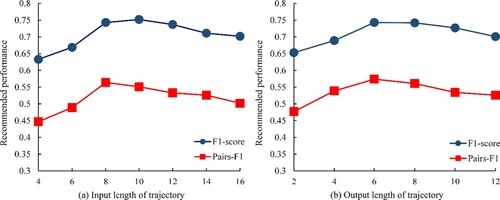
Similarly, as the recommended length changes, P-RecN also follows the trend of first increasing and then decreasing. The reason may be that when the recommended length is short, there are more candidate attractions, and the uncertainty of the recommended choice is greater. As the recommended length gradually increases, the model gradually accumulates experience and the recommendation performance improves. When the recommended route is longer, P-RecN still exhibits good performance. This may be attributed to two aspects of the model design: (1) temporal attention mechanism can efficiently calculate the correlation between recommended attractions and historical visits, and control the output of candidate attractions through parallel operations; (2) the beam search technology adaptively selects the best result when decoding the output to avoid the reduction of accuracy caused by the accumulation of errors. The experimental results further prove the superiority of the P-RecN model in the task of route recommendation.
4.5 Empirical analysis
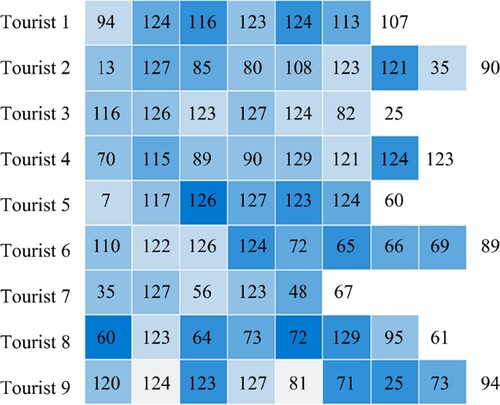
Taking the last attraction of tourists as the recommended target, the influence weights captured by the temporal attention mechanism in the historical trajectory is visualized. As is shown in , the different numbers represent different attractions. The color depth of the blue grid indicates how dependent the target attraction is on the historical visit. When recommending the target attraction, different orders of the same attraction in historical visits will impose different influence weights, which reveals that tourists’ travel itineraries and visiting orders of attractions are indispensable components in their travel history structures. Similarly, the order dependence of the target attractions on any attractions visited in the travel history does not monotonously change with the relative position of the attractions in the trajectory, revealing the randomness and uncertainty of individual behavior. Attractions with greater influence on target attractions may be visited early or recently, indicating that short-term and long-term dependencies are prevalent in tourists’ travel trajectories. Through the temporal attention mechanism, we can more intuitively comprehend the significance of different attractions and explore tourists’ potential travel preferences.
Figure 10. Visualization of temporal attention weights heat map of different attractions.
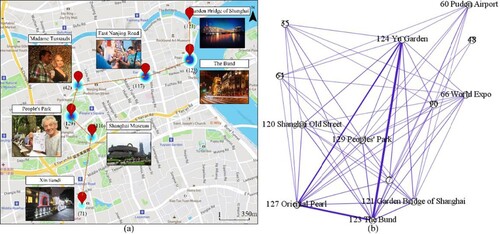
(a) shows a tourist’s travel trajectory in the physical space related to target attractions. The depth of blue color around the attractions indicates the dependence of the target attractions on historical visits. It can be found that attraction 121 is more dependent on attraction 129 and attraction 123, possibly because they have similar categories of attraction and shorter transfer distances. From (b), we can find that the tourist may prefer to choose attractions such as attraction 124, 127, 120 and 121 after visiting attraction 123. It is not easy to precisely locate tourist’s interests by digging out the popular preferences of tourist flow, this may require further consideration of the sequential movement patterns of tourists. We may notice that the frequent patterns mining results of FP-growth are also appeared in the representation results of attention mechanism ((a)), indicating that the model is effective in capturing the partial and overall travel patterns of tourists and achieving accurate recommendations. Overall, exploring the travel sequence and the primary behavioral intent of tourists will help us better understand the complicated travel rules in the real world.
Figure 11. Individual tourist travel trajectory and frequent pattern mining results associated with the target attraction: (a) individual tourist trajectory and corresponding temporal attention weights, (b) results of frequent patterns mining using FP-growth.
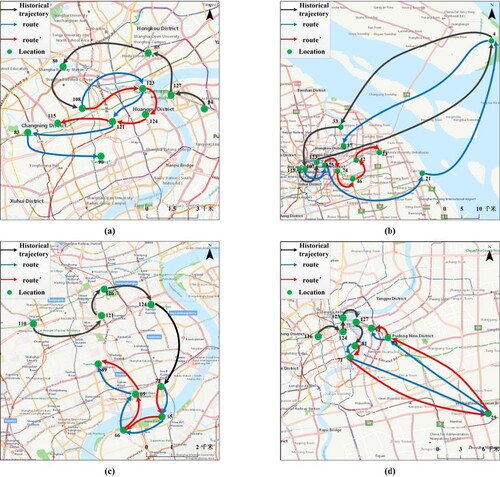
shows several typical cases recommended by the P-RecN model. It can be found that false recommendations also appear in the results, as shown in (a) and (b). There are possible reasons for this situation: (1) Similar to product and video recommendation, there is also a long-tail distribution phenomenon in travel recommendations, that is, most tourists focus on popular attractions, while tail attractions receive less attention; (2) The travel preferences of some tourists are quite different. This is a typical user cold start problem. The recommendation results cannot meet the special needs of these tourists, which is also in line with the reality. (a) and (b) also show two correct recommendation trajectories, which demonstrate the good performance of the proposed recommendation model.
Figure 12. Four representative recommended results of the P-RecN. (a) and (b) are incorrect recommendation results, (c) and (d) are completely correct recommendations. The black line represents the historical trajectory of tourists, the blue and red lines represent the actual route and the recommended result, respectively.
5. Discussion
Our model shows flaws while showing some superiority. First, P-RecN is essentially a data-driven method that automatically captures travel preferences from historical data without labor-intensive feature engineering, which greatly pushes the recommendation system to the intelligent direction. But the model needs to be continuously adjusted through a large number of parameters and nonlinear transformations to fit the complex travel mechanism in the real world. Compared with traditional methods, the neural network presents relatively less internal tourism information, which is not as rich as explanatory recommendation methods (Suresh Kumar et al. Citation2020; Montavon, Samek, and Müller Citation2018; Li et al. Citation2020). Second, the attraction category information input by the model may only be applicable to Shanghai. Due to differences in tourism resources, the input of attraction category features in different cities needs to be redefined. In addition, the contextual information involved in the model is only for general travel events, and the outbreak of specific events may not be conducive to model expansion, such as COVID-19 (Chinazzi et al. Citation2020). These fresh samples may hinder the generalization performance of the model, and the adaptability of the model to fresh samples still needs further improvement.
Furthermore, this study uses Flickr social media data to reconstruct the travel trajectory of tourists by establishing intelligent algorithms and rules, which provides a new idea for the study of tourism big data (Cenamor et al. Citation2017; Cai, Lee, and Lee Citation2018a). However, like other geotagged social media data, Flickr data is also subject to bias. In our case, the data used was not representative of every tourist who visited the city. For example, for some tourists who visited an attraction but did not take or upload a photo, we are not sure if the attraction is to the taste of the tourist. In addition, there are differences among contributors to Flickr data, active visitors may upload more photos, and their data may dominate the model learning process. Differences in the contribution of domestic and foreign tourists will also appear similar. These problems lead to the fact that the collective wisdom learned by the model through the tourist group may be concentrated in a specific group, and the differences in tourist behavior caused by tourist heterogeneity cannot be fully exploited. Nevertheless, the application of Flickr data in travel recommendation research is still interesting because it reflects tourists’ perception of temporal and spatial in real physical environments. The integration of more data sources will be our research focus, such as mobile phone signaling data, travel data, etc., which can make up for the challenges brought by the heterogeneity of tourists.
The proposed neural network model can provide personalized service in an environment that affects tourists’ travel preferences, which caters to the demand-oriented concept of smart tourism (Zheng and Liao Citation2019; Yang, Fik, and Zhang Citation2013). From personalized travel recommendation service to destination management, and then to crowd control, the proposed model offers broad application perspectives (Kang and Gretzel Citation2012; Mckercher and Lau Citation2008). Its most straightforward application is to optimize tourists’ travel experience. Personalized suggestions will be made available to specific tourists along the way, highlighting the optional attractions recommended by the model in the next tourist area. It can also predict the geographic distribution of future tourists. Tourism communities can make targeted adjustments to infrastructure and services to improve the adhesion and loyalty of tourists, which is conducive to the transformation of tourism communities from the construction and management of a single attraction to the development of a comprehensive destination. Moreover, it can also reveal the potentially crowded areas, and provide early warning information for those recommended to these areas. This is in line with the operating laws of tourism market and is very important for the sustainable development of tourism.
6. Conclusions and future work
Understanding tourists’ travel behavior and recommending attractions or itineraries have become a hotspot for research in recent years (Yang, Fik, and Zhang Citation2013; Wong and McKercher Citation2012; Yeh and Cheng Citation2015). In this article, we present a neural network model to understand the potential movement patterns from tourists’ travel trajectories and recommend personalized travel routes. LSTMs are used to learn sequential behaviors from trajectory-encoded data, combined with a temporal attention mechanism to capture tourists’ complex behavioural preferences. An offline experiment is designed from geotagged photos to assess the model performance. Results show that our model has higher recommendation performance than other baselines. Besides, we further explore the influencing factors of the model and analyze the tourists’ travel patterns presented by the model. In short, this tourist recommendation method based on neural network may provide valuable insights for smart tourism research.
In the future, there is still much to explore. First, more Flickr datasets will be applied to validate model performance. And other travel information will be reviewed from the geotagged photo, such as social relations and demographic characteristics of tourists (Al-Shamri Citation2016; Xiang and Gretzel Citation2010). This information has been proven to be a significant element in improving the quality of travel recommendations. Second, statistical tests (such as Friedman testing, Nemenyi test) also need to be formed and further analyzed, which is crucial for model performance exploration. Finally, studying the interpretability of neural networks in the travel recommendation process is also a focus of future work, which is important for the promotion of neural network models in the tourism industry.
Disclosure statement
No potential conflict of interest was reported by the author(s).
Data availability statement
The data that support the findings of this study are openly available in figshare at https://figshare.com/s/eb75e27d6baa568962df.
Additional information
Funding
References
- Al-Shamri, Mohammad Yahya H. 2016. “User Profiling Approaches for Demographic Recommender Systems.” Knowledge-Based Systems 100: 175–187. doi:10.1016/j.knosys.2016.03.006.
- Bao, J., Y. Zheng, D. Wilkie, and M. Mokbel. 2015. “Recommendations in Location-Based Social Networks: A Survey.” Geoinformatica 19 (3): 525–565. doi:10.1007/s10707-014-0220-8.
- Bobadilla, J., F. Ortega, A. Hernando, and A. Gutiérrez. 2013. “Recommender Systems Survey.” Knowledge-Based Systems 46: 109–132. doi:10.1016/j.knosys.2013.03.012.
- Brum-Bastos, Vanessa S., Jed A. Long, and Urška Demšar. 2018. “Weather Effects on Human Mobility: A Study Using Multi-Channel Sequence Analysis.” Computers, Environment and Urban Systems 71: 131–152. doi:10.1016/j.compenvurbsys.2018.05.004.
- Buhalis, Dimitrios, and Rob Law. 2008. “Progress in Information Technology and Tourism Management: 20 Years on and 10 Years After the Internet—The State of eTourism Research.” Tourism Management 29 (4): 609–623. doi:10.1016/j.tourman.2008.01.005.
- Cai, Guochen, Kyungmi Lee, and Ickjai Lee. 2018a. “Itinerary Recommender System with Semantic Trajectory Pattern Mining from Geo-Tagged Photos.” Expert Systems with Applications 94: 32–40. doi:10.1016/j.eswa.2017.10.049.
- Cai, Ling, Jun Xu, Ju Liu, and Tao Pei. 2018b. “Integrating Spatial and Temporal Contexts Into a Factorization Model for POI Recommendation.” International Journal of Geographical Information Science 32 (3): 524–546. doi:10.1080/13658816.2017.1400550.
- Cenamor, Isabel, Tomás de la Rosa, Sergio Núñez, and Daniel Borrajo. 2017. “Planning for Tourism Routes Using Social Networks.” Expert Systems with Applications 69: 1–9. doi:10.1016/j.eswa.2016.10.030.
- Chaudhari, Sneha, Varun Mithal, Gungor Polatkan, and Rohan Ramanath. 2021. “An Attentive Survey of Attention Models.” ACM Transactions on Intelligent Systems and Technology 12 (5): 1–32. doi:10.1145/3465055.
- Chen, Meixu, Dani Arribas-Bel, and Alex Singleton. 2019. “Understanding the Dynamics of Urban Areas of Interest Through Volunteered Geographic Information.” Journal of Geographical Systems 21 (1): 89–109. doi:10.1007/s10109-018-0284-3.
- Chen, Meixu, Dani Arribas-Bel, and Alex Singleton. 2020. “Quantifying the Characteristics of the Local Urban Environment Through Geotagged Flickr Photographs and Image Recognition.” ISPRS International Journal of Geo-Information 9 (4): 264. doi:10.3390/ijgi9040264.
- Chen, Dawei, Cheng Soon Ong, and Lexing Xie. 2016. “Learning points and routes to recommend trajectories.” Proceedings of the 25th ACM International on Conference on Information and Knowledge Management. 2016-01-01.
- Chinazzi, Matteo, Jessica T. Davis, Marco Ajelli, Corrado Gioannini, Maria Litvinova, Stefano Merler, Ana Pastore Y, et al. 2020. “The Effect of Travel Restrictions on the Spread of the 2019 Novel Coronavirus (COVID-19) Outbreak.” Science 368 (6489): 395–400. doi:10.1126/science.aba9757.
- Cui, Ge, Jun Luo, and Xin Wang. 2018. “Personalized Travel Route Recommendation Using Collaborative Filtering Based on GPS Trajectories.” International Journal of Digital Earth 11 (3): 284–307. doi:10.1080/17538947.2017.1326535.
- De Choudhury, Munmun, Moran Feldman, Sihem Amer-Yahia, Nadav Golbandi, Ronny Lempel, and Cong Yu. 2010. “Automatic construction of travel itineraries using social breadcrumbs.Paper presented at the Proceedings of the 21st ACM conference on hypertext and hypermedia (HT' 10).Toronto, Ontario, Canada.June 13–16, 2010.
- Deng, Ning, and Xiang Robert Li. 2018. “Feeling a Destination Through the “Right” Photos: A Machine Learning Model for DMOs’ Photo Selection.” Tourism Management 65: 267–278. doi:10.1016/j.tourman.2017.09.010.
- Deng, Ning, Jiayi Liu, Ying Dai, and Hong Li. 2019. “Different Cultures, Different Photos: A Comparison of Shanghai's Pictorial Destination Image Between East and West.” Tourism Management Perspectives 30: 182–192. doi:10.1016/j.tmp.2019.02.016.
- Derdouri, Ahmed, and Toshihiro Osaragi. 2021. “A Machine Learning-Based Approach for Classifying Tourists and Locals Using Geotagged Photos: The Case of Tokyo.” Information Technology & Tourism 23 (4): 575–609. doi:10.1007/s40558-021-00208-3.
- Ding, Ruifeng, and Zhenzhong Chen. 2018. “RecNet: A Deep Neural Network for Personalized POI Recommendation in Location-Based Social Networks.” International Journal of Geographical Information Science 32 (8): 1631–1648. doi:10.1080/13658816.2018.1447671.
- Gavalas, Damianos, Charalampos Konstantopoulos, Konstantinos Mastakas, and Grammati Pantziou. 2014. “Mobile Recommender Systems in Tourism.” Journal of Network and Computer Applications 39: 319–333. doi:10.1016/j.jnca.2013.04.006.
- Girardin, Fabien, Filippo Dal Fiore, Carlo Ratti, and Josep Blat. 2008. “Leveraging Explicitly Disclosed Location Information to Understand Tourist Dynamics: A Case Study.” Journal of Location Based Services: 4th International Conference on LBS and TeleCartography Hong Kong 2 (1): 41–56. doi:10.1080/17489720802261138.
- Gunawan, Aldy, Hoong Chuin Lau, and Pieter Vansteenwegen. 2016. “Orienteering Problem: A Survey of Recent Variants, Solution Approaches and Applications.” European Journal of Operational Research 255 (2): 315–332. doi:10.1016/j.ejor.2016.04.059.
- Hannam, Kevin, Gareth Butler, and Cody Morris Paris. 2014. “Developments and Key Issues in Tourism Mobilities.” Annals of Tourism Research 44: 171–185. doi:10.1016/j.annals.2013.09.010.
- Hochreiter, Sepp, and Jürgen Schmidhuber. 1997. “Long Short-Term Memory.” Neural Computation 9 (8): 1735–1780. doi:10.1162/neco.1997.9.8.1735.
- Huang, Haosheng. 2016. “Context-Aware Location Recommendation Using Geotagged Photos in Social Media.” ISPRS International Journal of Geo-Information 5 (11): 195. doi:10.3390/ijgi5110195.
- Huang, Feiran, Jie Xu, and Jian Weng. 2021a. “Multi-Task Travel Route Planning With a Flexible Deep Learning Framework.” IEEE Transactions on Intelligent Transportation Systems 22 (7): 3907–3918. doi:10.1109/TITS.2020.2987645.
- Huang, Haosheng, Xiaobai Angela Yao, Jukka M. Krisp, and Bin Jiang. 2021b. “Analytics of Location-Based big Data for Smart Cities: Opportunities, Challenges, and Future Directions.” Computers, Environment and Urban Systems 90: 101712. doi:10.1016/j.compenvurbsys.2021.101712.
- Hyde, Kenneth F., and Rob Lawson. 2003. “The Nature of Independent Travel.” Journal of Travel Research 42 (1): 13–23. doi:10.1177/0047287503253944.
- Kang, Myunghwa, and Ulrike Gretzel. 2012. “Effects of Podcast Tours on Tourist Experiences in a National Park.” Tourism Management 33 (2): 440–455. doi:10.1016/j.tourman.2011.05.005.
- Kim, Myung Ja, Choong-Ki Lee, Namho Chung, and Woo Gon Kim. 2013. “Factors Affecting Online Tourism Group Buying and the Moderating Role of Loyalty.” Journal of Travel Research 53 (3): 380–394. doi:10.1177/0047287513497837.
- Kolahkaj, Maral, Ali Harounabadi, Alireza Nikravanshalmani, and Rahim Chinipardaz. 2020. “A Hybrid Context-Aware Approach for e-Tourism Package Recommendation Based on Asymmetric Similarity Measurement and Sequential Pattern Mining.” Electronic Commerce Research and Applications 42: 100978. doi:10.1016/j.elerap.2020.100978.
- Koswatte, Saman, Kevin McDougall, and Xiaoye Liu. 2018. “VGI and Crowdsourced Data Credibility Analysis Using Spam Email Detection Techniques.” International Journal of Digital Earth 11 (5): 520–532. doi:10.1080/17538947.2017.1341558.
- Kotiloglu, S., T. Lappas, K. Pelechrinis, and P. P. Repoussis. 2017. “Personalized Multi-Period Tour Recommendations.” Tourism Management 62: 76–88. doi:10.1016/j.tourman.2017.03.005.
- Kumar, Suresh, P. H, S. Behera, K. Anisha Kumari, Janmenjoy Nayak, and Bighnaraj Naik. 2020. “Advancement from Neural Networks to Deep Learning in Software Effort Estimation: Perspective of Two Decades.” Computer Science Review 38: 100288. doi:10.1016/j.cosrev.2020.100288.
- Kurashima, Takeshi, Tomoharu Iwata, Go Irie, and Ko Fujimura. 2013. “Travel Route Recommendation Using Geotagged Photos.” Knowledge and Information Systems 37 (1): 37–60. doi:10.1007/s10115-012-0580-z.
- Leask, Anna. 2010. “Progress in Visitor Attraction Research: Towards More Effective Management.” Tourism Management 31 (2): 155–166. doi:10.1016/j.tourman.2009.09.004.
- Li, Mingxiao, Song Gao, Feng Lu, and Hengcai Zhang. 2019. “Reconstruction of Human Movement Trajectories from Large-Scale low-Frequency Mobile Phone Data.” Computers, Environment and Urban Systems 77: 101346. doi:10.1016/j.compenvurbsys.2019.101346.
- Li, Fa, Zhipeng Gui, Zhaoyu Zhang, Dehua Peng, Siyu Tian, Kunxiaojia Yuan, Yunzeng Sun, Huayi Wu, Jianya Gong, and Yichen Lei. 2020. “A Hierarchical Temporal Attention-Based LSTM Encoder-Decoder Model for Individual Mobility Prediction.” Neurocomputing 403: 153–166. doi:10.1016/j.neucom.2020.03.080.
- Liao, Zhixue, and Weimin Zheng. 2018. “Using a Heuristic Algorithm to Design a Personalized day Tour Route in a Time-Dependent Stochastic Environment.” Tourism Management 68: 284–300. doi:10.1016/j.tourman.2018.03.012.
- Lim, Kwan Hui, Jeffrey Chan, Christopher Leckie, and Shanika Karunasekera. 2018. “Personalized Trip Recommendation for Tourists Based on User Interests, Points of Interest Visit Durations and Visit Recency.” Knowledge and Information Systems 54 (2): 375–406. doi:10.1007/s10115-017-1056-y.
- Liu, Chunyang, Jiping Liu, Jian Wang, Shenghua Xu, Houzeng Han, and Yang Chen. 2019. “An Attention-Based Spatiotemporal Gated Recurrent Unit Network for Point-of-Interest Recommendation.” ISPRS International Journal of Geo-Information 8 (8): 355. doi:10.3390/ijgi8080355.
- Liu, Shudong, and Lei Wang. 2018. “A Self-Adaptive Point-of-Interest Recommendation Algorithm Based on a Multi-Order Markov Model.” Future Generation Computer Systems 89: 506–514. doi:10.1016/j.future.2018.07.008.
- Majid, Abdul, Ling Chen, Gencai Chen, Hamid Turab Mirza, Ibrar Hussain, and John Woodward. 2013. “A Context-Aware Personalized Travel Recommendation System Based on Geotagged Social Media Data Mining.” International Journal of Geographical Information Science 27 (4): 662–684. doi:10.1080/13658816.2012.696649.
- May Petry, Lucas, Camila Leite Da Silva, Andrea Esuli, Chiara Renso, and Vania Bogorny. 2020. “MARC: A Robust Method for Multiple-Aspect Trajectory Classification Via Space, Time, and Semantic Embeddings.” International Journal of Geographical Information Science 34 (7): 1428–1450. doi:10.1080/13658816.2019.1707835.
- Mckercher, Bob, and Gigi Lau. 2008. “Movement Patterns of Tourists Within a Destination.” Tourism Geographies 10 (3): 355–374. doi:10.1080/14616680802236352.
- McKercher, Bob, Noam Shoval, Eerang Park, and Alon Kahani. 2014. “The [Limited] Impact of Weather on Tourist Behavior in an Urban Destination.” Journal of Travel Research 54 (4): 442–455. doi:10.1177/0047287514522880.
- Miah, Shah Jahan, Huy Quan Vu, John Gammack, and Michael McGrath. 2017. “A Big Data Analytics Method for Tourist Behaviour Analysis.” Information & Management 54 (6): 771–785. doi:10.1016/j.im.2016.11.011.
- Montavon, Grégoire, Wojciech Samek, and Klaus-Robert Müller. 2018. “Methods for Interpreting and Understanding Deep Neural Networks.” Digital Signal Processing 73: 1–15. doi:10.1016/j.dsp.2017.10.011.
- Mou, Naixia, Rongzheng Yuan, Tengfei Yang, Hengcai Zhang, Jinwen Jimmy Tang, and Teemu Makkonen. 2020a. “Exploring Spatio-Temporal Changes of City Inbound Tourism Flow: The Case of Shanghai, China.” Tourism Management 76: 103955. doi:10.1016/j.tourman.2019.103955.
- Mou, Naixia, Yunhao Zheng, Teemu Makkonen, Tengfei Yang, Jinwen Jimmy Tang, and Yan Song. 2020b. “Tourists’ Digital Footprint: The Spatial Patterns of Tourist Flows in Qingdao, China.” Tourism Management 81: 104151. doi:10.1016/j.tourman.2020.104151.
- Rodríguez, Beatriz, Julián Molina, Fátima Pérez, and Rafael Caballero. 2012. “Interactive Design of Personalised Tourism Routes.” Tourism Management 33 (4): 926–940. doi:10.1016/j.tourman.2011.09.014.
- Santos, Filipe, Ana Almeida, Constantino Martins, Ramiro Gonçalves, and José Martins. 2019. “Using POI Functionality and Accessibility Levels for Delivering Personalized Tourism Recommendations.” Computers, Environment and Urban Systems 77: 101173. doi:10.1016/j.compenvurbsys.2017.08.007.
- Sarkar, Joy Lal, and Abhishek Majumder. 2021. “A New Point-of-Interest Approach Based on Multi-Itinerary Recommendation Engine.” Expert Systems with Applications 181: 115026. doi:10.1016/j.eswa.2021.115026.
- Sarkar, Joy Lal, Abhishek Majumder, Chhabi Rani Panigrahi, and Sudipta Roy. 2020. “MULTITOUR: A Multiple Itinerary Tourists Recommendation Engine.” Electronic Commerce Research and Applications 40: 100943. doi:10.1016/j.elerap.2020.100943.
- Song, C., Z. Qu, N. Blumm, and A. L. Barabasi. 2010. “Limits of Predictability in Human Mobility.” Science 327 (5968): 1018–1021. doi:10.1126/science.1177170.
- Su, Shiliang, Chen Wan, Yixuan Hu, and Zhongliang Cai. 2016. “Characterizing Geographical Preferences of International Tourists and the Local Influential Factors in China Using Geo-Tagged Photos on Social Media.” Applied Geography 73: 26–37. doi:10.1016/j.apgeog.2016.06.001.
- Sun, Yeran, Hongchao Fan, Mohamed Bakillah, and Alexander Zipf. 2015. “Road-Based Travel Recommendation Using Geo-Tagged Images.” Computers, Environment and Urban Systems 53: 110–122. doi:10.1016/j.compenvurbsys.2013.07.006.
- Sun, Xiaoyu, Zhou Huang, and Xia Peng. 2018. “Building a Model-Based Personalised Recommendation Approach for Tourist Attractions from Geotagged Social Media Data.” International Journal of Digital Earth 12 (6): 661–678. doi:10.1080/17538947.2018.1471104.
- Sun, Shaolong, Yunjie Wei, Kwok-Leung Tsui, and Shouyang Wang. 2019. “Forecasting Tourist Arrivals with Machine Learning and Internet Search Index.” Tourism Management 70: 1–10. doi:10.1016/j.tourman.2018.07.010.
- Sutskever, Ilya, Oriol Vinyals, and Quoc V. Le. 2014. “Sequence to Sequence Learning with Neural Networks.” Proceedings of the 27th International Conference on Neural Information Processing Systems, 3104–3112.
- Uriely, Natan. 2005. “The Tourist Experience: Conceptual Developments.” Annals of Tourism Research 32 (1): 199–216. doi:10.1016/j.annals.2004.07.008.
- Vaswani, Ashish, Noam Shazeer, Niki Parmar, Jakob Uszkoreit, Llion Jones, Aidan N. Gomez, Lukasz Kaiser, and Illia Polosukhin. 2017. “Attention is All You Need.” Advances in Neural Information Processing Systems 30: 5998–6008.
- Verbeeck, C., P. Vansteenwegen, and E. H. Aghezzaf. 2016. “Solving the Stochastic Time-Dependent Orienteering Problem with Time Windows.” European Journal of Operational Research 255 (3): 699–718. doi:10.1016/j.ejor.2016.05.031.
- Wan, Lin, Yuming Hong, Zhou Huang, Xia Peng, and Ran Li. 2018. “A Hybrid Ensemble Learning Method for Tourist Route Recommendations Based on Geo-Tagged Social Networks.” International Journal of Geographical Information Science 32 (11): 2225–2246. doi:10.1080/13658816.2018.1458988.
- Wang, Honglian, Peiyan Li, Yang Liu, and Junming Shao. 2021. “Towards Real-Time Demand-Aware Sequential POI Recommendation.” Information Sciences 547: 482–497. doi:10.1016/j.ins.2020.08.088.
- Wong, Cora Un In, and Bob McKercher. 2012. “Day Tour Itineraries: Searching for the Balance Between Commercial Needs and Experiential Desires.” Tourism Management 33 (6): 1360–1372. doi:10.1016/j.tourman.2011.12.019.
- Wu, Lun, Liu Yang, Zhou Huang, Yaoli Wang, Yanwei Chai, Xia Peng, and Yu Liu. 2019. “Inferring Demographics from Human Trajectories and Geographical Context.” Computers, Environment and Urban Systems 77: 101368. doi:10.1016/j.compenvurbsys.2019.101368.
- Xia, Jianhong Cecilia, Panlop Zeephongsekul, and David Packer. 2011. “Spatial and Temporal Modelling of Tourist Movements Using Semi-Markov Processes.” Tourism Management 32 (4): 844–851. doi:10.1016/j.tourman.2010.07.009.
- Xiang, Zheng, and Ulrike Gretzel. 2010. “Role of Social Media in Online Travel Information Search.” Tourism Management 31 (2): 179–188. doi:10.1016/j.tourman.2009.02.016.
- Xu, Zhenxing, Ling Chen, and Gencai Chen. 2015. “Topic Based Context-Aware Travel Recommendation Method Exploiting Geotagged Photos.” Neurocomputing 155: 99–107. doi:10.1016/j.neucom.2014.12.043.
- Xu, Yang, Jiaying Xue, Sangwon Park, and Yang Yue. 2021. “Towards a Multidimensional View of Tourist Mobility Patterns in Cities: A Mobile Phone Data Perspective.” Computers, Environment and Urban Systems 86: 101593. doi:10.1016/j.compenvurbsys.2020.101593.
- Xu, Yang, Dan Zou, Sangwon Park, Qiuping Li, Suhong Zhou, and Xinyu Li. 2022. “Understanding the Movement Predictability of International Travelers Using a Nationwide Mobile Phone Dataset Collected in South Korea.” Computers, Environment and Urban Systems 92: 101753. doi:10.1016/j.compenvurbsys.2021.101753.
- Yan, Yingwei, Chen-Chieh Feng, Wei Huang, Hongchao Fan, Yi-Chen Wang, and Alexander Zipf. 2020. “Volunteered Geographic Information Research in the First Decade: A Narrative Review of Selected Journal Articles in GIScience.” International Journal of Geographical Information Science 34 (9): 1765–1791. doi:10.1080/13658816.2020.1730848.
- Yang, Yang, Timothy Fik, and Jie Zhang. 2013. “Modeling Sequential Tourist Flows: Where is the Next Destination?” Annals of Tourism Research 43: 297–320. doi:10.1016/j.annals.2013.07.005.
- Yeh, Duen-Yian, and Ching-Hsue Cheng. 2015. “Recommendation System for Popular Tourist Attractions in Taiwan Using Delphi Panel and Repertory Grid Techniques.” Tourism Management 46: 164–176. doi:10.1016/j.tourman.2014.07.002.
- Yi, Bao, Huang Zhou, Li Linna, Wang Yaoli, and Liu Yu. 2020. “A BiLSTM-CNN Model for Predicting Users’ Next Locations Based on Geotagged Social Media.” International Journal of Geographical Information Science 35 (4): 639–660. doi:10.1080/13658816.2020.1808896.
- Yuan, May. 2018. “Human Dynamics in Space and Time: A Brief History and a View Forward.” Transactions in GIS 22 (4): 900–912. doi:10.1111/tgis.12473.
- Zheng, Weimin, Xiaoting Huang, and Yuan Li. 2017. “Understanding the Tourist Mobility Using GPS: Where is the Next Place?” Tourism Management 59: 267–280. doi:10.1016/j.tourman.2016.08.009.
- Zheng, Weimin, and Zhixue Liao. 2019. “Using a Heuristic Approach to Design Personalized Tour Routes for Heterogeneous Tourist Groups.” Tourism Management 72: 313–325. doi:10.1016/j.tourman.2018.12.013.
- Zheng, Weimin, Zhixue Liao, and Jing Qin. 2017. “Using a Four-Step Heuristic Algorithm to Design Personalized day Tour Route Within a Tourist Attraction.” Tourism Management 62: 335–349. doi:10.1016/j.tourman.2017.05.006.