
 ?Mathematical formulae have been encoded as MathML and are displayed in this HTML version using MathJax in order to improve their display. Uncheck the box to turn MathJax off. This feature requires Javascript. Click on a formula to zoom.
ABSTRACT
The article presents a methodology to determine access routes to places with difficult access, situated outside the regular transport network. To determine the optimum route, the existing road network was used, along with terrain passability maps, as well as high-resolution digital terrain models together with the traction parameters of the vehicle to enable conducting a detailed analysis of micro-relief and excluding inaccessible areas. The research was extended to include a comprehensive analysis of terrain accessibility for areas located in the vicinity of the capital cities of three European countries on various levels of economic development: Germany, Poland, and Ukraine. The degree of development of the analysed area was determined with the use of the gross domestic product (GDP), human development index (HDI), and the road quality coefficient. The case study presented in the paper illustrates the practical application of the developed methodology that was implemented to a real crisis situation. Access routes were determined for a MAN TGM 15.290 vehicle that went to take part in emergency action in buildings situated approximately 500 m away from paved roads. The developed methodology may be widely used in crisis management, where the emergency actions often require rescue units to access remote places.
1. Introduction
Pursuant to the binding legislation in countries analysed in this article, Poland (Law of 26 April 2007 on crisis management, 2007), Germany (System of crisis management in Germany, Citation2015) and Ukraine (Regulation on the unified state system of civil protection, Citation2014), crisis management is understood as the activities of public administration organs consisting in: preventing crisis situations, preparing to take control over such situations, reacting and recreating the infrastructure and restoring it to the original condition. Apart from pointing out the main functions of crisis management, this definition also emphasises its spatial nature, as the crisis situation in itself takes place in specific, existing locations that are referred to space. This fact determines the need to be able to access up-to-date, detailed spatial information, which is essential for the whole crisis management process. Such information is necessary, among others, while determining the access route to the place where the danger exists. In crisis management, this process is even more difficult, as such circumstances do not necessarily occur (and usually do not occur) in the vicinity of transportation routes. As a result, it is sometimes necessary to deploy the resources and staff to remote areas, far from roads, which may make the emergency action more difficult. The practice of the crisis management assumes that in the first instance the paved roads are used and then, as possible, an analysis based on the relief should be conducted. The route to the danger site must be the fastest so if this site is situated outside the road network, the rescue units must arrive as close as possible with use of paved roads and then assess whether to travel through the unpaved terrain and if yes that in what way? The authors of this article focus precisely on these issues and present the results of research that enables to solve the problem of planning routes in areas without roads.
1.1. Related works
The influence of terrain-related aspects on risk assessment and conducting crisis management activities have been analysed by authors of numerous publications. One of them was (Ahola et al. Citation2007), who presented the possibilities to develop and implement a simple spatio-temporal model of population distribution, which may improve risk assessment and damage analysis in the process of making decisions by rescue services. Dynamic modelling of the consequences of failure of critical road infrastructure was the topic of the study by (Rehak et al. Citation2019), while (Hošková-Mayerová Citation2015) proposed a model of assessing the usability and quality of spatial data for the purposes of creating a map of costs. The author of the latter article noted that comprehensive knowledge about the quality of data is necessary to assess the reliability and accuracy of decisions made in crisis management. The issues related to the application of GIS and spatial data in crisis management were addressed in (Cai Citation2005), which presents an architecture of a smart, multiple-user geographic information environment. Similar systems used for the management of forest fires and earthquakes were described in publications by (Raeesi and Sadeghi-Niaraki Citation2013; and Vakalis et al. Citation2004), while an evaluation of the influence of GIS on the mitigation of the risk of occurrence of crisis situation was presented in (FathiZahraei et al. Citation2015). The transfer of people, goods, and vehicles is inextricably linked to the problems of crisis management. This resulted in a large number of publications that present the methodologies of determining evacuation routes both inside buildings (Cepolina Citation2005; Pursals and Garzón Citation2009) and outside. In this respect, the determined routes take into account variable factors that emerge as a result of a crisis situation and the works concern evacuation procedures after: an earthquake (Mihara et al. Citation2019) or a tsunami (Kitamura et al. Citation2020; Péroche, Leone, and Gutton Citation2014). Numerous methodologies of route determination concern the evacuation in developed areas, for example in the light of the availability of shelters (Alçada-Almeida et al. Citation2009), increasing tourist traffic (Wachtel et al. Citation2021) or the reliability of the road network (Lim, Rungta, and Baharnemati Citation2015). Moreover, the publication by (Rifai and Zhenjiang Citation2019) shows various methods of computing the evacuation distance in tsunami-prone area and provides interesting results. The presented studies also address the issues of spatial accessibility on the example of analysing the possibilities of accessing a place where a crisis situation has occurred by the fire brigades. Here, one should mention the studies on the availability of hydrants (Raškauskaitė and Grigonis Citation2019), the analyses of spatial accessibility of urban areas taking into account the time of access to the location of the fire (Chen et al. Citation2021) or the analyses of the influence areas of fire stations in various metropoles of the world, e.g. Melbourne (Shahparvari, Fadaki, and Chhetri Citation2020) or Dallas (Min, Kim, and Lee Citation2019). Another topic that is often analysed is the accessibility of public transport (Tennøy, Knapskog, and Wolday Citation2022; Tiznado-Aitken, Muñoz, and Hurtubia Citation2021). The problems discussed in this article refer to the accessibility of areas situated away from the transport network. In the context of crisis management, these issues are presented in the publication (Rybanský and Vala Citation2009), whose authors analysed the influence of terrain relief on the possibilities of vehicle movement in open areas. Numerous related works focus on the analysis of movement possibilities of military vehicles. Here, it is worth mentioning the previous publications of the authors of the present study that described various aspects of creating passability maps, such as: the influence of input data on the resulting passability maps (Pokonieczny Citation2018a), the analysis of their accuracy (Pokonieczny and Mościcka Citation2018) or various methods of generating such maps, e.g. with use of various types of artificial neural networks (Pokonieczny Citation2017a, Citation2018b). Modelling the passability of military vehicles is also the area of focus of other authors. Here, one should reference the works by: (Rybansky Citation2020), whose author analysed the possibility to pass areas covered by vegetation, (Rada, Rybansky, and Dohnal Citation2021) that deals with the issue of the influence of altitude data accuracy on off-road navigation, or (Rada, Rybansky, and Dohnal Citation2020) who focused on the application of image data to develop passability maps. Considering the works referenced above, none of the authors discussed an issue concerning the determination of access routes to areas located far from paved roads. So this is the gap in knowledge which the authors aim to bridge in this article.
1.2. Research purpose
The main aim of the authors was to present a comprehensive and innovative methodology of determining access routes to areas situated outside the road network. In order to demonstrate the usefulness of the developed methodology, programming works were conducted that resulted in developing a system that determines access routes both on roads and in off-road areas in a completely automated way. The automation allowed us to conduct extensive analyses with the aim to verify the accessibility of selected test areas. As a result, the following research question was formulated: How does the development of the road network and land cover influence the possibility to access a place where a crisis situation has occurred? As the test areas were selected for countries at various stages of development, another, no less important issue discussed in the article is the determination of the extent in which the economic development, measured by gross domestic product (GDP), human development index (HDI) and the road quality coefficient, guarantees quick access to areas situated outside the road networks, whether it influences the possibility to access them, and if yes than in what way.
2. Materials and methods
They key factor in crisis situations is the time of accessing the destination. Problems arise in situations when the destination is located in an area outside the road network, as the rescue vehicle has to pass across such area. In the present study, the process of generating access routes has been divided into two stages. First of all, the route is determined based on the existing road network, on paved roads. The second stage consists in determining the route from the closest point located on a paved road directly to the destination. At this stage, the route is generated based on land passability maps developed with the use of an automated military map generation system, which was described in detail in (Pokonieczny Citation2017b). A detailed description of the methodology of the determination of routes is presented below.
2.1. Data used
The research was conducted on data obtained from OpenStreetMap (OSM), which is a global geographic database created by the community of Internet users. Each registered user may edit its content or download the data for any area of the world. The project was commenced in 2004 and, over the years, it has become the best known example of Volunteered Geographic Information (VGI) on the Web. OSM is distributed under the Open Data Commons Open Database License and it is sponsored by the non-profit organisation OpenStreetMap Foundation. The data contained in this database focus mainly on transport infrastructure (roads, pathways, railroad networks), but they also contain a wide range of other objects that are important from the point of view of terrain passability, such as buildings, forests, and lakes, etc. A detailed description of the OSM data is presented in the publication (Jokar Arsanjani et al. Citation2015).
The second source of data was LIDAR (Light Detection and Ranging) data which were obtained from the Polish Head Office of Geodesy and Cartography from National Geodesy and Cartography Resource. They are elevation data which are available on the whole Poland’s territory and can be acquired from the governmental website free of charge (www.geoportal.gov.pl). Downloaded data are distributed as text files which contain coordinates (X, Y, Z) of points disposed evenly as a net with spacing 1 m. According to the producer, the vertical accuracy of the data is 0.15 m. This elevation model was used in this research to perform the microrelief analysis, and consequently, to identify impassable areas.
2.2. Area of research
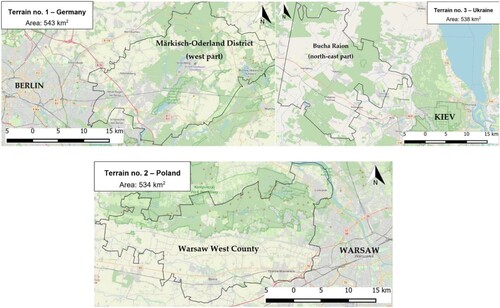
This study presents the research on the influence of the development of the transport network on the possibility to access certain locations. For this purpose, the authors selected test areas situated in the territories of 3 European countries of various degrees of development: Germany, Poland, and Ukraine. In order to ensure homogeneous measurement conditions, areas of the surface of approx. 540 km2 were selected, located in the vicinity of the capital cities of these countries: Berlin (52°31′ N, 13°24′ E) – the western part of the Märkisch-Oderland district (denoted later as DE), Warsaw (52°14′ N, 21°00′ E) – the Warsaw-West County (denoted later as PL), and Kiev (50°27′ N, 30°30′ E) – the south-eastern part of the Bucha Raion (denoted later as UA). The location of these areas is presented in , and their characteristics and comparison are provided in Section 4.
Figure 1. Localisation of tested areas.
2.3. Description of the methodology of the route determination process
Numerous emergency operations require rescue vehicles to access areas that are located outside the transportation network. The methodology presented here enables to determine the optimum routes to such locations, taking into account, firstly, the existing road network (to arrive as close as possible to the destination using paved roads), and then the route is determined in an off-road area based on terrain passability maps. In order to provide a better visualisation of the whole route determination process, a block diagram was created that is presented in .
Figure 2. Block diagram of the route determination process.
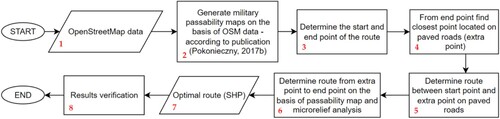
The detailed description of the individual stages of the route determination process is presented in the sub-sections below.
Block No. 1
In order to generate a terrain passability map, it is necessary to analyse and assess the influence of various elements of land cover and terrain formation on the traction possibilities of vehicles. The reference data used for the purposes of this study were obtained from OpenStreetMap. They may be downloaded free of charge from the official website of the project (‘OpenStreetMap’, Citationn.d.). Data are available for the area of the whole world, so it is possible to create a terrain passability map for most of the globe. Despite the fact that in some countries OSM data are not detailed enough (e.g. lacking entries of land cover classes or foreign alphabets) making them hard to use, in the analysed areas in Poland, Germany and Ukraine OSM data are fully available.
(2) Block No. 2
Passability maps were generated in the automated military map generation system (Pokonieczny Citation2017b). The creation of such maps is based on dividing the terrain into primary fields of identical shape and size. For the purposes of this project, square fields were used. Passability is determined by assigning each field the value of the index of passability (IOP). It is determined based on elements of land cover and relief that are located inside the analysed primary field. The IOP may take values from 0 to 1, where 1 means perfect passability conditions, while 0 means that the area is completely impassable. The index is calculated based on weights assigned to specific terrain objects and the number of such objects in the given primary field. The more objects that make it difficult to cross the terrain (e.g. rivers, forests, lakes) there are in the field, the lower value the IOP will take. The reverse phenomenon happens in primary fields that contain objects which make it easier to move, such as roads, bridges, or in those that do not contain obstacles to movement. Then, the index of passability will be close to 1. The full description of the military passability maps generation process and calculation of the IOP is in publication (Pokonieczny Citation2017b).
The analyses presented here were conducted for various sizes of primary fields, and thus with use of passability maps of various levels of detail. In order to analyse the influence of the development of the transport network on the possibility to access a location within the selected administrative unit in countries of various degrees of development, a passability map was generated with primary fields of the dimensions 100 m x 100 m (Section 3). Additionally, the article contains a case study consisting in the determination of an access route to a potential rescue operation site for a fire truck. This study is based on much more detailed passability maps of the resolution of 3 m (Section 3.1).
(3) Block No. 3
The next step consists in determining the start and end points for the determined route. The starting point is defined as the location where the given rescue unit begins the rescue operation. It may be assumed that in any case the starting point will be located on a paved road, as all the stations of rescue services where such rescue operations begin are situated near such roads. The destination or end point will be the point where the crisis situation has occurred. Such spot might be located both near paved roads, in places that may easily be accessed by rescue units, and in locations situated far from such roads. In such event, in order for the vehicle to reach the destination safely, it is necessary to determine the optimum route based on a terrain passability map taking into account elements of microrelief. This step is presented in (a).
(4) Block No. 4
Figure 3. Route determination process.
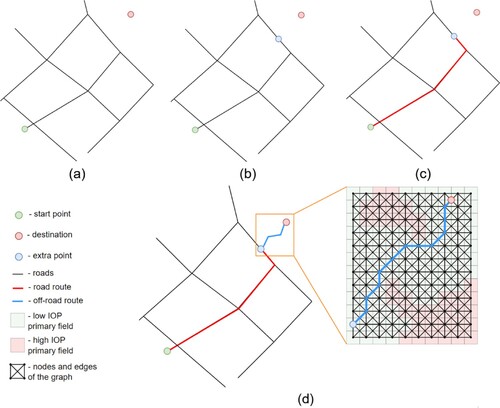
If the destination is situated far from the road network, it is necessary to find a point on a paved road that will be as close as possible to the destination point. Data used for this analysis (roads) were selected from the OSM database, based on the attribute query that selected from all roads only those with paved surface. The extra point is located on the road network and is as close as possible to the destination point ((b)).
(5) Block No. 5
Having defined all the points that are necessary to determine the access route, the algorithm determines the optimum (i.e. the fastest) route between the start point and the extra point on a paved road. This is achieved with the use of the well-known and commonly used Dijkstra algorithm. It realizes the so-called greedy approach, which means that in each iteration it selects one of the nodes not visited yet that may be accessed at the lowest cost. The algorithm selects locally optimum solutions, which means that it does not analyse whether it is reasonable to perform a given action in the subsequent steps of the process. The Dijkstra algorithm is described in detail in (Javaid Citation2013). There are also other pathfinding algorithms, e.g. A-star, but the publication (Dawid and Pokonieczny Citation2021) showed that the Dijkstra algorithm is more stable and faster than A-star and that is why this algorithm has been chosen for the analysis. The visualisation of this stage of the methodology is presented in (c).
(6) Block No. 6
The subsequent step consists in determining the route between the extra point and the destination point. This will be a cross-country route and it will be generated with use of the route determination module implemented in the automated military map generation system, which was described in detail in the publication (Dawid and Pokonieczny Citation2021). Routes determined with this module are based on high-resolution terrain passability maps containing additional exclusions resulting from the analysis of micro-relief (embankments, drainage ditches, holes, etc.). In this case, maps are generated based on OSM data and detailed LIDAR data. Then the passability maps constitute a basis for generating a graph that consists of edges and nodes, where each node is the centroid of a primary field of the map, which is assigned the value of the index of passability. Then, based on this index, the cost of transport is calculated, which is then assigned to the edges of the graph. The Dijkstra algorithm selects those edges that will allow the unit to reach the destination at a minimum cost. As a result, the determined route avoids any obstacles, which guarantees that the rescue unit will not encounter any barriers on its way to the site of the potential rescue operation ((d)). This methodology of determining cross-country routes was described in detail in the study (Dawid and Pokonieczny Citation2020).
(7) Block No. 7
Finally, an optimal route is obtained which then is exported to the distributable Shapefile format. This route will be verified in the following step.
(8) Block No. 8
The aim of this step was to verify the DEM used in the analysis and to check whether the generated routes are passable. The field measurements were taken using GNSS (Global Navigation Satellite Systems) technology with use of Leica VIVA GS15 receiver. The used RTK (Real Time Kinematic) method allowed to measure with the accuracy of 3 cm vertically and horizontally. To calculate the accuracy of the DEM, on each analysed terrain there were measured 100 control points and then they were compared with the heights from this model. The height accuracy was measured by the RMSE (Root Mean Square Error). It was calculated using the Equationequation (1)(1)
(1) :
(1)
(1) where Hmeas is a measured height, HDEM is a height from the DEM and
is the amount of measured control points. On the other hand, to assess the passability of generated routes, photographic documentation was collected during a field inspection and profiles of crucial microrelief objects were measured is the amount of measured control points. On the other hand, to assess the passability of generated routes, photographic documentation was collected during a field inspection and profiles of crucial microrelief objects were measured.
The results and application of this method will be discussed in more detail in Section 3.1, which contains a case study consisting in the determination of cross-country routes for the fire brigade vehicles.
2.4. The terrain accessibility maps development
The aim of the article was also to present the influence of the development of the transport network on the possibility to access sites of potential rescue operations situated in the selected test areas. Here, a slightly different algorithm was used to generate the accessibility maps. It is described below.
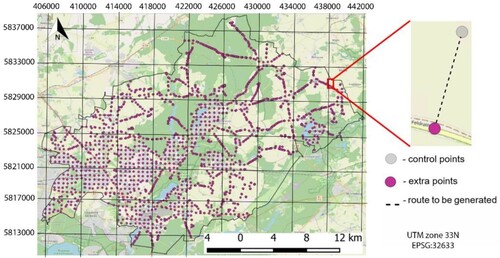
Generating a grid of points
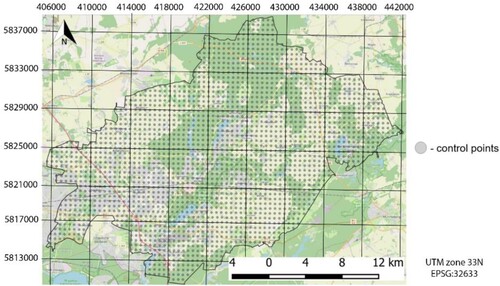
In order to conduct the analysis, it was necessary to generate a grid of evenly distributed test points that would simulate the sites of potential rescue operations (such as a fire or an accident). In the subsequent step, a route will be determined to each of these points from the closest possible point located on a paved road. The generated points were situated at 500 m intervals. The visualisation of points generated for DE is presented in .
(2) Determination of the closest points located on paved roads
Figure 4. Grid of control points generated for the DE area.
The subsequent stage consisted in determining the closest point on a paved road for each control point. This operation resulted in finding points on paved roads that will become the starting points for determining the routes to control points. It is presented in .
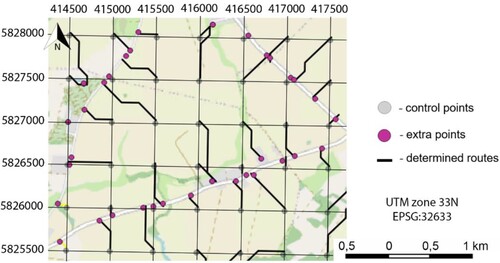
(3) Determination of routes between points
Figure 5. Grid of extra points.
The subsequent step consists in determining the route between the extra points on paved roads and the destination points. In order to do so, terrain passability maps in resolution 50 m will be used. They were developed in accordance with the previously described methodology (block No. 2, ). Routes are determined based on the costs of transfer, which was presented in the description of (block No. 6, ). Examples of the determined routes are presented in , which shows that such routes may be straight lines or polylines (when they avoid terrain obstacles).
(4) Assigning travel cost values to control points
Figure 6. The determined routes from the points on paved roads to control points.
Routes are generated based on the determination of the lowest cost of travel. At this stage, it is first added along the whole route and then normalised to the range from 0 to 1. The final value is then assigned to the grid of control points, which allowed us to create the terrain accessibility maps.
3. Results
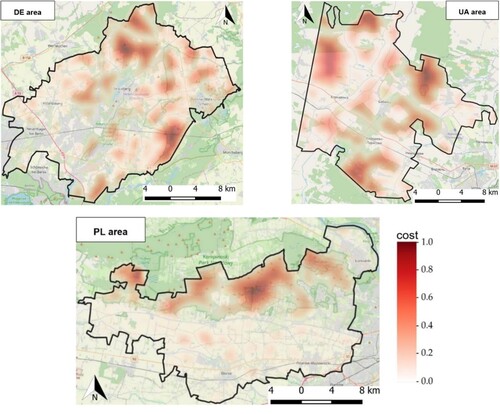
The outcomes of the conducted research are accessibility maps for three analysed areas. They present the costs of access of vehicles in the whole analysed area. The calculated values of these costs at control points have been visualised in form of a heatmap. The accessibility maps for the analysed territories are presented in . The further part of the results will be presented based on the conducted case study, which is described in Sub-section 3.1.
Figure 7. Terrain accessibility maps on analysed areas.
3.1 Case study
The present sub-section describes a case study that consists in applying the presented methodology to determine an optimum access route to the destination point for a fire truck. The study was conducted in the Warsaw-West County (PL), for two selected field objects and a specific type of fire truck. This area was selected because there the authors had a possibility to carry out terrain verification of the obtained results.
3.1.1. Description of the crisis situation
The case study refers to two single-family homes located in various parts of the PL area and, at the same time, being the potential sites of rescue operations. The two objects selected for analysis are situated at a distance from the network of paved roads, which, in a crisis situation, makes them more difficult for rescue services to access and forces these services to move cross-country. The case study is based on the assumption that a fire started in these two buildings and that an intervention of the fire brigades is needed to extinguish it. In Poland, the National Fire Brigade units operate mainly based on County or Municipal Fire Stations. Each country has at least one rescue unit, with firefighters on duty on a 24/7 basis, throughout the year. The local County Fire Station in the Warsaw-West County is located in the town Błonie (52° 12’ 21.0” N, 20° 36’ 48.9” E) located west of Warsaw. For the purposes of the case study it was assumed that in the event of a fire, a fire truck has to access the site within the shortest possible time. Due to the fact that the buildings are situated approx. 500 m away from paved roads, it is necessary to pass this distance off-road. Thus, it becomes necessary to apply the methodology described here, firstly to determine the shortest route on paved roads from the County Fire Station to the place on the road that is as close as possible to the destination, and then to determine the optimum cross-country route from this point to the building that is on fire.
3.1.2 Description of the analysed fire truck
The County Fire Station in Błonie is equipped with several fire trucks of various designations, including such models as: MAN TGM 15.290 BL, MAN TGM 18.340 BB, and IVECO EUROCARGO. For the purposes of the analysis, a medium-size rescue and firefighting vehicle MAN TGM 15.290 BL was selected. It has a six-passenger cabin that meets all requirements set for town vehicles and it is suitable for driving on paved roads. The technical parameters of the vehicle that are the most important from the point of view of passability are presented in .
Table 1. Parameters of the analysed vehicle (‘PP – MAN TGM Citation15.Citation290 BL’, n.d.).
The vehicle is not suitable for cross-country driving, which is best manifested in the low value of ground clearance (0.16 m). As the rescue operation will be conducted approximately 500 m away from the nearest paved road, it is necessary to access the destination safely, avoiding all elements of micro-relief that might hinder or prevent the movement. The track width refers to the distance between the centres of wheels on the same axis and its value for the analysed vehicle is 2.53 m. Knowing this, the authors assumed that the routes should be generated based on terrain passability maps of the resolution of 3 m x 3 m.
3.1.3 Route determination
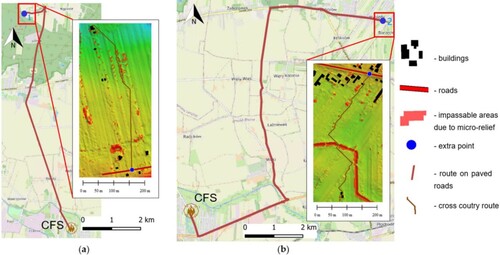
According to the described methodology, the determination of the final access routes was divided into several stages, which will be discussed in detail below. At the first stage, the point on a paved road was determined that was the closest to the destination, being the buildings ‘on fire’. As a result, an extra point was generated that became the basis for generating individual sections of the route (part on paved roads and the cross-country part). The positions of all critical points are presented in .
Figure 8. Map of critical points in the analysed area.
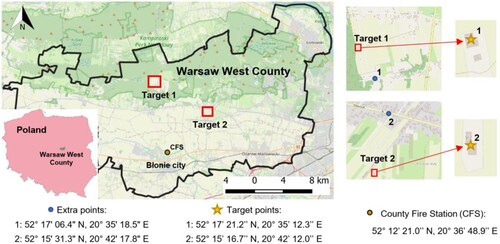
The target points are located approx. 500 m away from paved roads. The main problem of the fire brigades is the lack of knowledge of the terrain that their vehicles will have to cross. The terrain relief in the analysed areas is visualised in .
Figure 9. Map of terrain relief between the extra points and the destination points.
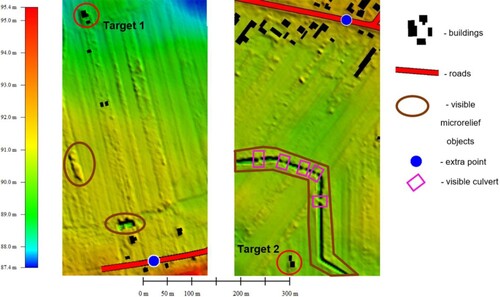
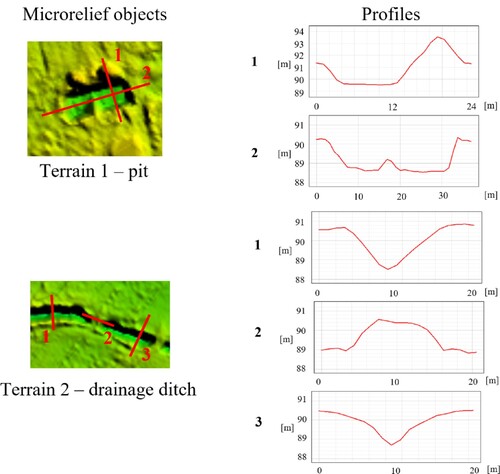
The above visualisations of the Digital Terrain Model show several elements of micro-relief that may be identified as impassable objects as a result of the conducted analysis. Although the area where site 1 is located (denoted later as terrain 1) is free from such objects that might hinder the movement of a rescue vehicle from the extra point to the destination, the visualisation of the area where site 2 is situated (denoted later as terrain 2) reveals an oblong object between the road and the target. This is a drainage ditch with steep banks, with several culverts. What is important, the algorithm for route determination will also check (with use of the Digital Terrain Model) whether the existing culverts are wide enough for the analysed fire truck to reach its destination safely.
The next step consisted in determining the route on paved roads from the County Fire Station to the extra points. They were determined with the use of the Dijkstra algorithm, which selected the shortest route. Although the shortest route is not always the fastest, in this case the cost of transport was only the length of individual sections of the road. A fire truck that travels on a rescue mission is a privileged vehicle, so it does not have to pay attention to the limitations on the road, such as speed limits or traffic lights. Pursuant to Polish legal regulations, a driver of a privileged vehicle does not have to comply with the road traffic regulations, provided that they maintain all due care, so determining the cost of transport based on, e.g. the speed limits on the given road would be unreasonable in this case.
The subsequent step consisted in determining the cross-country routes from the extra points to the destination sites of the rescue operations. At this stage, the algorithm determined the routes based on terrain passability maps generated with the resolution 3 m x 3 m. Firstly, the impassable areas and areas that contained buildings were excluded based on the analysis of the micro-relief. The route was determined based on the minimisation of the travel cost, which was the index of passability determined based on OSM data, as it was described in Section 2.3. Generated routes are illustrated in .
Figure 10. Determined routes: (a) terrain 1, (b) terrain 2.
The above illustration shows that the determined routes avoid all areas that were identified as impassable based on the analysis of microrelief. The route for terrain 2 also demonstrates that the analysis of micro-relief revealed the presence of a drainage ditch situated in the area and the existing culverts. Another advantage of this tool is the fact that the user may enter the technical specifications of the analysed vehicle, which proved to be of key importance, as it allowed us to identify the culvert that would allow the vehicle to reach the destination.
As far as the results verification is concerned, firstly, the accuracy of DEM was checked. shows the distribution of control points.
Figure 11. The distribution of measured control points on analysed areas.
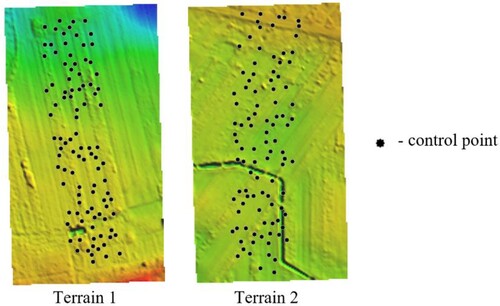
As a result an accuracy of 0.15 m was obtained for both models what perfectly corresponds to the information provided by the data distributor. Below () there are photographs which show crucial microrelief objects on the analysed terrains and parts of generated routes.
Figure 12. Photographs of marked parts of the analysed terrains and generated routes.
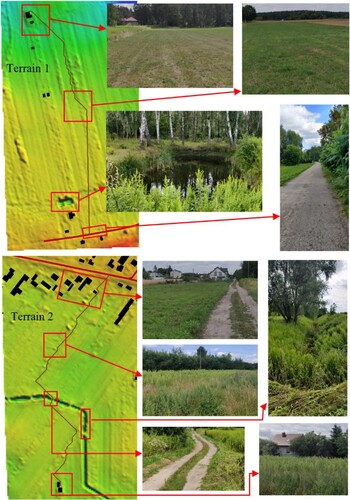
The figure above shows that both targets (on terrain 1 and 2) are accessible via generated routes. On the terrain 1 there are no major obstacles but one pit and on the terrain 2 is an oblong drainage ditch with several culverts. These obstacles were indicated as impassable by the microrelief analysis (). Conducted field measurements also consisted of measuring profiles of those objects. Results are shown in .
Figure 13. Measured profiles of analysed microrelief objects.
4. Discussion
The factor that doubtlessly has a significant influence on terrain accessibility is the level of development of the country, where the given area is situated. It affects the quality and density of the transportation network, and thus directly determines the possibility for road vehicles to move in the area. The development in this research is measured with use of three factors: Gross Domestic Product (GDP), Human Development Index (HDI) and road quality coefficient. This section contains a brief introduction to the economic situation of the analysed areas and the countries where they are located, the comparison of these areas in terms of land cover (what allows to correlate the mean travel cost to land cover classes), along with an analysis of the obtained results. It will allow to determine the degree of influence of the country development level on terrain accessibility in selected areas.
4.1. A general comparison of the countries and regions where the analysed areas are located
Due to the fact that there is no commonly used criterion for the determination of the development level of countries, the main indicators are the GDP per capita and the HDI. The first one indicates the value of the goods manufactured and services provided by national and foreign entities in a given time unit (usually a year) in the territory of the given country per one inhabitant. The GDP values were obtained from the website of the World Bank Data (‘World Bank Open Data | Data’, Citationn.d.). On the other hand, the HDI refers to the degree of the socio-economic development of the analysed country. It may take the values from 0 to 1, where 1 means the maximum level of development. The method of calculating the HDI index is described in detail in the publication (Majerova Citation2012). The HDI values were obtained from the Human Development Report for the year 2019 (UNDP Citation2020). Another index that reflects the differences between the analysed countries is the road quality indicator, which is one of the elements of the Global Competitiveness Report (GCR), published annually by the World Economic Forum. This indicator reflects the quality of roads in the given country and it is calculated based on the opinions of over 14,000 business leaders from 144 countries. The index may take the values from 1 to 7, where the value of 1 means a very poorly developed road network, and the value of 7 – a very extensive, well-developed network. The indices for specific countries were obtained from the website (‘Roads quality by country, around the world’, Citationn.d.), which provides a broad repository of research, data, and economic indices obtained from official sources, including the World Bank or the World Economic Forum.
Additionally, the values of the GDP per capita and HDI were obtained for the smaller regions where the analysed areas are located, which will enable a more local approach to their characteristics. The regional data concerning GDP per capita for Germany and Poland may be obtained from the website of the Statistical Office of the European Union (‘Eurostat’, Citationn.d.), and for Ukraine from the State Statistics Service of Ukraine (‘Ukrstat.org – State Statistics Service of Ukraine’, Citationn.d.). In Germany, the subject of the analysis was the Brandenburg region, while in Poland it was the Masovian Voivodeship (excluding Warsaw), and in Ukraine the Kiev Oblast. As far as local HDI indices are concerned, they may be obtained from the website of the Global Data Lab, which develops databases and tools for monitoring and analysing the condition of societies (‘Subnational HDI Maps – Global Data Lab’, Citationn.d.). While the data regions for Germany and Poland are similar (Brandenburg and the Masovian Voivodeship), Ukraine is divided into 5 larger regions (North, East, South, West and Central), and the analysed area belongs to the North region. The values of the analysed indices for the specific countries and regions are presented in .
Table 2. Indices of development of specific countries and regions.
The values clearly demonstrate the advantage of Germany over the other two countries in each measured aspect. Germany, as a leading exporter of vehicles, machinery, chemical products, and household appliances, have one of the strongest economies in the world (‘Foreign trade’, Citationn.d.). In comparison the Poland and Ukraine, they also have a much better developed road network. Its position in the centre of the European continent makes Germany a major global transport hub. These indices, along with other factors, such as the length and quality of life or the length of education in all types of schools and universities, contribute to the high value of the HDI index, which reaches 0.947 – one of the best results throughout the world. As for Brandenburg, its GDP value is lower than the average for the whole country, yet it is still higher than in the other analysed regions. The HDI is on a similar level.
As for Poland, it has been classified by the World Bank as a ‘high income country’ (‘WDI – The World by Income and Region’, Citationn.d.). The value of GDP per capita in Poland is slightly higher than the global average, which fluctuates around 11,000 USD (2020). The GDP is generated mainly by the services sector (approx. 62%), which is proven by the report of the Association of Business Service Leaders (ABSL) in Poland (Górecki Citationn.d.). The GDP value translates into the average road quality indicator. In terms of the Human Development Index, Poland is classified as a very well developed country (UNDP Citation2020). The value of GDP for the Masovian Voivodeship is similar to the national average. It should be noted that it does not take into account the GDP of Warsaw which is slightly below 35,000 USD (‘Eurostat’, Citationn.d.), as it would significantly increase this value. On the other hand, the local HDI index in this region is very high, even higher than that of Brandenburg, but this index includes the values for the capital city of Warsaw.
Ukraine has the poorest results among the three countries in all the analysed aspects. The value of GDP per capita is one of the lowest in Europe, which is caused mainly by the international conflicts that take place in the region, as well as the COVID-19 pandemic (‘NBU Comment on Change in Real GDP in Citation2020’, n.d.). In recent years, the Ukrainian market of renewable energy was one of the most dynamically developing markets in Europe, but in the era of recession the government was forced to cut down the subsidies and guaranteed tariffs offered to suppliers of renewable energy sources, which resulted in further deterioration of the situation in this sector of the industry. As far as roads are concerned, the road quality indicator is slightly lower than in Poland and amounts to 3.0. However, the forecasts of the ITA (International Trade Administration) foresee an increase in this indicator as a result of the conducted project of reconstruction and development of the transport network, under the name „Great Construction’ (International Trade Administration Citationn.d.). The HDI index of Ukraine qualifies it as a highly developed country (UNDP Citation2020). As far as the local indices are concerned, they are very similar to national ones.
4.2. Comparison of the analysed areas
As it has already been mentioned, the areas selected for analysis are located in the vicinity of the capital cities of the analysed countries. They perform similar functions in all 3 countries (as areas that are economically and socially connected to the capital cities), have similar surface areas and land cover structure. Each analysed area is a standard representative of the suburban counties in the given country. The characteristics of the analysed areas are presented in the table below ().
Table 3. Characteristics of the analysed areas.
The road density indicator was calculated based on OSM data. One may notice that, while the indicators for the DE and PL areas are similar, the road density in UA is significantly different. This matches the characteristics of the countries that were presented in the previous sub-section. As far as mean travel cost is concerned, the area in UA is the least accessible. It has the lowest road density and index of urbanisation, which results in the fact that the routes to potential rescue operation sites located away from the road network are much longer than in the other areas that have a much higher road density. This also translates into higher costs of travel.
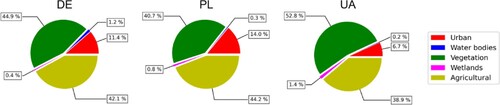
In order to analyse the obtained results in a more detailed way, all the analysed areas were divided into 5 land cover categories: urban areas, vegetation, agricultural areas, wetlands, and water bodies. The classification was based on data obtained from the Copernicus Global Land Service (CGLS) (‘Land Cover | Copernicus Global Land Service’, Citationn.d.). This system is a component of the European Earth observations programme. Land cover data are distributed at the resolution of 100 m and they originate from the year 2019. Originally, the area of the whole world was divided into 22 categories, but for the purposes of this study, the data have been reclassified to fall into the 5 categories listed above. The percentage share of each category in the total surface area of the analysed areas is visualised in .
Figure 14. Percentage of land cover categories in the analysed areas.
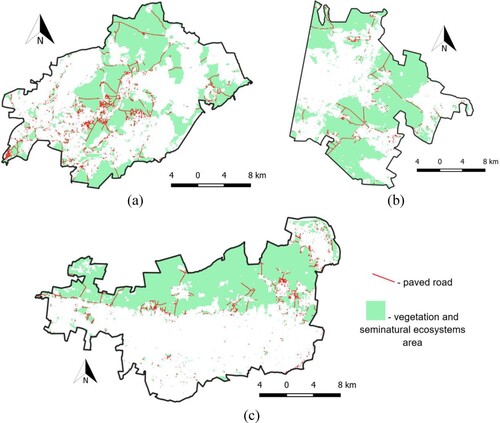
In order to present the spatial distribution of specific land cover areas in the analysed areas, land cover maps were generated that are presented in .
Figure 15. Maps of land cover categories in the analysed areas: (a) DE; (b) UA; (c) PL.
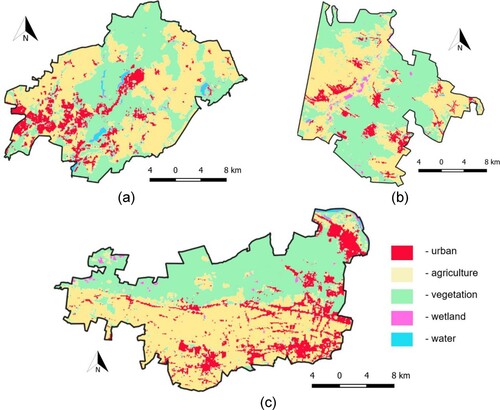
The size of the developed area strongly influences the road quality and density, as developed areas require access roads. The high degree of urbanisation in the PL area results from the fact that it is populated by people who work in Warsaw. They choose to settle there due to very good and quick access (the A2 motorway passes through the county). It is also a perfect location for numerous manufacturing plants and large companies. As for the category of vegetation and semi-natural ecosystems, it includes all types of forests, bushes, and open areas devoid of vegetation or with a sparse land cover. shows clearly that the area that has the largest share of this land cover category (52.8%) is that of UA. This, together with the low degree of urbanisation, contributes directly to the low density of roads in the area. The DE area is covered by this category in 45%, and in Poland is has the smallest share. The reverse may be observes for agricultural areas that have the largest share in land cover in PL (236.0 km2) and the lowest – in UA (209.3 km2). Wetlands and water bodies account for the smallest parts of the analysed areas.
presents the mean values of travel cost (from ) for specific land cover categories in the analysed areas.
Table 4. Mean travel cost for specific land cover categories.
It is noticeable that in all analysed regions, urban areas are characterised by the lowest cost of travel among all categories. This results from the fact that buildings are always located near roads to enable access. As far as agricultural areas are concerned, the PL area had the lowest travel cost (0.14), which gives it a significant advantage over the other analysed regions. These discrepancies are explained in .
Figure 16. Paved roads in agricultural areas in the analysed regions: (a) DE; (b) UA; (c) PL.
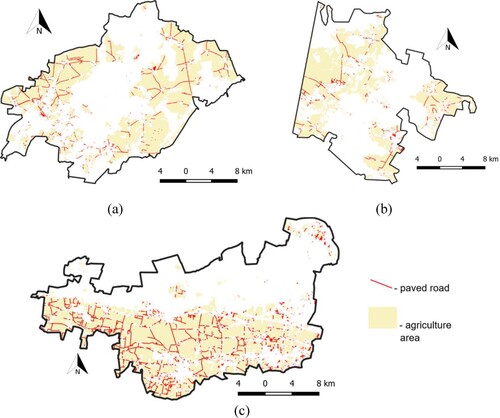
The illustration above clearly demonstrates that the densest network of paved roads in these areas can be found in PL, while the lowest – in UA. This directly influences the value of mean travel cost in this category (), as the cost of travel increases with the decreasing density of roads. A similar situation may be notices in areas covered by vegetation and semi-natural ecosystems, which is shown in .
Figure 17. Paved roads in areas covered by vegetation and semi-natural ecosystems in the analysed areas: (a) DE; (b) UA; (c) PL.
Wetlands and water bodies have the lowest surface area among all the selected categories of land cover. The lowest travel cost in wetlands is found in Germany (0.23), while the areas of PL and UA are characterised by similar, high transport costs (respectively 0.54 and 0.60). Finally, water bodies are classified as impassable areas in passability maps, so their relatively low travel cost in the analysed regions results from the fact that the data from CGLS are in the resolution of 100 m and they do not include water courses that are significantly narrower. On the other hand, road infrastructure often exists around larger water bodies, which positively influences the value of travel cost in such areas.
4.3. Results verification
As far as the results verification is concerned, photographic documentation and measured profiles () clearly show that generated routes can be passed by analysed MAN TGM 15.290 BL vehicle and also that the indicated microrelief objects are impassable. Their steep banks make it impossible for the vehicle to pass because slopes are higher than maximum approach and descent angles. Profile 2 in terrain 2 shows also that the culvert is wide enough to be passed by the vehicle. It can also be seen in that as far as terrain 1 was covered by a grass, the route on terrain 2 led through areas with vegetation of about 1 metre height which could hinder the movement of a vehicle.
5. Conclusions
This article presents the methodology that enables to determine the access routes to places located outside the transportation network and the analysis of accessibility of three areas situated in the vicinity of the capital cities (Berlin, Warsaw, and Kiev) of three European Countries (Germany, Poland, and Ukraine). The analysis of the degree of development of these countries revealed that the values of GDP per capita and of the HDI index are linked to the quality of roads in there. The higher these indicators, the better the road quality index, which is noticeable, e.g. for the examples of Germany and Ukraine ().
The results of the research are the terrain accessibility maps presented in , which provide visualisations of the vehicle movement possibilities in the whole analysed areas. Such maps extend the possibilities not only for planning vehicle movement, but also for various operations conducted as part of widely understood crisis management. The methodology used for generating the terrain accessibility maps may be applied practically in any area of the world due to the global availability of OSM data what makes it universal.
Moreover, the classification of the analysed areas into five categories demonstrated the correlations between the type of land cover and the average travel cost. The list provided in demonstrates that the lowest travel costs in each country are characteristic for urban areas, which result from the presence of paved roads. As far as the other land cover categories are concerned, it proved that the uniform distribution of paved roads has a significant positive influence on the travel cost what improves the overall accessibility of land. This was particularly visible in agricultural areas in PL () and areas covered with vegetation and semi-natural ecosystems in DE ().
Apart from that, the case study presented in the article provides a solution of a crisis management case of a rescue operation. The study is an example of the practical application of the developed algorithm for automated determination of optimised access routes to the site of a fire. It is worth noting that the input conditions that included the actual position of the County Fire Station, the actual traction parameters of the fire truck, and the location of sites of fire in places where actual buildings are situated, were realistic. This demonstrates the great possibilities to use the methodology in planning various types of rescue operations. One of its major advantages is its universal applicability, as the routes outside the road network may be adjusted to specific types of vehicles by entering three traction parameters (ground clearance, track width, and wheelbase). What is more, the process of generating access routes is fully automated. and may be performed before the start of the rescue operation, which will allow to ensure its optimisation. Additionally, the conducted field inspection and measurements confirmed the correctness of microrelief analysis and proved that the generated routes were passable.
In conclusion, the developed methodology may be widely applied by public administration bodies that realise the tasks related to crisis management, where rescue units are often required to access areas situated away from the road network. Further research should focus on taking into account the atmospheric conditions, which directly affect the parameters of soils on which the vehicles will move, which would expand the developed methodology to cover another important aspect.
Disclosure statement
No potential conflict of interest was reported by the author(s).
Additional information
Funding
References
- Ahola, T., K. Virrantaus, J. M. Krisp, and G. J. Hunter. 2007. “A Spatio-Temporal Population Model to Support Risk Assessment and Damage Analysis for Decision-Making.” International Journal of Geographical Information Science 21: 935–953. doi:10.1080/13658810701349078.
- Alçada-Almeida, L., L. Tralhão, L. Santos, and J. Coutinho-Rodrigues. 2009. “A Multiobjective Approach to Locate Emergency Shelters and Identify Evacuation Routes in Urban Areas.” Geographical Analysis 41: 9–29. doi:10.1111/j.1538-4632.2009.00745.x.
- Cai, G. 2005. “Extending Distributed GIS to Support Geo-Collaborative Crisis Management.” Geographic Information Sciences 11: 4–14. doi:10.1080/10824000509480595.
- Cepolina, E. M. 2005. “A Methodology for Defining Building Evacuation Routes.” Civil Engineering and Environmental Systems 22: 29–47. doi:10.1080/10286600500049946.
- Chen, Yuehong, Y. Li, G. Wu, F. Zhang, K. Zhu, Z. Xia, and Yu Chen. 2021. “Exploring Spatiotemporal Accessibility of Urban Fire Services Using Real-Time Travel Time.” International Journal of Environmental Research and Public Health 18: 4200. doi:10.3390/ijerph18084200.
- Dawid, W., and K. Pokonieczny. 2020. “Analysis of the Possibilities of Using Different Resolution Digital Elevation Models in the Study of Microrelief on the Example of Terrain Passability.” Remote Sensing 12: 4146. doi:10.3390/rs12244146.
- Dawid, W., and K. Pokonieczny. 2021. “Methodology of Using Terrain Passability Maps for Planning the Movement of Troops and Navigation of Unmanned Ground Vehicles.” Sensors 21: 4682. doi:10.3390/s21144682.
- Eurostat [WWW Document]. n.d. Accessed February 7, 2022. https://ec.europa.eu/eurostat/databrowser/view/NAMA_10R_2GDP__custom_2030276
- FathiZahraei, M., G. Marthandan, M. Raman, and A. Asadi. 2015. “Reducing Risks in Crisis Management by GIS Adoption.” Natural Hazards 76: 83–98. doi:10.1007/s11069-014-1474-z.
- Foreign trade [WWW Document]. n.d. Federal Statistical Office. Accessed November 19, 2021. https://www.destatis.de/EN/Themes/Economy/Foreign-Trade/Tables/imports-exports.html
- Górecki, J. n.d. Report prepared by the Association of Business Service Leaders (ABSL) 72.
- Hošková-Mayerová, Š. 2015. “Geospatial Data Reliability, Their Use In Crisis Situations.” International Conference Knowledge-Based Organization 21: 694–698. doi:10.1515/kbo-2015-0117.
- International Trade Administration, n.d. Ukraine - Infrastructure [WWW Document]. Accessed November 25, 2021. https://www.trade.gov/country-commercial-guides/ukraine-infrastructure
- Javaid, M. A. 2013. “Understanding Dijkstra’s Algorithm.” SSRN Electronic Journal 28. doi:10.2139/ssrn.2340905.
- Jokar Arsanjani, J., A. Zipf, P. Mooney, and M. Helbich. 2015. “An Introduction to OpenStreetMap in Geographic Information Science: Experiences, Research, and Applications.” In OpenStreetMap in GIScience: Experiences, Research, and Applications, Lecture Notes in Geoinformation and Cartography, edited by Jokar Arsanjani, A. Zipf, P. Mooney, and M. Helbich, 1–15. Cham: Springer International Publishing. doi:10.1007/978-3-319-14280-7_1
- Kitamura, F., D. Inazu, T. Ikeya, and A. Okayasu. 2020. “An Allocating Method of Tsunami Evacuation Routes and Refuges for Minimizing Expected Casualties.” International Journal of Disaster Risk Reduction 45: 101519. doi:10.1016/j.ijdrr.2020.101519.
- Land Cover | Copernicus Global Land Service [WWW Document]. n.d. Accessed December 12, 2021 https://land.copernicus.eu/global/products/lc
- Law of 26 April 2007 on crisis management [WWW Document]. 2007. Accessed September 6, 2022. https://isap.sejm.gov.pl/isap.nsf/DocDetails.xsp?id=wdu20070890590
- Lim, G. J., M. Rungta, and M. R. Baharnemati. 2015. “Reliability Analysis of Evacuation Routes Under Capacity Uncertainty of Road Links.” IIE Transactions 47: 50–63. doi:10.1080/0740817X.2014.905736.
- Majerova, I. 2012. “Comparison of Old and New Methodology in Human Development and Poverty Indexes: A Case of the Least Developed Countries.” Journal of Economics Studies and Research, 1–15. doi:10.5171/2012.290025.
- Mihara, Y., R. Hirakawa, H. Kawano, K. Nakashi, and Y. Nakatoh. 2019. Study on evaluating risks of routes damages at Earthquakes for Evacuation Guidance System, in: Proceedings of the 7th ACIS International Conference on Applied Computing and Information Technology, ACIT 2019. Association for Computing Machinery, New York, NY, USA, pp. 1–6. doi:10.1145/3325291.3325390
- Min, S., D. Kim, and C. K. Lee. 2019. Association between spatial accessibility to fire protection services and unintentional residential fire injuries or deaths: a cross-sectional study in Dallas, Texas. BMJ Open 9, e023780. doi:10.1136/bmjopen-2018-023780
- NBU Comment on Change in Real GDP in 2020 [WWW Document], n.d. National Bank of Ukraine. Accessed November 25, 2021. https://bank.gov.ua/en/news/all/komentar-natsionalnogo-banku-schodo-zmini-realnogo-vvp-u-2020-rotsi
- OpenStreetMap [WWW Document], n.d. OpenStreetMap. Accessed November 2, 2021 https://www.openstreetmap.org/.
- Péroche, M., F. Leone, and R. Gutton. 2014. An Accessibility Graph-based Model to Optimize Tsunami Evacuation Sites and Routes in Martinique, France, in: Advances in Geosciences. Presented at the Caribbean Waves 2 Conference - 2nd International Conference Caribbean Waves, Le Gosier, Guadeloupe, France, 22–25 January 2013, Copernicus GmbH, pp. 1–8. doi:10.5194/adgeo-38-1-2014
- Pokonieczny, K. 2017a. Methods of Using Self-organising Maps for Terrain Classification, Using an Example of Developing a Military Passability Map, in: Dynamics in GIscience, Lecture Notes in Geoinformation and Cartography. Presented at the Proceedings of GIS Ostrava, Springer, Cham, pp. 359–371. doi:10.1007/978-3-319-61297-3_26
- Pokonieczny, K. 2017b. Automatic Military Passability Map Generation System, in: 2017 International Conference on Military Technologies (ICMT). Presented at the 2017 International Conference on Military Technologies (ICMT), IEEE, Brno, Czech Republic, pp. 285–292. doi:10.1109/MILTECHS.2017.7988771.
- Pokonieczny, K. 2018a. “Comparison of Land Passability Maps Created with use of Different Spatial Data Bases.” Geografie 123: 317–352. doi:10.37040/geografie2018123030317.
- Pokonieczny, K. 2018b. “Use of a Multilayer Perceptron to Automate Terrain Assessment for the Needs of the Armed Forces.” ISPRS International Journal of Geo-Information 7: 430. doi:10.3390/ijgi7110430.
- Pokonieczny, K., and A. Mościcka. 2018. The Influence of the Shape and Size of the Cell on Developing Military Passability Maps. ISPRS International Journal of Geo-Information 7. doi:10.3390/ijgi7070261
- PP - MAN TGM 15.290 BL [WWW Document]. n.d. Accessed November 29, 2021. https://www.ppoz.pl/zajrzyj-do-srodka/technika/784-man-tgm-15-290-bl
- Pursals, S. C., and F. G. Garzón. 2009. “Optimal Building Evacuation Time Considering Evacuation Routes.” European Journal of Operational Research 192: 692–699. doi:10.1016/j.ejor.2007.10.004.
- Rada, J., M. Rybansky, and F. Dohnal. 2020. “Influence of Quality of Remote Sensing Data on Vegetation Passability by Terrain Vehicles.” ISPRS International Journal of Geo-Information 9: 684. doi:10.3390/ijgi9110684.
- Rada, J., M. Rybansky, and F. Dohnal. 2021. “The Impact of the Accuracy of Terrain Surface Data on the Navigation of Off-Road Vehicles.” ISPRS International Journal of Geo-Information 10: 106. doi:10.3390/ijgi10030106.
- Raeesi, M., and A. Sadeghi-Niaraki. 2013. Gis Based System for Post-Earthquake Crisis Managment Using Cellular Network, in: Arefi, H., Sharifi, M.A., Reinartz, P., Delavar, M.R. (Eds.), Smpr Conference 2013. Copernicus Gesellschaft Mbh, Gottingen, pp. 321–325.
- Raškauskaitė, R., and V. Grigonis. 2019. “An Approach for the Analysis of the Accessibility of Fire Hydrants in Urban Territories.” ISPRS International Journal of Geo-Information 8: 587. doi:10.3390/ijgi8120587.
- Regulation on the unified state system of civil protection [WWW Document]. 2014. Accessed September 10, 2022. https://zakon.rada.gov.ua/laws/show/11-2014-%D0%BF#Text
- Rehak, D., M. Radimsky, M. Hromada, and Z. Dvorak. 2019. “Dynamic Impact Modeling as a Road Transport Crisis Management Support Tool.” Administrative Sciences 9: 29. doi:10.3390/admsci9020029.
- Rifai, M., and S. Zhenjiang. 2019. “The use of Hexagon Tessellation for Virtual Network Analysis of Evacuation Distance.” International Review for Spatial Planning and Sustainable Development 7 (3): 17–32. doi:10.14246/irspsd.7.3_1.
- Roads quality by country, around the world [WWW Document]. n.d. TheGlobalEconomy.com. Accessed November 15, 2021. https://www.theglobaleconomy.com/rankings/roads_quality/
- Rybansky, M. 2020. “Determination the Ability of Military Vehicles to Override Vegetation.” Journal of Terramechanics 91: 129–138. doi:10.1016/j.jterra.2020.06.004.
- Rybanský, M., and M. Vala. 2009. Cartographic Visualization of Relief Impact on Transport during Crisis Situations. Presented at the 24th International Cartographic Conference.
- Shahparvari, S., M. Fadaki, and P. Chhetri. 2020. “Spatial Accessibility of Fire Stations for Enhancing Operational Response in Melbourne.” Fire Safety Journal 117: 103149. doi:10.1016/j.firesaf.2020.103149.
- Subnational HDI Maps - Global Data Lab [WWW Document]. n.d. Accessed February 7, 2022 https://globaldatalab.org/shdi/maps/shdi/
- System of crisis management in Germany [WWW Document]. 2015. Accessed September 10, 2022 https://www.bmi.bund.de/SharedDocs/downloads/DE/publikationen/themen/bevoelkerungsschutz/krisenmanagement-in-deutschland.pdf
- Tennøy, A., M. Knapskog, and F. Wolday. 2022. “Walking Distances to Public Transport in Smaller and Larger Norwegian Cities.” Transportation Research Part D: Transport and Environment 103: Article 103169. doi:10.1016/j.trd.2022.103169.
- Tiznado-Aitken, I., J. C. Muñoz, and R. Hurtubia. 2021. “Public Transport Accessibility Accounting for Level of Service and Competition for Urban Opportunities: An Equity Analysis for Education in Santiago de Chile.” Journal of Transport Geography 90: Article 102919. doi:10.1016/j.jtrangeo.2020.102919.
- Ukrstat.org - State Statistics Service of Ukraine [WWW Document]. n.d. Accessed February 7, 2022. https://ukrstat.org/uk/operativ/operativ2021/vvp/kvartal_new/vrp/arh_vrp_u.html
- UNDP. 2020. The Next Frontier: Human Development and the Anthropocene, Human Development Report. New York: United Nations Development Programme.
- Vakalis, D., H. Sarimveis, C. T. Kiranoudis, A. Alexandridis, and G. Bafas. 2004. “A GIS Based Operational System for Wildland Fire Crisis Management II. System Architecture and Case Studies.” Applied Mathematical Modelling 28: 411–425. doi:10.1016/j.apm.2003.10.006.
- Wachtel, G., J.-D. Schmöcker, Y. Hadas, Y. Gao, O. E. Nahum, and B. Ben-Moshe. 2021. “Planning for Tourist Urban Evacuation Routes: A Framework for Improving the Data Collection and Evacuation Processes.” Environment and Planning B: Urban Analytics and City Science 48: 1108–1125. doi:10.1177/2399808321994575.
- WDI - The World by Income and Region [WWW Document]. n.d. Accessed November 22, 2021. https://datatopics.worldbank.org/world-development-indicators/the-world-by-income-and-region.html
- World Bank Open Data | Data [WWW Document]. n.d. Accessed November 15, 2021. https://data.worldbank.org/