
 ?Mathematical formulae have been encoded as MathML and are displayed in this HTML version using MathJax in order to improve their display. Uncheck the box to turn MathJax off. This feature requires Javascript. Click on a formula to zoom.
ABSTRACT
Advanced Very High Resolution Radiometer (AVHRR) onboard National Oceanic and Atmospheric Administration (NOAA) satellites can provide over 40 years of global remote sensing observations, which can be used to retrieve long-term aerosol optical depth (AOD). This is of great significance to the study of global climate change. In this paper, we proposed an algorithm to jointly calculate AOD and land surface properties from AVHRR observations. With assumptions that AOD doesn’t vary in adjacent space and earth surface property doesn’t vary in two days, the algorithm considered non-Lambertian surface reflection based on the shape of bidirectional reflectance distribution function (BRDF shape) and obtained AOD and surface property by optimal estimation (OE) method. The algorithm has been applied to NOAA-7, 9, 11, 14, 16, 18, and 19 satellites and AVHRR-retrieved AOD with 5 × 10 km over China (15°–60° N, 70°–140°E) has been obtained from 1982 to 2016. Comparisons of AVHRR-retrieved AOD against AErosol RObotic NETwork (AERONET) (in and around China) and China Aerosol Remote Sensing Network (CARSNET) AOD show good consistency with 62.62% points within the uncertainty of Δτ = ± (0.05 + 0.25τ) and root-mean-square error (RMSE) of 0.26. Further comparison of the monthly mean AOD of multiple AOD datasets in the ‘Beijing’, ‘Dalanzadgad’, ‘NCU_Taiwan’ and ‘Kanpur’ stations shows that the results of the algorithm are stable. The yearly averaged AOD data also has similar agreements with MERRA-2 (The Modern-Era Retrospective analysis for Research and Applications, Version 2) and AVHRRDB data (AVHRR ‘Deep Blue’ aerosol data set). The multi-year mean correlation coefficient is 0.70 and 0.61 and the percentages within the uncertainty are 80.01% and 67.29% compared with MERRA-2 AOD and AVHRRDB AOD respectively.
1. Introduction
Aerosols are one of the significant air pollutants that are produced from a variety of causes, including dust, flannel, smoke, haze, etc. Moreover, heavy aerosols mostly have the following two effects on human life: (1) haze or heavy dust aerosols can limit visibility, which interferes with transportation and people's everyday lives (Charlson Citation1969; Moses and Akinyemi Citation2017); (2) They are unhealthy for individuals, leading to respiratory and pulmonary disorders, especially fine particle matters (Tie, Wu, and Brasseur Citation2009; McGuinn et al. Citation2016). Additionally, aerosols have significant impacts on biogeochemical cycles and global climate change (Twomey Citation1977; Kaufman, Tanré, and Boucher Citation2002; Verma et al. Citation2017). Therefore, precise aerosol monitoring is crucial for quantitative assessment of the anthropogenic contribution to climate change and for guiding people to live healthy lives. It is essential to meet global grand challenges for sustainable development (Kulmala et al. Citation2021).
The capacity to quantify aerosol loading in the atmosphere makes aerosol optical depth one of the most important indicators for comprehending atmospheric physics and local air quality (Wei et al. Citation2019b). With the development of multi-spectral sensor, multi-angle sensor, high spectrum sensor, polarization sensor, radar, etc. and different platforms such as polar orbit satellite and earth synchronous satellite, researchers put forward many inversion algorithms which makes the retrieval of AOD from spaceborne sensor observations a major technique for monitoring aerosol loads on a large scale. As the first sensor that has been applied to retrieve AOD, AVHRR has the advantages of a wide swath, global observation and long-time observations and AOD from AVHRR over the ocean has been produced operationally (Zhao et al. Citation2002; Zhao Citation2004; Zhao et al. Citation2008). However, several widely used algorithms such as ‘Dark Target’ (DT) and ‘Deep Blue’ (DB) cannot be employed directly in AVHRR AOD retrieval over land since it only has a red channel in the visible spectrum and lacks the 2.1μm channel (Kaufman et al. Citation1997; Hsu et al. Citation2004, Citation2013; Levy, Remer, Mattoo et al. Citation2007).
Although there are many challenges such as a single visible band and problems with the AVHRR calibration (Li et al. Citation2014), many researchers try to develop algorithms that can be applied to obtain AOD over land from AVHRR observation. These algorithms can be categorized into one of the two categories listed below:
The surface reflectance is obtained first, and then AOD from AVHRR is retrieved from the atmospheric radiation transfer model. These methods obtain surface reflectance in different ways. Hauser et al. (Citation2005) estimated NOAA-16 channel 1 surface reflectance from a time series including the previous 44 days and derived AOD over Central Europe from 2001 to December 2002. Takemata, Fukui, and Kawata (Citation2006) achieved 0.64μm surface reflectance by fitting the linear relationship of surface reflectance between 0.64μm and 3.75μm and obtained the AOD on 24 and 25 April 1997. The study only got two days of AOD and only 31 points were used for fitting the surface reflectance. Wang et al. (Citation2021) proposed a dual-channel aerosol optical depth retrieval algorithm that takes the BRDF effect into account and the algorithm was applied between 2008 and 2010. This method achieved a surface reflectance ratio of 0.63μm to 0.85μm from the corrected least top-of-atmospheric (TOA) reflectance ratio in 31 days. Li et al. (Citation2021) proposed an improved dense dark vegetation algorithm, which applied MODIS (Moderate-resolution Imaging Spectroradiometer) vegetation index products to correct AVHRR NDVI (Normalized Difference Vegetation Index) to estimate AVHRR land surface reflectance, and retrieved AOD in mid-eastern America from June to October 2016. Moreover, Xue et al. (Citation2017) presented an algorithm obtaining 0.64μm surface reflectance by fitting 3.75μm surface reflectance, NDVI, and scatter angle at different land types and different seasons and obtained AOD data set over North China and Central Europe for 35 years. Hsu et al. (Citation2017) developed a physics-based algorithm to retrieve AOD from AVHRR both over land and ocean. The algorithm applied over land is an extension of the DB algorithm. The global AOD dataset (AVHRRDB) produced from NOAA-11, 14, and 18 satellite observations are available at the website https://portal.nccs.nasa.gov/datashare/AVHRRDeepBlue.
AVHRR AOD is obtained through experience relationships, such as regression methods or machine learning methods. Tian et al. (Citation2022) generated AVHRR AOD products in 1998, 2006, and 2015 using machine learning training of AVHRR Level-2 data and MODIS AOD in 2014. Gao et al. (Citation2016, Citation2019) got AOD over China from 1982 to 2011 using multiple regression relationships generated from Aqua/MODIS AOD and AVHRR Level_1b data. However, this data set was validated only on a monthly scale.
All the above methods are favorable attempts for AVHRR AOD inversion, especially the studies of Xue et al. (Citation2017), Gao et al. (Citation2019), and Hsu et al. (Citation2017) which provided AVHRR AOD results for long time series. However, the performance of AVHRR AOD results in a long-time sequence over China is still to be improved.
In this paper, AVHRR AOD results were obtained with the optimal estimation method with prior knowledge and reasonable assumptions. Different from the above two types of methods, in addition to taking into account the surface's BRDF features, our work concurrently estimated AOD and surface attributes from AVHRR measurements. We obtained the long-time range AOD data from 1982 to 2016 over China which have high precision in the research region compared to ground-based observations. The remaining part of the article is organized as follows. Section 2 gives the introduction of the data used in this paper and an overview of the study area. Section 3 describes the detailed implementation process of the proposed algorithm. Section 4 gives the evaluation of the AVHRR-retrieved AOD results against ground-based station measurements and comparisons with other algorithm results. The discussions and conclusion are given in the last section.
2. Data and study area
2.1 Data
In this study, many data are used for inversion including AVHRR level 1B Global Area Coverage (GAC) product, MCD43C1 Albedo/BRDF model parameters, MCD12C1 land cover type and the data used for validation and comparison include AERONET and CARSNET measurements, AVHRRDB AOD and MERRA-2 AOD. The data information is summarized as shown in .
Table 1. Description of data used in the paper.
2.1.1 AVHRR GAC
AVHRR is the sensor onboard the NOAA family of meteorological satellites. It has five spectral bands and a spatial resolution of 1.1 km at the nadir. AVHRR sensor scans with ± 55° from the nadir and has a large swath width of 2800 km which could scan the earth twice per day. The first AVHRR sensor carried by TIROS-N, was launched on 13 October 1978 and the latest AVHRR sensor, aboard Metop-C, was launched on 6 November 2018. During the period, AVHRR sensors were improved in four generations. At present, there are over 40 years of AVHRR sensor data records. It provides the following four level 1B data types: The Local Area Coverage dataset recording a portion of the orbit at the original resolution (1.1 km); the real-time downlink data – High Resolution Picture Transmission (1.1 km); the Global Area Coverage dataset which could provide 4 km reduced spatial resolution global observation; the daily data – Full Resolution Area Coverage (1.1 km) of the entire globe with the launch of Metop-A on 19 October 2006. In this paper, we have used AVHRR GAC data for AVHRR AOD inversion.
The satellites with AVHRR sensors pass the equator twice per day. As some morning satellites cross the equator at 7:30, the zenith angle of solar is too large and there is less sun coverage, we have chosen afternoon satellites for research including NOAA-7, 9, 11, 14, 16, 18, and 19. They have the observation at about 14:00 local time. The specific AVHRR information is as shows. It must be pointed out that the calibration of AVHRR has problems due to changes in the instrument’s response (Molling et al. Citation2010). In this study, we recalibrated AVHRR channel 1 by the calibration coefficients provided by Li et al. (Citation2014).
Table 2. AVHRR data from the following sensors were used in this paper.
2.1.2 MODIS products
MODIS sensors which are abroad on Terra and Aqua launched in 2000 and 2002 have 36 channels and have been used in many research fields such as meteorology, land, glaciers, and oceans (Myhre, Kvalevåg, and Schaaf Citation2005; Galford et al. Citation2008; Grobler et al. Citation2012; Natsagdorj et al. Citation2021; Jiang et al. Citation2021). In this study, MCD12C1 product was used to mask the water body over the study area. MCD43C1 provided BRDF model parameters which could produce BRDF shape.
2.1.3 Other products
AVHRRDB V001 product provides AOD parameter retrieved from AVHRR (NOAA-11:1989.07-1991.05, NOAA-14:1995.01-1999.12, NOAA-18:2006.01-2011.12). Level 2 product contains data from a 5-minute portion of a single AVHRR swath and has an 8.8 km spatial resolution. Level 3 product includes daily and monthly AOD with a spatial resolution of 1° × 1°. In this paper, monthly AOD was processed for cross-comparison with AVHRR-retrieved results.
MERRA-2 is a long time series of reanalysis data including various meteorological variables such as net radiation, temperature, relative humidity, wind speed, etc. It is released by NASA's Global Modeling and Assimilation Office in 2016. MERRA-2 AOD reanalysis product can provide AOD from 1980 to the present every three hours and have a certain accuracy (Aldabash, Balcik, and Glantz Citation2020; Zhang et al. Citation2020). MERRA-2 AOD was used for cross-comparison with AVHRR AOD in time series.
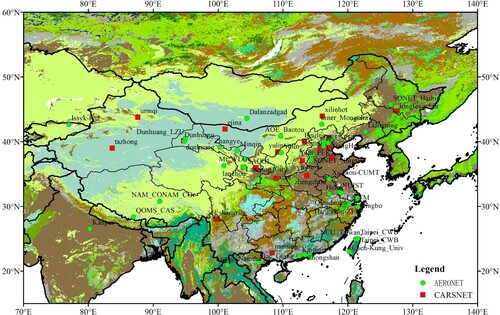
AERONET is a global ground-based atmospheric aerosol observation network. Its long-term observation data have been widely used in aerosol research and characterization, satellite data validation, etc. CARSNET is also the network created by China which has been proven to have the same accuracy as AERONET (Xie et al. Citation2011) and has more stations in China. They can provide accurate AOD at 1020, 870, 670, 440 nm, and Angstrom exponent which can calculate AOD at other wavelengths. Ground-based stations used in the paper are illustrated in . Due to the dearth of long-term observation sites in China, some AERONET sites around China are also chosen for the verification of the results.
2.2. Study area
The study region with the extent of 15°–60°N, 70°–140°E over China and surrounding areas were selected to apply the algorithm as shows. This region has complex topography and various land cover types. The complex surface and atmospheric conditions and large altitude spans in the study area require high applicability of the algorithm.
Figure 1. The study area and distribution of used AERONET&CARSNET stations.
3. Methodology
3.1 Radiative transfer model
3.1.1 Li-Qin model
Li-Qin model is a forward atmospheric radiative transfer model considering non-Lambert surface conditions. It can simulate atmospheric radiation transfer in the ultraviolet to near-infrared spectral range (Li et al. Citation1996; Qin, Herman, and Ahmad Citation2001). Lin-Qin model is expressed as follows:
(1)
(1) In the above,
represents the spectral reflectance at the top of the atmosphere after atmospheric and surface reflection.
is path reflectance reflected by atmospheric aerosols and molecules.
means AOD,
and
are angle-dependent variables denoting the cosine of solar zenith angle and satellite zenith angle respectively.
refers to diffuse transmission and
is the spherical albedo of the atmosphere. Li-Qin model is based on the four flux theory and uses four albedo parameters
,
,
and
to express surface BRDF property.
is bi-directional surface reflectance, that is, the direct reflection of the incoming direct sunlight.
is directional-hemispherical reflectance (DHR), which describes the diffuse reflection of the incoming direct sunlight across the hemispherical.
is hemispherical-directional reflectance (HDR) which describes the direct reflection of the incident sunlight from the entire hemispherical.
is bi-hemispherical reflectance. Li-Qin Model is highly accurate in the ultraviolet to near-infrared spectrum and the average relative difference for different surface types is less than 0.7% (Qin, Herman, and Ahmad Citation2001).
3.1.2 RTLS model and BRDF shape
For describing the surface BRDF effect, we adopted Ross-Thick-Li-Sparse (RTLS) model to simulate surface directional reflectance (Wanner, Li, and Strahler Citation1995). RTLS is a semi-empirical kernel-driven model and it has been applied in the MODIS MCD43 product (Schaaf et al. Citation2002).
(2)
(2) It provides bi-directional reflectance
(defined as
in Eq. (1)) as a function of three parameters and three geometric kernels:
,
,
are coefficients and
,
,
are kernels depended on observation conditions and they can be calculated by (Strahler Citation1999).
,
,
separately refer to the zenith direction of light incoming and leaving and their relative azimuth.
represents wavelength but the kernels are wavelength-independent. At the same time, the other three reflectance parameters defined in Equation (1) can be calculated using the RTLS model, which can be found in (He et al. Citation2012; She et al. Citation2019).
To simplify the expression of BRDF parameters, (2) can be rewritten as:
(3)
(3) where
(4)
(4) and
(5)
(5) Eq. (4) is defined as BRDF shape which is stable and varies little in the same period of the year (Li et al. Citation2017). Now, the BRDF effect can be expressed with one parameter
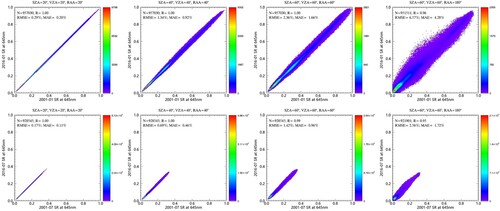
. BRDF shape was generated by the MCD43C1 product. The parameters where quality assessment is better than 2 were selected for averaging on a monthly scale. To obtain a more effective inversion, we use the results of 5-year data averages to fill in the missing values. To test the stability of BRDF shape over long time series, we have compared the effects of BRDF shape for surface bidirectional reflectance and found that the reflectance varies little under different observation conditions between 2001 and 2016. Here, we applied monthly averaged
to simulate the surface bidirectional reflectance of these two years. As illustrated in , the simulated reflectance difference between 2001 and 2016 is minor when the zenith angle and azimuth angle of the sun and satellite are small, and big when these angles are large. At the same time, there is a large seasonal variance in the simulated reflectance difference, with a modest difference in July and a large difference in January. However, the simulated bidirectional reflectance is consistent each month and the root-mean-square errors of reflectance of the entire period are lower than 7% under different observation conditions. Therefore, 2001 year’s BRDF shape parameters were applied for AVHRR inversion work before 2001.
Figure 2. Comparison of simulated bi-directional reflectance between 2001 and 2016 in January and July under different observation conditions (SZA, VZA, and RAA refer to solar zenith angle, satellite zenith angle, and relative azimuth angle, respectively). N is total matched points for comparison. R means correlation coefficient. RMSE represents root-mean-square error and MAE denotes mean absolute error. The color bar of each scatter plot on the right side is the matchup number for each square at dx = 0.005 & dy = 0.005.
3.2 Aerosol model
MODIS DT algorithm clustering AERONET relative parameters obtained four aerosol types: moderately absorbing, absorbing, non-absorbing, and spheroid aerosol models, together with the continental model (Levy, Remer, and Dubovik Citation2007), has a good performance in a long time series (Wei et al. Citation2019a; Che et al. Citation2019). Levy, Remer, and Dubovik (Citation2007) determined seasonal 1°×1° maps of expected aerosol types and we directly use the five aerosol models and their seasonal distributions used by MODIS DT product for AVHRR AOD inversion in this study.
3.3 Retrieval strategy
In this study, surface reflectance is not directly estimated to retrieve AOD, but surface parameters and AOD are simultaneously estimated by an iteration process. Here, the 0.63μm channel observations were used to retrieve AOD. For each pixel, there are two parameters to be solved with only one observation. For more information, we selected adjacent two days and multi-pixels to jointly calculate based on two reasonable assumptions: (1) the surface property doesn’t vary in two days, which means in formula (3) doesn’t change in the period. (2) AODs are the same in a certain space with N pixels. So, we have 2×N observations and 2 + N unknowns. Obviously, when N≥2, we can achieve robust retrieval relatively. In this paper, we applied N = 2, that is, in the 2×1 strip range (10×5 km2) for AVHRR AOD inversion.
In order to solve the above process, we used the optimal estimation method to join the iteration (Govaerts et al. Citation2010; Wagner, Govaerts, and Lattanzio Citation2010; She et al. Citation2019). It minimizes the cost function to obtain the optimal solution and the cost function is shown as follows:
(6)
(6) Where,
is the cost function.
represents the parameters to be solved that are
and
in this research and
denotes initial values for iteration.
means TOA reflectance obtained from AVHRR channel 1 observation and
represents the TOA reflectance simulated by Li-Qin model. Both
and
are error covariance matrices, represent the error matrix of AVHRR observation and initial guesses, respectively. For AVHRR channel 1, each observation and adjacent pixels are considered to be independent. Therefore,
is defined as a diagonal matrix with 0.04 diagonal elements.
is also defined as a diagonal considering that AOD and surface property
are independent. The initial AOD is set to a fixed value of 0.2 and
is set as the MODIS BRDF product’s monthly average. The value of the diagonal
is determined by the following three parts: (1) 10% uncertainty of MODIS BRDF product. (2) the standard deviation of
each month (She et al. Citation2019) and the maximum standard deviation over the years applied to data before 2001. (3) a large value to ensure that prior knowledge provides weak constraints.
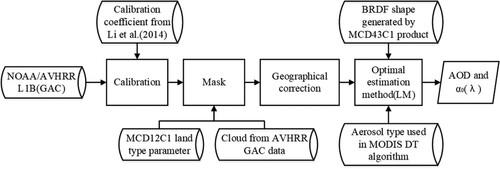
To minimize the cost function, we used Levenberg–Marquardt method for iterative solutions. The whole process of the algorithm is illustrated in .
Figure 3. The flow chart of algorithm implementation.
4. Result
The algorithm was applied to AHVRR GAC data and the AOD results were obtained from 1982 to 2016 over the study area. To evaluate the accuracy of AVHRR-retrieved AOD, we used AERONET and CARSNET AOD for direct validation. In order to verify the validity of the AVHRR-retrieved AOD over a long period, we compared the algorithm results with AVHRRDB and MERRA-2 products.
4.1 Inversion results
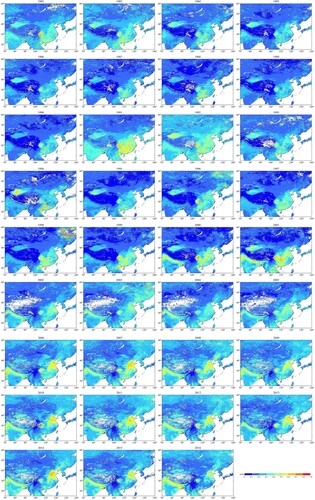
The annual mean of AVHRR-retrieved AOD maps from 1982 to 2016 is shown in . It can be seen that AOD increased significantly after 2000, which is closely related to China's economic development. After 2013, there was an obvious decline. The Chinese government implemented the air cleaning plan in 2013, which made a significant improvement (Chen et al. Citation2018). We can see that the AOD in North China, East China, and South China, Sichuan Basin, and Taklimakan Desert has an obvious high value. This is basically consistent with the research results of Filonchyk et al. (Citation2019).
Figure 4. The annual mean of AVHRR-retrieved AOD over the study region from 1982 to 2016.
4.2 Validation by ground-based sites
The ground-based sites we used for validation are illustrated in . The AERONET AOD products selected that are recorded during the study period in the research area are Level 1.5 (select Level 2.0 data if it exists. Level 1.5 product is cloud screened and Level 2.0 is cloud cleared and quality controls) and CARSNET AOD data are all from 2008. To evaluate our algorithm results, we used the correlation coefficient (R), root-mean-square error (RMSE), mean absolute error (MAE), and expect error (EE) index.
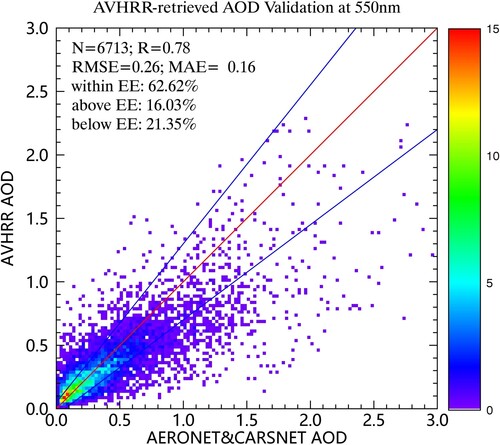
The time and space matching of AOD of the ground-based site and AVHRR inversion were carried out: AERONET and CARSNET AOD were averaged within ±30 min of the satellite observation time, and the AVHRR-derived AODs were averaged at a 25 × 25 km spatial box centered on the ground-based stations. shows the scatter diagram of AOD matching results of the satellite-retrieved and two ground-based observation networks. The two blue lines indicate EE of ± (0.05 + 0.25τ) following the comparison of AVHRRDB V001 dataset with AERONET observations over land (Hsu et al. Citation2017). The red one is the standard line y = x. As shown in , the correlation between AVHRR AOD retrieved in this paper and ground measurement AOD is 0.78. With all matched 6713 points, 62.62% points are within EE envelope, 21.35% points are below EE and 16.03% points are above EE, indicating a trend of underestimation which is similar to the results of AVHRRDB in this study area (Che et al. Citation2018; Mei et al. Citation2019). We think that this may be the system error from the red channel measurements. Since the algorithm results are more overestimated when AOD is low, and more seriously, there are more underestimates when AOD is high, the algorithm has a little high RMSE of 0.26 and MAE of 0.16. However, we surprisingly found that there was no significant difference in the EE index from year to year, which indicated that the algorithm was independent and stable in time. In particular, the validation results of 55 ground observations in mainland China showed that 63.31% points are within EE, with RMSE = 0.26 and MAE = 0.17. This is similar to the results verified by all sites (63 sites in total) in the entire study area. Compared with the performance of AVHRRDB AOD over mainland China which has less than 55% of the points within EE lines and RMSE greater than 0.25 (Che et al. Citation2018; Mei et al. Citation2019), this algorithm result has more percentage points falling in EE and smaller RMSE.
Figure 5. Scatter plot of 550 nm AVHRR-retrieved AOD against AERONET&CARSNET AOD. The colour bar on the right side is the number of matched points for each square at dx = 0.025 and dy = 0.025 in the scatter diagram panel.
4.3 Comparison with AVHRRDB and MERRA-2 products
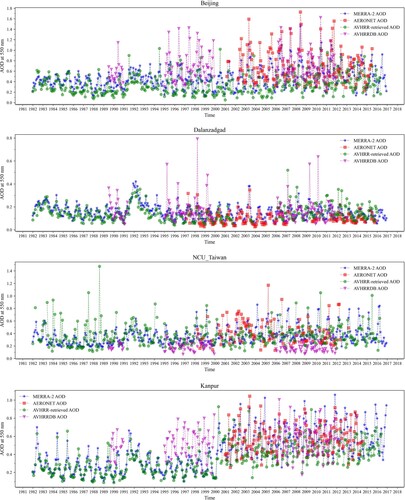
Due to the paucity of ground site data for the results prior to 1997, we compared MERRA-2, AVHRRDB, and AVHRR-retrieved AOD for a wide time range in order to confirm their accuracy and rationality. Four AERONET station locations are selected, Beijing, Dalanzadgad, NCU_Taiwan, and Kanpur. shows monthly mean variations of AVHRR-retrieved AOD, AVHRRDB AOD, MERRA-2 AOD, and AERONET AOD at selected AERONET stations. In Beijing and Kanpur sites, the variation tendency of AVHRR-retrieved AODs before 2000 is basically the same as MERRA-2 AODs, and the results of AVHRRDB are relatively high. However, AVHRR-retrieved AOD after 2000 is relatively low compared with the other three products. In the Dalanzadgad site, the four datasets have good consistency in time, while AVHRRDB results have obvious overestimation in some months. In NCU_Taiwan site, 1982-1989, the spectrum of AVHRR-retrieved AOD is higher in some months compared to MERRA-2 AOD. Results after 2000 show that AVHRRDB results are mostly underestimated. Overall, AVHRR-retrieved AOD has a good performance in the time series.
Figure 6. Monthly mean variations of AVHRR-retrieved AOD, AVHRRDB AOD, MERRA-2 AOD and AERONET AOD at 550nm at Beijing, Dalanzadgad NCU_Taiwan and Kanpur. AVHRR and MERRA-2 results used the monthly AOD mean of 1° × 1° centred at AERONET sites.
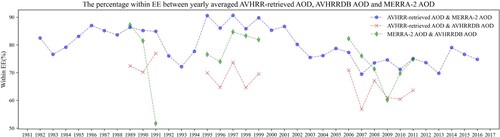
To verify the robustness of the algorithm, we have made the following analysis on the annual mean of AVHRRDB AOD, MERRA-2 AOD, and AVHRR-retrieved AOD: (1) We have compared the correlation of annual mean AOD of the three products in the study region. As shown in , the correlation coefficient of AOD in almost all years is greater than 0.5, and there is a good correlation between MERRA-2 and AVHRR AOD in the whole time, and MERRA-2 and AVHRRDB AOD also show a good relationship, especially from 2006 to 2010. However, AVHRRDB and AVHRR AOD show a relatively low correlation. (2) We have calculated the percentage of annual averaged AOD falling in EE lines for each of the two products. AVHRR-retrieved results and AVHRRDB AOD are consistent with MERRA-2 AOD with 80.01% and 75.36% percentage within EE as shown in . We also found that the consistency between AVHRRDB AOD and AVHRR-retrieved AOD is low, and only 67.29% of points are within EE. Affected by factors such as the coverage of algorithm results and the existence of clouds, the above comparison is uncertain. However, it still shows the rationality and robustness of the algorithm in time on the whole.
Figure 7. The interannual correlation coefficient between AVHRR AOD, AVHRRDB AOD and MERRA-2 AOD at 550 nm.
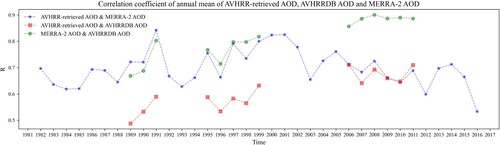
Figure 8. The percentage within the uncertainty of Δτ = ± (0.05 + 0.25τ) between AVHRR-retrieved AOD, AVHRRDB AOD and MERRA-2 AOD at 550 nm on the yearly scale.
6. Discussions and conclusions
Atmospheric aerosols not only cause environmental pollution, but also affect the earth's climate. To obtain long-term AOD from AVHRR GAC data over land, the manuscript presents a new algorithm based on assumptions that aerosol in the design window has the same AOD and the land surface property doesn’t change in two days. The algorithm uses Li-Qin model to simulate the solar radiation received by the satellite, and the RTLS model and BRDF shape generated from MODIS BRDF/albedo product are used to simulate the surface BRDF effect. In addition, the stability of BRDF shape over a long period is also confirmed. The aerosol model defined in the MODIS DT algorithm is used in this paper. Finally, the AODs of AVHRR were obtained through an iteration process with the OE method.
The algorithm results were evaluated by comparison with the ground-based AERONET and CARSNET measurements, and crossly compared AVHRRDB and MERRA-2 products. The validation with AERONET and CARSNET shows that the algorithm has high accuracy. Moreover, there is a good correlation between AVHRR AOD and MERRA-2 AOD over a long time, and it also shows a certain correlation with AVHRRDB AOD, which illustrates the algorithm has good stability and certain accuracy over a long time. However, the algorithm presents a certain underestimation as a whole.
This long-term historic AOD records can be used to research the climate and environmental changes, especially before 2000. The data recording may also be used to reconstruct the historical mass concentration of fine particles (PM2.5) and support environmental assessment and pollution prevention and control (Zhang et al. Citation2021). Moreover, the importance algorithm proposed in the manuscript and the AOD data set are reflected in the monitoring of atmospheric quality, helping to predict atmospheric changes, providing recommendations for atmospheric environment improvement, ensuring people's healthy lives, promoting the sustainability of urban development, which could contribute to the achievement of the United Nations Sustainable Development Goals (Varotsos and Cracknell Citation2020; Kulmala et al. Citation2021).
The future study still needs to address several issues. First, atmosphere composition has been changing for more than 30 years, and more adequate aerosol types should be considered. Second, although the BRDF shape generated by the MCD43C1 product is stable in the long-term, it is necessary to evaluate the error of using the BRDF shape as prior information for retrieving AOD before 2000. Third, since the early data lack real values to verify, a more convincing method is needed to evaluate the accuracy of data before 2000. In addition, the algorithm can be applied to AVHRR observation twice per day to improve coverage. In the future, we will focus on the above aspects, evaluate surface reflectance results and attempt to retrieve AOD on a global scale.
Acknowledgements
The study was partly supported by the National Natural Science Foundation of China (NSFC) under Grant 41871260. We thank the contributors and supporters of the datasets used in the study, including AVHRR GAC data, MODIS products, AVHRRDB data, MERRA-2 AOD product, and ground-based station observations of AERONET and CARSNET.
Disclosure statement
No potential conflict of interest was reported by the author(s).
Additional information
Funding
References
- Aldabash, Midyan, Filiz Bektas Balcik, and Paul Glantz. 2020. “Validation of MODIS C6.1 and MERRA-2 AOD Using AERONET Observations: A Comparative Study Over Turkey.” Atmosphere 11 (9), doi:10.3390/atmos11090905.
- Charlson, Robert J. 1969. “Atmospheric Visibility Related to Aerosol Mass Concentration.” Environmental Science and Technology 3 (10): 913–918. doi:10.1021/es60033a002.
- Che, Yahui, Yong Xue, Jie Guang, Lu She, and Jianping Guo. 2018. “Evaluation of the AVHRR DeepBlue Aerosol Optical Depth Dataset Over Mainland China.” ISPRS Journal of Photogrammetry and Remote Sensing 146: 74–90. doi:10.1016/j.isprsjprs.2018.09.004.
- Che, Huizheng, Leiku Yang, Chao Liu, Xiangao Xia, Yaqiang Wang, Hong Wang, Han Wang, Xiaofeng Lu, and Xiaoye Zhang. 2019. “Long-term Validation of MODIS C6 and C6.1 Dark Target Aerosol Products Over China Using CARSNET and AERONET.” Chemosphere 236: 124268. doi:10.1016/j.chemosphere.2019.06.238.
- Chen, Liangfu, Minghui Tao, Zifeng Wang, Jinhua Tao, Chao Yu, Ying Zhang, Meng Fan, Jinabin Gu, and Lin Su. 2018. “Satellite Rrecord of the Transition of Air Quality Over China.” Big Earth Data 2 (2): 190–196. doi:10.1080/20964471.2018.1514818.
- Filonchyk, Mikalai, Haowen Yan, Zhongrong Zhang, Shuwen Yang, Wei Li, and Yanming Li. 2019. “Combined Use of Satellite and Surface Observations to Study Aerosol Optical Depth in Different Regions of China.” Scientific Reports 9 (1): 6174. doi:10.1038/s41598-019-42466-6.
- Galford, Gillian L., John F. Mustard, Jerry Melillo, Aline Gendrin, Carlos C. Cerri, and Carlos E. P. Cerri. 2008. “Wavelet Analysis of MODIS Time Series to Detect Expansion and Intensification of Row-Crop Agriculture in Brazil.” Remote Sensing of Environment 112 (2): 576–587. doi:10.1016/j.rse.2007.05.017.
- Gao, Ling, Lin Chen, Jun Li, Andrew K. Heidinger, Xiaofeng Xu, and Shiguang Qin. 2019. “A Long-Term Historical Aerosol Optical Depth Data Record (1982–2011) Over China from AVHRR.” IEEE Transactions on Geoscience and Remote Sensing 57 (5): 2467–2480. doi:10.1109/tgrs.2018.2873944.
- Gao, Ling, Jun Li, Lin Chen, Liyang Zhang, and Andrew K. Heidinger. 2016. “Retrieval and Validation of Atmospheric Aerosol Optical Depth From AVHRR Over China.” IEEE Transactions on Geoscience and Remote Sensing 54 (11): 6280–6291. doi:10.1109/tgrs.2016.2574756.
- Govaerts, Y. M., S. Wagner, A. Lattanzio, and P. Watts. 2010. “Joint Retrieval of Surface Reflectance and Aerosol Optical Depth from MSG/SEVIRI Observations With an Optimal Estimation Approach: 1. Theory.” Journal of Geophysical Research 115 (D2), doi:10.1029/2009jd011779.
- Grobler, Trienko L, Etienne R Ackermann, Augustinus J van Zyl, Waldo Kleynhans, Brian P Salmon, and Jan C Olivier. 2012. “Sequential Classification of MODIS Time Series.” 2012 IEEE International Geoscience and Remote Sensing Symposium 6236–6239. doi:10.1109/IGARSS.2012.6352683.
- Hauser, A., D. Oesch, N. Foppa, and S. Wunderle. 2005. “NOAA AVHRR Derived Aerosol Optical Depth Over Land.” Journal of Geophysical Research-Atmospheres 110 (D8), doi:10.1029/2004jd005439.
- He, Tao, Shunlin Liang, Dongdong Wang, Hongyi Wu, Yunyue Yu, and Jindi Wang. 2012. “Estimation of Surface Albedo and Directional Reflectance from Moderate Resolution Imaging Spectroradiometer (MODIS) Observations.” Remote Sensing of Environment 119: 286–300. doi:10.1016/j.rse.2012.01.004.
- Hsu, N. C., M. J. Jeong, C. Bettenhausen, A. M. Sayer, R. Hansell, C. S. Seftor, J. Huang, and S. C. Tsay. 2013. “Enhanced Deep Blue Aerosol Retrieval Algorithm: The Second Generation.” Journal of Geophysical Research: Atmospheres 118 (16): 9296–9315. doi:10.1002/jgrd.50712.
- Hsu, N. C., J. Lee, A. M. Sayer, and N. Carletta. 2017. “Retrieving Near-Global Aerosol Loading Over Land and Ocean from AVHRR.” Journal of Geophysical Research: Atmospheres 122 (18): 9968–9989. doi:10.1002/2017JD026932.
- Hsu, N. C., Tsay Si-Chee, M. D. King, and J. R. Herman. 2004. “Aerosol Properties Over Bright-Reflecting Source Regions.” IEEE Transactions on Geoscience and Remote Sensing 42 (3): 557–569. doi:10.1109/tgrs.2004.824067.
- Jiang, Liyuan, Yong Ma, Fu Chen, Jianbo Liu, Wutao Yao, and Erping Shang. 2021. “Automatic High-Accuracy Sea Ice Mapping in the Arctic Using MODIS Data.” Remote Sensing 13 (4), doi:10.3390/rs13040550.
- Kaufman, Y. J., D. Tanré, and O. Boucher. 2002. “A Satellite View of Aerosols in the Climate System.” Nature 419 (6903): 215–223. doi:10.1038/nature01091.
- Kaufman, Y. J., D. Tanré, L. A. Remer, E. F. Vermote, A. Chu, and B. N. Holben. 1997. “Operational Remote Sensing of Tropospheric Aerosol Over Land from EOS Moderate Resolution Imaging Spectroradiometer.” Journal of Geophysical Research: Atmospheres 102 (D14): 17051–17067. doi:10.1029/96jd03988.
- Kulmala, M., A. Lintunen, I. Ylivinkka, J. Mukkala, R. Rantanen, J. Kujansuu, T. Petj, and H. K. Lappalainen. 2021. “Atmospheric and Ecosystem Big Data Providing Key Contributions in Reaching United Nations'Sustainable Development Goals.” Big Earth Data 5 (3): 277–305. doi:10.1080/20964471.2021.1936943.
- Levy, Robert C., Lorraine A. Remer, and Oleg Dubovik. 2007. “Global Aerosol Optical Properties and Application to Moderate Resolution Imaging Spectroradiometer Aerosol Retrieval Over Land.” Journal of Geophysical Research: Atmospheres 112 (D13), doi:10.1029/2006jd007815.
- Levy, Robert C., Lorraine A. Remer, Shana Mattoo, Eric F. Vermote, and Yoram J. Kaufman. 2007. “Second-Generation Operational Algorithm: Retrieval of Aerosol Properties Over Land from Inversion of Moderate Resolution Imaging Spectroradiometer Spectral Reflectance.” Journal of Geophysical Research: Atmospheres 112 (D13), doi:10.1029/2006jd007811.
- Li, Fuqin, David L. B. Jupp, Matt Paget, Peter R. Briggs, Medhavy Thankappan, Adam Lewis, and Alex Held. 2017. “Improving BRDF Normalisation for Landsat Data Using Statistical Relationships Between MODIS BRDF Shape and Vegetation Structure in the Australian Continent.” Remote Sensing of Environment 195: 275–296. doi:10.1016/j.rse.2017.03.032.
- Li, Ruibo, Lin Sun, Huiyong Yu, Jing Wei, and Xinpeng Tian. 2021. “An Improved DDV Algorithm for the Retrieval of Aerosol Optical Depth from NOAA/AVHRR Data.” Journal of the Indian Society of Remote Sensing 49 (5): 1141–1152. doi:10.1007/s12524-020-01301-6.
- Li, Xiaowen, Jindi Wang, Baoxin Hu, Wenge Ni, A. Strahler, and C. Woodcock. 1996. “Path Scattering of Light in the Dielectric Layer and Multiple Rebounds on the Underlying Surface.” Scientia Sinica(Technologica) 26 (5): 457–466.
- Li, Chi, Yong Xue, Quanhua Liu, Jie Guang, Xinwei He, Jiahua Zhang, Tingkai Wang, and Xinjie Liu. 2014. “Post Calibration of Channels 1 and 2 of Long-Term AVHRR Data Record Based on SeaWiFS Data and Pseudo-Invariant Targets.” Remote Sensing of Environment 150: 104–119. doi:10.1016/j.rse.2014.04.020.
- McGuinn, L. A., C. K. Ward-Caviness, L. M. Neas, A. Schneider, D. Diaz-Sanchez, W. E. Cascio, W. E. Kraus, et al. 2016. “Association Between Satellite-Based Estimates of Long-Term PM2.5 Exposure and Coronary Artery Disease.” Environmental Research 145: 9–17. doi:10.1016/j.envres.2015.10.026.
- Mei, Linlu, Chuanxu Zhao, Gerrit Leeuw, John P. Burrows, Vladimir Rozanov, HuiZheng Che, Marco Vountas, Annette Ladstätter-Weißenmayer, and Xiaoye Zhang. 2019. “A Critical Evaluation of Deep Blue Algorithm Derived AVHRR Aerosol Product Over China.” Journal of Geophysical Research: Atmospheres 124 (22): 12173–12193. doi:10.1029/2018jd029929.
- Molling, Christine C., Andrew K. Heidinger, William C. Straka, and Xiangqian Wu. 2010. “Calibrations for AVHRR Channels 1 and 2: Review and Path Towards Consensus.” International Journal of Remote Sensing 31 (24): 6519–6540. doi:10.1080/01431161.2010.496473.
- Moses, E Emetere, and M. L. Akinyemi. 2017. “A Short Review on the Effects of Aerosols on Visibility Impairment.” Journal of Physics: Conference Series 852), doi:10.1088/1742-6596/852/1/012006.
- Myhre, Gunnar, Maria M. Kvalevåg, and Crystal B. Schaaf. 2005. “Radiative Forcing due to Anthropogenic Vegetation Change Based on MODIS Surface Albedo Data.” Geophysical Research Letters 32 (21), doi:10.1029/2005gl024004.
- Natsagdorj, Enkhjargal, Tsolmon Renchin, Philippe De Maeyer, and Bayanjargal Darkhijav. 2021. “Spatial Distribution of Soil Moisture in Mongolia Using SMAP and MODIS Satellite Data: A Time Series Model (2010–2025).” Remote Sensing 13: 3. doi:10.3390/rs13030347.
- Qin, Wenhan, Jay R. Herman, and Ziauddin Ahmad. 2001. “A Fast, Accurate Algorithm to Account for Non-Lambertian Surface Effects on TOA Radiance.” Journal of Geophysical Research: Atmospheres 106 (D19): 22671–22684. doi:10.1029/2001jd900215.
- Schaaf, Crystal B, Feng Gao, Alan H Strahler, Wolfgang Lucht, Xiaowen Li, Trevor Tsang, Nicholas C Strugnell, Xiaoyang Zhang, Yufang Jin, and Jan-Peter Muller. 2002. “First Operational BRDF, Albedo Nadir Reflectance Products from MODIS.” Remote Sensing of Environment 83 (1-2): 135–148. doi:10.1016/S0034-4257(02)00091-3.
- She, Lu, Yong Xue, Xihua Yang, John Leys, Jie Guang, Yahui Che, Cheng Fan, Yanqing Xie, and Ying Li. 2019. “Joint Retrieval of Aerosol Optical Depth and Surface Reflectance Over Land Using Geostationary Satellite Data.” IEEE Transactions on Geoscience and Remote Sensing 57 (3): 1489–1501. doi:10.1109/tgrs.2018.2867000.
- Strahler, Alan. 1999. “MODIS Land Cover Product Algorithm Theoretical Basis Document (ATBD) Version 5.0.” http://modis.gsfc.nasa.gov/data/atbd/atbd_mod12.pdf.
- Takemata, K., H. Fukui, and Y. Kawata. 2006. “Retrieval of Aerosol Optical Thickness Over Land Using NOAA/AVHRR Data.” Advances in Space Research 38 (10): 2208–2211. doi:10.1016/j.asr.2006.03.042.
- Tian, Xiaoqing, Ling Gao, Jun Li, Lin Chen, Jingjing Ren, and Chengcai Li. 2022. “Retrieval of Atmospheric Aerosol Optical Depth from AVHRR Over Land with Global Coverage Using Machine Learning Method.” IEEE Transactions on Geoscience and Remote Sensing 60, doi:10.1109/tgrs.2021.3129853.
- Tie, Xuexi, Dui Wu, and Guy Brasseur. 2009. “Lung Cancer Mortality and Exposure to Atmospheric Aerosol Particles in Guangzhou, China.” Atmospheric Environment 43 (14): 2375–2377. doi:10.1016/j.atmosenv.2009.01.036.
- Twomey, Sean. 1977. “The Influence of Pollution on the Shortwave Albedo of Clouds.” Journal of the Atmospheric Sciences 34 (7): 1149–1152. doi:10.1175/1520-0469(1977)0342.0.CO;2.
- Varotsos, Costas A., and Arthur P. Cracknell. 2020. “Remote Sensing Letters Contribution to the Success of the Sustainable Development Goals - UN 2030 Agenda.” Remote Sensing Letters 11 (8): 715–719. doi:10.1080/2150704X.2020.1753338.
- Verma, Sunita, Divya Prakash, Atul Kumar Srivastava, and Swagata Payra. 2017. “Radiative Forcing Estimation of Aerosols at an Urban Site Near the Thar Desert Using Ground-Based Remote Sensing Measurements.” Aerosol and Air Quality Research 17 (5): 1294–1304. doi:10.4209/aaqr.2016.09.0424.
- Wagner, S. C., Y. M. Govaerts, and A. Lattanzio. 2010. “Joint Retrieval of Surface Reflectance and Aerosol Optical Depth from MSG/SEVIRI Observations with an Optimal Estimation Approach: 2. Implementation and Evaluation.” Journal of Geophysical Research 115 (D2), doi:10.1029/2009jd011780.
- Wang, Ying, Xingfa Gu, Jian Li, and Xiaofei Mi. 2021. “A Dual-Channel Aerosol Optical Depth Retrieval Algorithm Incorporating the BRDF Effect from AVHRR Over Eastern Asia.” Remote Sensing 13 (3), doi:10.3390/rs13030365.
- Wanner, Wolfgang, X. Li, and A. H. Strahler. 1995. “On the Derivation of Kernels for Kernel-Driven Models of Bidirectional Reflectance.” Journal of Geophysical Research: Atmospheres 100 (D10): 21077–21089. doi:10.1029/95JD02371.
- Wei, Xiaoli, Ni-Bin Chang, Kaixu Bai, and Wei Gao. 2019b. “Satellite Remote Sensing of Aerosol Optical Depth: Advances, Challenges, and Perspectives.” Critical Reviews in Environmental Science and Technology 50 (16): 1640–1725. doi:10.1080/10643389.2019.1665944.
- Wei, Jing, Zhanqing Li, Yiran Peng, and Lin Sun. 2019a. “MODIS Collection 6.1 Aerosol Optical Depth Products Over Land and Ocean: Validation and Comparison.” Atmospheric Environment 201: 428–440. doi:10.1016/j.atmosenv.2018.12.004.
- Xie, Yong, Yan Zhang, Xiaoxiong Xiong, John J. Qu, and Huizheng Che. 2011. “Validation of MODIS Aerosol Optical Depth Product Over China Using CARSNET Measurements.” Atmospheric Environment 45 (33): 5970–5978. doi:10.1016/j.atmosenv.2011.08.002.
- Xue, Yong, Xingwei He, Gerrit de Leeuw, Linlu Mei, Yahui Che, Wayne Rippin, Jie Guang, and Yincui Hu. 2017. “Long-Time Series Aerosol Optical Depth Retrieval from AVHRR Data Over Land in North China and Central Europe.” Remote Sensing of Environment 198: 471–489. doi:10.1016/j.rse.2017.06.036.
- Zhang, Ying, Zhengqiang Li, Yuanyuan Wei, and Zongren Peng. 2021. “A Satellite-Derived, Ground-Measurement-Independent Monthly PM2.5 Mass Concentration Dataset Over China During 2000–2015.” Big Earth Data, doi:10.1080/20964471.2021.1918908.
- Zhang, Taixin, Lin Zang, Feiyue Mao, Youchuan Wan, and Yannian Zhu. 2020. “Evaluation of Himawari-8/AHI, MERRA-2, and CAMS Aerosol Products Over China.” Remote Sensing 12 (10), doi:10.3390/rs12101684.
- Zhao, Tom X. P. 2004. “Regional Evaluation of an Advanced Very High Resolution Radiometer (AVHRR) Two-Channel Aerosol Retrieval Algorithm.” Journal of Geophysical Research 109 (D2), doi:10.1029/2003jd003817.
- Zhao, Tom X. P., Istvan Laszlo, Wei Guo, Andrew Heidinger, Changyong Cao, Aleksandar Jelenak, Dan Tarpley, and Jerry Sullivan. 2008. “Study of Long-Term Trend in Aerosol Optical Thickness Observed from Operational AVHRR Satellite Instrument.” Journal of Geophysical Research 113 (D7), doi:10.1029/2007jd009061.
- Zhao, T. X. P., Larry L. Stowe, Alexander Smirnov, and David Crosby. 2002. “Development of a Global Validation Package for Satellite Oceanic Aerosol Optical Thickness Retrieval Based on AERONET Observations and Its Application to NOAA/NESDIS Operational Aerosol Retrievals.” Journal of the Atmospheric Sciences 59 (3): 294–312. doi:10.1175/1520-0469(2002)0592.0.CO;2.