
ABSTRACT
The rapid decline of Arctic sea ice has been reminding us the significant impacts caused by global warming. However, the other side of the coin is that this opens a window to utilize the Arctic sea routes in the summer seasons, bringing remarkable economic benefits for ocean transportation between Asia and Europe. However, commercial vessels with low ice classes must tackle substantial environmental challenges in the Arctic sea routes, particularly those caused by variable sea ice, even in the melting seasons. Therefore, the science-based support for shipping safety in the Arctic sea routes is being given more prominence. Emerging satellite remote sensing technology plays a critical role in environmental monitoring in the Arctic. This paper reviews state-of-the-art satellite observations on monitoring sea ice and potential applications on supporting shipping activities in the Arctic Ocean. Moreover, we introduced a recently developed system based on satellite observations to support the safe transportation of Chinese cargo vessels in the Arctic northern sea route, demonstrating the efforts by both the science and business communities to promote the development of the polar silk road.
1. Introduction
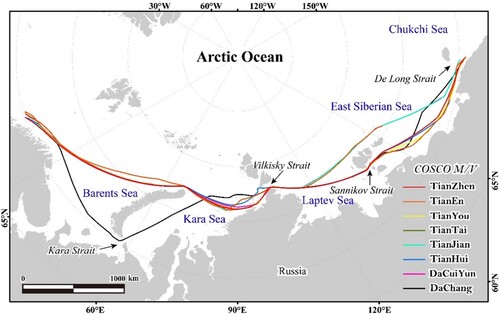
Along with an increasing number of ships utilizing the northeast passage (NEP) or called the northern sea route (NSR) in the Arctic, cargo vessels from the largest shipping line in China, the China Ocean Shipping Company (COSCO), have been sailing through the route in the summer seasons for 56 voyages from 2013 to 2021. presents the routes of eight COSCO vessels transported in the NSR in 2021. The White Paper ‘China's Arctic Policy’ released in 2018 outlines the vision ‘will bring opportunities for parties concerned to jointly build a ‘Polar Silk Road’, and facilitate connectivity and sustainable economic and social development of the Arctic’.
Figure 1. The routes of the COSCO cargo vessels sailing through the NSR in 2021.
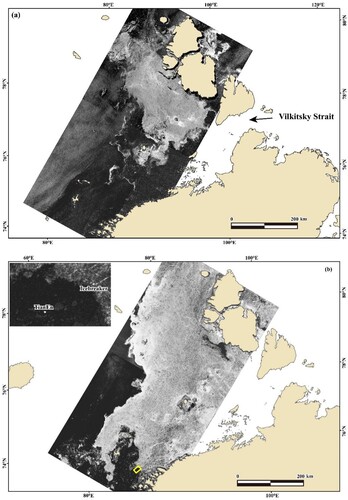
Remote sensing satellites, flying at high altitudes of a few hundred kilometers above the earth, are like rays of light illuminating routes in the Arctic water to assist safety shipping at both strategic and tactical levels. However, even under the scenario of a rapid decline of sea ice in the Arctic, ships still face risks and challenges of multivariant sea ice conditions. The spaceborne synthetic aperture radar (SAR), Sentinel-1 (S1), operated by the European Space Agency (ESA) presents that the route through the Vilkisky strait, a key waterway in the NSR, had been opened on 21 July 2020 ((a)). In contrast, on the same day in 2021, the strait was fully covered by sea ice ((b)), and therefore, the COSCO cargo vessel TianEn (the bright spot seen in the SAR sub-image in the upper-left panel of (b)) had to follow an icebreaker to pass the strait.
Figure 2. Variant sea ice state was observed by S1 SAR (Horizontal-Vertical polarization) over the Vilkisky Strait, a key waterway in the NSR, on 21 July 2020 at 01:36 UTC (a) and on 21 July 2021 at 01:35 UTC (b). The radar backscatter values for sea ice are high (off-white) and those for seawater are very low (black). The yellow rectangle in the lower panel figure represents the COSCO cargo vessel blocked by sea ice in the Vilkisky Strait.
The observed and projected annual mean air temperature reveals the Arctic is warming approximately twice the global average (Overland, Dunlea, and Box Citation2019), leading to the extensive shrinking of sea ice extent by 43% between 1979 and 2019 (Arctic Climate Change Update Citation2021: Key Trends and Impacts). Although existing uncertainties in simulating sea ice extent, the CMIP6 simulations show that the Arctic is likely to be practically ice-free in September at least once before 2050 in all scenarios assessed (Notz, and SIMIP Community Citation2020).
Melting of ice and snow in the Arctic Ocean, on the one hand, induces direct and indirect impacts on the regional and global environment and climate, e.g. sea-ice albedo feedback (Thackeray and Hall Citation2019), sea level rising (Jenkins and Holland Citation2007), atmosphere and ocean circulation (Chylek et al. Citation2009; Simmonds and Keay Citation2009). On the other hand, it allows vessels to use the Arctic sea routes to connect Asia with Europe and America to enhance economic development (Laulajainen Citation2009). The NSR stretches approximately 2800 kilometers along the Russian Arctic coast from Novaya Zemlya to the Bering Strait. Compared with the more commonly used shipping route via the Suez Canal, connecting Asia and Europe, the NSR route is one-third of the distance shorter, meaning less travel time and lower fuel consumption and costs.
The Russians started to explore the NSR route in the first half of the seventeenth Century (Russian Pomors and Cossacks). Till the nineteenth Century, the Swedish scientist Nordenskiöld onboard Vega sailed the entire NSR (from Atlantic to Pacific) for the first time. However, over a long time, the NSR was generally utilized for intra-Arctic trading within the Eurasian instead of being a major trade route for trans-Arctic transport. In August and September 2009, two German mechanical vessels completed commercial shipping from Asia to Europe through the NSR for the first time. In 2013, the cargo vessel YongSheng, operated by the COSCO, completed her maiden voyage through the NSR (Zhao and Hu Citation2016), which also started the history of Chinese commercial utilization of the Arctic shipping route. Since then, the COSCO has been continuously sending cargo vessels through the NSR in the summer seasons.
A recent investigation reports that the number of ships entering the Arctic Polar Code Area (Sakhuja Citation2014) has increased by 25% from 2013 to 2019, and the distance sailed by bulk carriers has risen by 160% (Protection of the Arctic Marine Environment Citation2022). Under the scenario of climate change and the rapidly receding sea ice, in addition to the findings of expansive natural resources, the NSR may gradually rival the route connecting Europe and Asia via the Suez Canal. In particular, the obstruction of the Suez Canal by a container ship for a week in March 2021 significantly disrupted the global trade, revealing the importance of an alternative shipping route.
Although commercial shipping via the NSR is attractive, some significant risks, if just considered from operative perspectives, such as hazards to navigation, limited or even non-existed rescue services, lack of weather observation and forecast in high quality, reduced communication capabilities at high latitudes, and even inconsistent nautical charts, are still the challenges to be faced (Hill, LaNore, and Véronneau Citation2015), which co-exist with those beneficial opportunities. Adverse weather and severe sea are always significant threats to maritime transportation (Bitner-Gregerse, Soares, and Vantorre Citation2016), which is also the case in the Arctic water. Particularly along with the variation of marginal ice zone (MIZ) (Strong and Rigor Citation2013), more high waves are observed in the Arctic Ocean (Waseda et al. Citation2018), which is because the retreat of sea ice leads to increased wind fetch for the development of ocean waves. The wind is one of the most prevalent forces against safe navigation, particularly in the narrow, shallow straits of the NSR; for instance, the Vilkitsky Strait (referring to ) is only 8 km wide at its narrowest point, and there are a number of shallows with water depth less than 10 m. The dense fog, which significantly reduces visibility (Panahi et al. Citation2020), together with windy conditions and drifting ice, are significant threats for safe sailing through the straits in the NSR. Therefore, it is crucial for navigation in the Arctic waters to access synoptic environmental observations of the weather, sea ice, and ocean conditions.
Observation from space is an effective and efficient manner to obtain environmental information to assist ships sailing in the Arctic, where wild weather is a significant obstacle to in situ observations. Attempts to monitor sea ice from space started from airborne remote sensing techniques (Johannessen et al. Citation2006), e.g. aerial photography, side-looking radar, and infrared radiometers. Since originating approximately in the sixties of the twentieth Century, civil spaceborne remote sensing techniques have gradually become an indispensable component of observation networks of polar regions. Some literature has summarized the progress on science and technology developments in remote sensing of polar environments, particularly sea ice, which is an attractive topic for the remote sensing community. In this paper, we emphasize reviewing state-of-the-art methods, technologies, and systems of polar remote sensing, which are closely related to applications support for shipping in the NEP or the NSR.
Section 2 reviews investigations on combining satellite observations and assessment models to evaluate the feasibility of NSR in the Arctic. While microwave radiometer has been widely used to observe Sea ice concentration (SIC), this section focuses on their applications in such evaluations. These studies provide sound scientific evidence for policy-making on the utilization of the Arctic waterway at a strategic level. However, shipping in the Arctic routes, we are facing more challenges at the tactical level. Sea ice in the MIZ often presents significant variations in synoptic and local scales (even in the sub-kilometer scale). On the other hand, major Arctic shipping routes pass the MIZ. Therefore, sea ice observation from space in high spatial resolution is highly desired to support shipping safety in reality. SAR has demonstrated its capability of monitoring sea ice in both fine resolution and large scale, as examples shown in . Therefore, Section 3 reviews recently developed techniques and methods that significantly improve the applicability of SAR for monitoring sea ice in polar regions. In prospect of the increasingly important role of satellite remote sensing in Arctic navigation, a system based on SAR and multi-source data has successfully served COSCO vessels sailing through the NSR for the past three years, as demonstrated in Section 4.
The review aims to demonstrate the great potential of facilitating the application of remote sensing techniques for Arctic transportation, infrastructure construction, and resources exploration, and hopefully, it has a broad audience of the remote sensing community, industry stakeholders, and policymakers.
2. Evaluation of the feasibility of NSR by satellite observations
Both the experiences learned from the realities of sailing in the Arctic waters and scientific analysis based on risk assessment models suggest that sea ice is still the most significant threat to ships sailing in the NSR (Smith and Stephenson Citation2013; Baksh et al. Citation2018). SIC or sea ice extent (SIE) and thickness (SIT) are treated as critical factors for the evaluation of shipping feasibility, route planning, operational speed, and usage of icebreakers (Wang et al. Citation2021).
Passive microwave radiometers are capable of mapping daily ice distributions under all weather conditions. Furthermore, more importantly, due to a relatively low spatial resolution (a few kilometers to tens of kilometers), microwave radiometers generally have large spatial coverage (up to 1700km) and can cover the full polar regions in a short term. Therefore, SIC by microwave radiometer has been the most reliable sea-ice dataset from space, available for more than 40 years. Sea ice typically emits more microwave energy than liquid water in the ocean due to its physical properties, such as atomic composition and crystalline structure. Thus, the passive microwave radiometer can distinguish sea ice from the ocean and then determines the SIC (Swift, Fedor, and Ramseier Citation1985). So far, the most extended time series of SIC data that reveal the reality of sea ice rapid decline in the Arctic are based on the observation of spaceborne radiometers. lists some representative spaceborne microwave radiometers that significantly contribute to the long-time series of SIC data in the polar regions.
Table 1. Available SIC data by spaceborne microwave radiometer remote sensing.
Some studies evaluate the feasibility of NEP or NSR based on microwave radiometer observation of SIC and SIT. Lei et al. (Citation2015) found that the spatially averaged open period in the NEP, defined by a 50% SIC threshold, is approximately doubled from the early 1980s (∼ 70 days) to the early 2010s (∼ 140 days). While these studies generally consider only sea ice condition as the critical factor for the evaluation of navigability in the NEP or NSR, Chen et al. (Citation2019) applied the Arctic Transport Accessibility Model (ATAM) for the analysis of navigation risk, which integrates both the radiometer-derived SIC and SIT information and vessel types. Therefore, their study provides value-added information for utilization of the NSR in reality by ship lines. Developed by incorporating experiences from the ATAM, the Polar Operational Limit Assessment Risk Indexing System (POLARIS) from the International Maritime Organization (IMO) provides a harmonized methodology for assessing navigation risks in ice-covered waters (ABS Citation2016; Stoddard et al. Citation2016). By applying the radiometer-derived SIC and the PIOMAS SIT dataset to the POLARIS, Cao et al. (Citation2022) analyze changes in navigability along trans-Arctic routes during the past four decades.
The general conclusion of the above-mentioned studies based on satellite-derived sea ice information is that the number of navigable days in the NSR has increased significantly in the recent ten years. However, the increasing tendency is not consistent throughout the route, showing distinct spatial variability. The Barents Sea and the Kara Sea have the most significant increase, whereas the Laptev Sea and the East Siberian Sea show distinct inter-annual variabilities, particularly in the Vilkitsky, the Sannikov, and the De Long Straits (referring to for their locations) (Li, Ci, and Luo Citation2015).
In our successive three-year efforts to support the COSCO vessels sailing through the NSR, it is also found that sea ice conditions in these key straits have significant spatial and temporal variations, as the example presented in . Therefore, despite all relevant studies suggesting that accessibility of the NSR under the sea ice retreating scenario is very optimistic, commercial ships with limited capability of breaking ice still face the great challenge of multivariant sea ice. Moreover, in our collaboration with the COSCO to support its transportation in the NSR in the past three years, the scientists, managers, and captains have all realized that spaceborne SAR, a unique radar system, yielding observations of sea ice states in high spatial resolution have a significant contribution to route optimization shipping through the NSR.
3. Satellite-based SAR for sea ice monitoring in the Arctic
SAR can achieve two-dimensional images in a high resolution independent of sunlight, cloud, and weather conditions (Moreira et al. Citation2013). It achieves high spatial resolution in the azimuth direction (i.e. flight direction of satellite) by synthesizing a large aperture (instead of a physical antenna) through the movement of a platform. The larger the aperture, the higher the image resolution is obtained. This is the most distinct advantage compared with another side look radar of real aperture radar. Since the launch of the SEASAT satellite carrying the first civil SAR sensor (Fu and Holt Citation1982), SAR has proven to be an ideal remote sensing technique for monitoring sea ice. It operates like a ray of light (although microwave is invisible to eyes) from space, illuminating the ice-cover polar regions even on nights and wild weather.
Some studies have detailed reviewed state-of-the-art of sea ice monitoring by spaceborne SAR (e.g. Dierking Citation2013); here only a brief review on the recent development of Arctic sea ice classification, in terms of discrimination of open water (OW) and sea ice, as well as classification of sea ice types by polarimetric SAR is provided. On the one hand, full- or dual-polarimetric SAR data are routinely acquired by modern satellites, e.g. Radarsat-2 and S1 in C-band, TerraSAR-X/TanDEM-X in X-band and ALOS/PALSAR in L-band, which have been widely exploited for sea ice detection in polar regions. On the other hand, determining edge and sea ice types in high spatial resolution is vital for optimizing ship routes in the Arctic water.
Generally, open water can present comparable radar backscatter intensity with sea ice in co-polarization (i.e. Vertical-Vertical, VV or Horizontal-Horizontal, HH), particularly on the wind-roughed sea surface. This is because the sea surface generally holds surface backscattering which is quite sensitive to co-polarized radar signals. However, radar backscatter of the sea surface is much lower than sea ice in cross-polarization (Vertical-Horizontal, VH or Horizontal-Vertical, HV), in which volume scattering is dominant. Therefore, generally, we can say that SAR data in cross-polarization are more competitive than that in co-polarization for discrimination of open water and sea ice (Zakhvatkina, Smirnov, and Bychkova Citation2019). However, the exception also exists. The strong contrast of radar backscatter between sea ice and open water in cross-polarization can be limited for thin ice with a smooth surface (Scheuchl et al. Citation2004; Johansson et al. Citation2018) or for open water under strong winds (Vachon and Wolfe Citation2011; Hwang et al. Citation2010). Nevertheless, the difference between co-polarization and cross-polarization data over open water has proven to be an optimal polarization combination for distinguishing sea ice and open water (Karvonen Citation2014; Tan et al. Citation2018).
Extensive studies have been conducted on discriminating between open water and sea ice by polarimetric SAR. Support Vector Machine (SVM) (Cortes and Vapnik Citation1995), as a popular two-class classification method, is widely applied for dual-polarization (HH and HV) data acquired by RADARSAT-2 (Zakhvatkina et al. Citation2017) and by S1 (Hong and Yang Citation2018) to discriminate open water and sea ice, with accuracy higher than 90%, even by using only the cross-polarization channel data (Zheng, Li, and Ren Citation2018; Li, Sun, and Zhang Citation2021). A recent study by Wang and Li (Citation2021) proposes a more robust method of detecting sea ice cover by S1 dual-polarization data based on a deep learning network of U-Net (Ronneberger, Fischer, and Brox Citation2015); Moreover, it integrates several U-Nets to cope with multivariant sea ice conditions in the Arctic. (a) presents the diagram of the designed algorithm. The input data to the process are denoised HH and HV data (Sun and Li Citation2021) of S1 SAR, which produce the false-color composite images (i.e. HV for the red channel, HH-HV for the green channel, and HH/HV for the blue channel). One example of such false-color composite images is shown in (b), and (c) presents the corresponding derived SIC.
Figure 3. (a) The diagram of a proposed U-Net based algorithm to derive sea ice cover in high spatial resolution by spaceborne SAR data in dual-polarization (HH and HV) (Wang and Li Citation2021). (b) The case of S1 dual-polarization data (the southern scene of the image presented in (b)) in the format of false-color composite (details are explained in the text) presents a complicated sea ice state and the derived sea ice cover data using the proposed method.
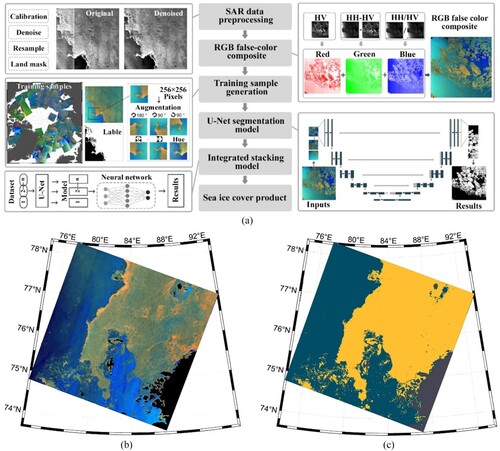
By applying the method to over 28,000 S1 extra-wide (EW) images in dual-polarization acquired in 2019, they achieved an average absolute difference of 5.55% compared with radiometer SIC data and higher accuracy of 96% compared with visual interpretation. The development of the robust method further demonstrates operational monitoring of SIE in the Arctic by spaceborne SAR data, which is also a basis to provide reliable sea-ice information in high resolution by satellite to assist cargo ships sailing the NSR.
As sea ice also has different types, e.g. young ice, first-year ice (FYI), and multi-year ice (MYI) (defined according to the development stage of sea ice), they also generally relate to different SIT, for instance, FYI can get up to 2 m thick, and MYI typically ranges from 2 to 4 m thick, with consequent different levels of navigational risk (Aksenov et al. Citation2017). Different types of sea ice can have discrepancies on radar backscattered signals in different microwave frequencies and polarizations (Nghiem et al. Citation1995). For instance, MYI generally has higher radar backscatter than FYI because it has less salinity in the upper layer, and consequent radar signal can penetrate sea ice and becomes exposed to volume scattering. However, this does not stand anymore if the FYI is highly deformed and can induce comparable radar backscatter intensity with the MYI. Therefore, as sea ice in different development stages may present overlapped radar backscatter intensity, the classification of types cannot depend solely on it.
The gray-level co-occurrence matrix (GLCM) is a widely used method to extract sea ice textures (e.g. energy, entropy, contrast, homogeneity, correlation, moment) by spaceborne SAR images (Zakhvatkina et al. Citation2020). Sea ice in different types can present some unique textures in SAR images (Holmes, Nuesch, and Shuchman Citation1984; Soh and Tsatsoulis Citation1999); therefore, the classification of sea ice types generally combines both polarimetric radar backscatter and image texture. Consequently, training samples with the extracted features of different sea ice types are input to a specific supervised-classification model, e.g. neural network (NN) (Hara et al. Citation1995; Zakhvatkina et al. Citation2013; Ressel, Frost, and Lehner Citation2015), SVM (Liu, Guo, and Zhang Citation2015), and emerging deep learning network (Song et al. Citation2018; Boulze, Korosov, and Brajard Citation2020; Han et al. Citation2021; Zhang et al. Citation2021). The trained models are applied to an entire SAR scene (generally with a swath width of a few hundreds of kilometers) to obtain a classified result at a pixel level.
Although many methods have been developed and their reported accuracies are generally good, often beyond 90%, few operational systems of SAR-based sea ice classification are developed. The ICEWATCH system (Johannessen et al. Citation1997) might be the earliest one (at least can be found in the literature) that leads spaceborne SAR into operational sea ice monitoring in the Arctic sailing routes. It is a joint project between the Russian Space Agency (RKA) and the European Space Agency (ESA) launched in 1995, aiming for sea ice monitoring in the NSR by combing satellite SAR and other remote sensing data. The Map-Guided Sea Ice Classification System (MAGIC) (Maillard, Clausi, and Deng Citation2005; Ochilov and Clausi Citation2012) is another representative system further highlighting the key role of spaceborne SAR on a broad frame of sea ice service, which has been a module system of the operational Canadian Ice Service (CIS) for years.
4. Satellite-based service supporting safety shipping in the Arctic waters
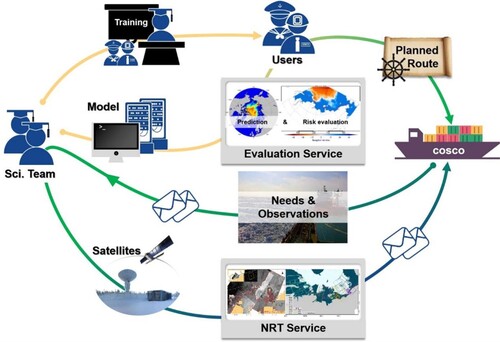
Within three years from 2019 to 2021, we built a comprehensive system based on earth observation (EO) and a numerical prediction model to support the safe sailing of China cargo ships through the NSR in the summer seasons. The system is called ‘EO4PSR’ (), i.e. EO for the polar silk road. ‘4’ in the abbreviation also means the system consists of four modules. The first one is a training unit for crew onboard vessels, particularly training for the interpretation of SAR images over sea ice. Based on the seasonal prediction of sea ice in the NSR, the second module supports the COSCO management division in planning shipping routes in the summer seasons. Communication in high latitudes ensures transferring navigational needs and observation data. The core of this system is SAR-based observations on sea ice and ocean state, which has been paid particular efforts in recent years to promote studies of SAR on sea ice monitoring to real applications. The following subsections present their contents in detail.
Figure 4. Diagram of the EO-based service for supporting safety shipping in the NSR of the Arctic.
4.1. Training unit
There are no ice pilots onboard the COSCO cargo vessels assisting captains in interpreting sea ice conditions in satellite images. Interpreting satellite remote sensing images, mainly SAR images, is difficult for captains and staff unfamiliar with radar remote sensing. These SAR images can contain complicated information on different types of sea ice and open water. Therefore, the science team sent technicians to COSCO to train captains of the vessels and technical staff of the shipping management division (which generally is responsible for route planning).
4.2. Prediction of sea ice variability in the NSR
To choose the best sailing route through the ice, a pre-determined decision of route planning is made based on potential sea ice variability in the NSR. In this respect, numerical simulations can provide predictions to assess future conditions and reduce potential navigation risks.
The high-resolution version of the Beijing Climate Center Climate System Model (BCC_CSM_HR) and a coupled data assimilation system are deployed in our system to provide a forecast of SIC and SIT. BCC_CSM_HR is atmosphere-land-ocean-sea ice coupled model, in which the sea ice component is the SIS2 (Delworth et al. Citation2006) developed by the Geophysical Fluid Dynamics Laboratory (GFDL). BCC-CSM-HR is evaluated for present-day climate simulations and shows excellent performance, which can realistically reproduce the main patterns of atmospheric temperature and wind, precipitation, sea surface temperature, and the spatial patterns of sea ice and associated seasonal variations in both hemispheres (Chu et al. Citation2019; Wu et al. Citation2021).
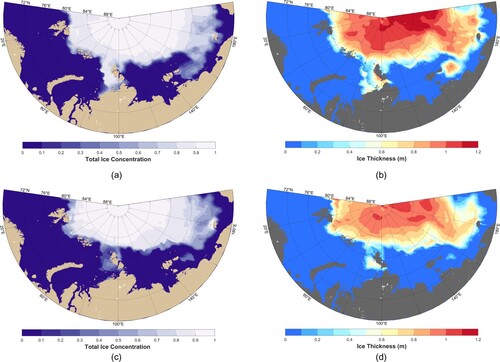
The Optimal Interpolation (OI) algorithm is used to assimilate the gridded SIC and from the Optimum Interpolation Sea Surface Temperature dataset (OISST) (Reynolds et al. Citation2007) and the SIT data from the Global Ice-Ocean Modeling and Assimilation System dataset (GIOMAS) (Zhang and Rothrock Citation2003), respectively. Experiments suggest that, with data assimilation, the Root Mean Square Error (RMSE) of simulated SIC and SIT in September in the Arctic is decreased by more than 20% compared to the control experiments. In 2021, we carried out prediction SIC and SIT in the Arctic and delivered to COSCO to plan the shipping routes, as examples shown in .
Figure 5. The predicted SIC (left column) and SIT (right) on 28 July 2021 (upper panel) and 10 August 2021(lower panel) by the BCC_CSM_HR model. The grid size of the model prediction is 0.25°.
4.3. Communication in high latitude
Although the shipping routes in the NSR can be planned in advance, for instance, based on the model prediction explained in module ii, vessels still need to keep contact with the management division to obtain updated route information. With the development of satellite communications in high latitudes, the COSCO vessels are equipped with the Inmarsat and Iridium communications systems. The equipment ensures their seamless communications in the NSR and time delay in transferring information hardly occurs.
We receive information on ship positions twice daily (6:00 and 16:00 Beijing Time) sent directly by the captains sailing in the NSR via emails. We then collected satellite data over areas matching ship positions (mainly the area ahead of the planned routes of the vessels sailing in the NSR) and processed them to SIC, sea ice coverage, sea state, or other essential information in thematic maps. The science team interprets these thematic maps to be user-friendly and, to ensure efficient transmission and avoid redundancy, are selectively mapped in a local scale of considerable value to the current position. They are transferred to the captains directly via email. In addition, these thematic maps are transferred to the COSCO management division for further optimization of shipping routes ahead, based on timely responses to ice conditions.
4.4. NRT service of sea ice and sea state by spaceborne SAR
The thematic maps sent to the vessels and management divisions are based on both remote sensing data and model forecasts. Among these maps, observations on sea ice and sea states by spaceborne SAR play an important role in supporting shipping safety in the NSR. The supporting service based on SAR observation is the highlight of our study and is also the core of the developed EO4PSR. In the following, the module is described in detail.
The data sources of spaceborne SAR are the ESA satellites of S1A and S1B and the Chinese satellite of GaoFen-3 (GF3). Both operate in the C-band (5.3 GHz) and have the polarimetric capability. The EW swath mode images with a swath width of 400 km and a pixel size of 40 m have been extensively acquired by the twins of S1, which can generally cover the whole Arctic within three days.
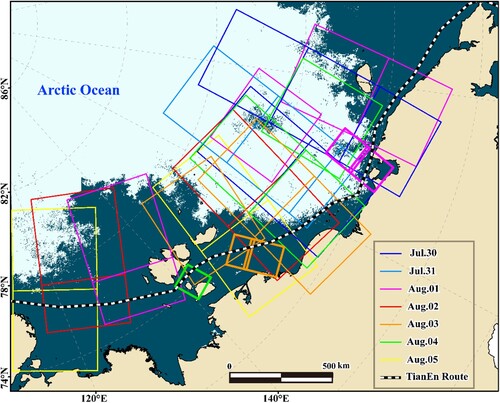
These S1 EW mode data are acquired in a polarization combination of HH and HV, particularly suitable for sea ice monitoring. Regarding the GF3 data, we used the standard stripmap mode, which has a swath width of 150 km and a pixel size of 25 m. shows a map on which the rectangles and squares are the S1 (large squares) and GF3 (small squares with thick lines) SAR acquisitions coverage over the route of TianEn cargo vessel from the Chukchi Sea to the Laptev Sea in the summer of 2019. Thanks to the broad coverage of the S1 EW mode data and high-frequent acquisitions of polar-orbit satellites in the Arctic, in this case, one can find the acquired spaceborne SAR has concentrated coverages on the route. The light blue in the figure's background represents the sea ice cover derived from numbers of S1 EW images, using the above-mentioned U-Net based deep learning algorithm (Wang and Li Citation2021). The resolved complicated sea ice state in the MIZ, particularly over the sailing route of the cargo ships, highlights the advantage of SAR for sea ice detection in high spatial resolution. Limited by the spatial coverage of SAR images, we generally collected one or several SAR images covering a local area to produce thematic maps. These thematic maps are sent to the COSCO ships sailing along the route and the headquarters’ management division in NRT.
Figure 6. Spatial coverages of the acquired S1 (large squares) and GF3 (small squares) data for generating sea ice and sea state information to support safe sailing of the COSCO cargo vessel TianEn through the NSR.
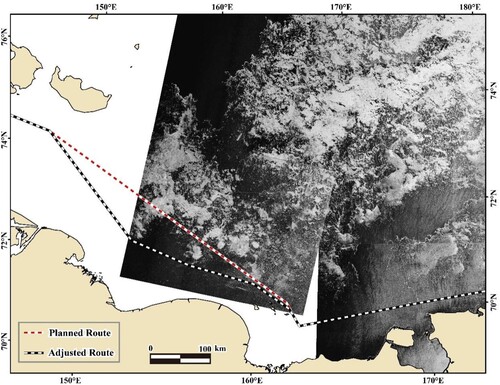
After a two-year running-in period, the COSCO gradually trusts these delivered SAR observations and treats them as an essential support to safe sailing in the NSR presenting variant sea ice state. Based on the S1 EW images acquired on 29 July 2021 delivered to COSCO (as shown in ), the ship management division sent the command to the cargo ship TianHui sailing toward the Sannikov Strait to adjust the planned route with short notice. The figure suggests that the original planned route (red dashed line) is exactly through an ice-covered area which is a great threat to the cargo ship without a guide of an icebreaker, while the ship well bypassed the sea ice cover area by choosing the new route (black–white dashed line).
Figure 7. A case demonstrates that the COSCO cargo vessel TianHui adjusted her shipping route with short notice to avoid possible threats of sea ice based on SAR observations on 29 July 2021.
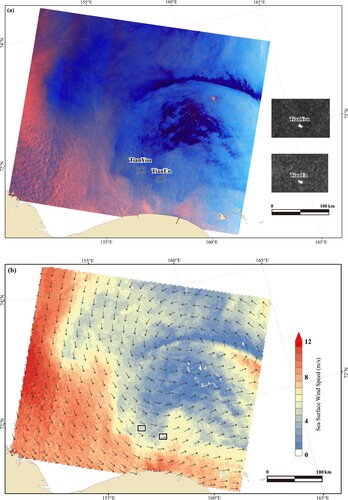
In addition to SAR-derived sea ice cover data, we also developed the backpropagation neural network (BPNN) based algorithms to retrieve significant wave height (SWH) (Wu, Li, and Huang Citation2021) and sea surface wind speed (SSWS) (Li, Qin, and Wu Citation2020) in high spatial resolution by the S1 data. Both algorithms are comprehensively validated and show good accuracy (Li, Wu, and Huang Citation2022). The SAR-derived SWH has a bias of 0.17 m and an RMSE of 0.71 m compared with multiple Radar Altimeter (RA) observations of 153,485 data pairs. Compared with in situ buoy wind speeds, a bias of 0.12 m/s and an RMSE of 1.42 m/s are achieved to validate the SAR-derived SSWS. (a) shows an RGB false-color composite image of S1 EW image acquired over the East Siberian Sea on 8 August 2020 on which the two COSCO cargo vessels of TianEn (sailing to the port of Emden, Germany) and TianYou (sailing to the Shanghai Port, China) were imaged together. The case shows a cyclone weather condition. The blue and navy colors (indicating the ratio of HH and HV is close) in the center of the false-color composite image suggest low radar backscatter of the sea surface, while the left-corner with salmon pink suggests that the radar backscatter of HV is relatively high, indicating high wind speed condition. The S1-retrieved SSWS map is shown in (b), which shows that the surrounded SSWS of the two ships is approximately 5.0-5.5 m/s, avoiding possible dangerous sea states with the assistance of satellite observations.
Figure 8. (a) A case of S1 observation of two COSCO cargo vessels (TianYou and TianEn) sailing in opposite directions in the East Siberian Sea on 8 August 2020 and the corresponding sea surface wind field derived by the SAR data (b) presenting cyclone weather.
The timeliness of the NRT service for assisting shipping in the NSR, to a large extent, depends on SAR acquisitions. The S1 data are accessed via the Copernicus open access hub (https://scihub.copernicus.eu/). It is found that data acquired by satellites are generally available for downloading in the datahub within 6 h. The S1 data are verified according to the position of ships in the NSR, then they are downloaded, processed, and sent to the ships within 1-2 h. The situation of acquiring the GF3 data is different. The Aerospace Information Research Institute (AIR) of the Chinese Academy of Sciences (CAS) operates a ground station in Kiruna, Sweden. As remote sensing satellites are often in polar orbits, e.g. S1 and GF3, they generally have 12–14 orbits over the Arctic. Therefore, Kiruna's ground station is highly efficient in receiving the data acquired in the Arctic. We successfully finished all the steps of GF3 data acquisition, data downlink to the Kiruna ground station, transferring raw data to the headquarter in Beijing, processing to the Level1B data, generating thematic maps and sending them to ships within 3 h. By combining three satellites of S1A, S1B and GF3, we can provide SAR observations daily in the NSR to yield sea ice conditions and sea state.
In successive three-year efforts providing such high-quality SAR-based sea ice and sea state data, COSCO has used them as an indispensable reference to optimize shipping routes.
5. Summary
Shipping activities are becoming more frequent in the Arctic sea routes, particularly in the NSR. While the benefits of utilizing the routes are attractive, the risks are evident. The science-based support for safe shipping and transportation in the Arctic sea routes is paid more attention than ever. The paper selectedly reviewed studies on the applications of satellite observation to support shipping activities in the Arctic sea routes.
The evaluations of Arctic sea routes navigable based on satellite observations, and numerical simulations provide valuable references to shipping lines for their strategic planning. Satellite remote sensing is the most effective tool for monitoring sea ice over the vast Arctic, which the scientific community has widely exploited to understand the Arctic environment and climate change issues. However, we also notice that applications of the rapid-development EO technology are limited to a specific scope. There is still a gap between the science development and the shipping line requirements. They are eager to have such valuable data to help tackle the challenges of variable drifting ice, wild weather, and complicated sea states encountered in the Arctic sea routes, i.e. they need tactical support for their active transportation.
Although the SAR satellites have great potential for collaborative observations of sea ice conditions and sea states and are effectively applied for supporting safety shipping in the Arctic, their spatio-temporal coverages remain to be further improved. In the development of our service, both the S1A and S1B data are widely used. Unfortunately, S1B has been out of work since December 2021, but the good news is that the S1C will be launched soon in the next year. GF3 SAR also plays an important role in the developed service. Recently, the GF3's twin of 02 and 03 satellites were launched. The initial formation of the GF3 constellation significantly improves the observation frequency in the NRS. After the commissioning phase of the two satellites, their data will be integrated into our service to support the safety of increased shipping in the NSR and to form an operational capability for rapid response to maritime emergencies.
The developed EO4PSR service aims to promote satellite-derived (particularly SAR-derived) sea ice and sea state information for navigation in the NSR. In close collaboration with the shipping company, we provided data and information by satellite observations to nine COSCO vessels each day for three shipping seasons from 2019 to 2021. The light from space illuminates their ways through NSR, safeguarding their transportation of 138,000 tons of cargo between China and Europe. It is believed in the near future, satellite data, as an important source of big earth data, their navigation information can be integrated with the modern developed intelligent route planning system, e.g. demonstrated in (Wu and Che Citation2022), to promote commercial shipping in the Arctic and to contribute to the exploration of the polar silk road.
Data availability statement
The Sentinel-1 SAR data were obtained from ESA and the GF-3 SAR data were obtained from the first author's affiliation and the National Satellite Ocean Application Service. The results of this study can be asked by the corresponding email.
Disclosure statement
No potential conflict of interest was reported by the author(s).
Additional information
Funding
References
- ABS. 2016. IMO Polar Code Advisory. Huston: American Bureau of Shipping (ABS). https://ww2.eagle.org/content/dam/eagle/advisories-and-debriefs/ABS_Polar_Code_Advisory_15239.pdf.
- Aksenov, Y., E. E. Popova, A. Yool, A. G. Nurser, T. D. Williams, L. Bertino, and J. Bergh. 2017. “On the Future Navigability of Arctic Sea Routes: High-Resolution Projections of the Arctic Ocean and Sea Ice.” Marine Policy 75: 300–317. doi:10.1016/j.marpol.2015.12.027.
- Arctic Monitoring and Assessment Programme (AMAP). 2021. Arctic Climate Change Update 2021: Key Trends and Impacts.” Summary for Policy-makers, 16. Tromsø, Norway.
- Baksh, A.-A., R. Abbassi, V. Garaniya, and F. Khan. 2018. “Marine Transportation Risk Assessment Using Bayesian Network: Application to Arctic Waters.” Ocean Engineering 159: 422–436. doi:10.1016/j.oceaneng.2018.04.024.
- Bitner-Gregerse, E. M., C. G. Soares, and M. Vantorre. 2016. “Adverse Weather Conditions for Ship Manoeuvrability.” Transportation Research Procedia 14: 1631–1640. doi:10.1016/j.trpro.2016.05.128.
- Boulze, H., A. Korosov, and J. Brajard. 2020. “Classification of Sea Ice Types in Sentinel-1 SAR Data Using Convolutional Neural Networks.” Remote Sensing 12 (13): 2165. doi:10.3390/rs12132165.
- Cao, Y., S. Liang, L. Sun, J. Liu, X. Cheng, D. Wang, Y. Chen, M. Yu, and K. Feng. 2022. “Trans-Arctic Shipping Routes Expanding Faster than the Model Projections.” Global Environmental Change 73: 102488. doi:10.1016/j.gloenvcha.2022.102488.
- Chen, S., Y. Cao, F. Hui, and X. Cheng. 2019. “Observed Spatial-Temporal Changes in the Autumn Navigability of the Arctic Northeast Route from 2010 to 2017.” Chinese Science Bulletin 64 (14): 1515–1525. doi:10.1360/N972018-01083.
- Chu, M., X. Shi, Y. Fang, L. Zhang, T. Wu, and B. Zhou. 2019. “Impacts of SIS and CICE as Sea Ice Components in BCC_CSM on the Simulation of the Arctic Climate.” Journal of Ocean University of China 18 (3): 553–562. doi:10.1007/s11802-019-3862-1.
- Chylek, P., C. K. Folland, G. Lesins, M. K. Dubey, and M. Wang. 2009. “Arctic Air Temperature Change Amplification and the Atlantic Multidecadal Oscillation.” Geophysical Research Letters 36 (14), doi:10.1029/2009GL038777.
- Comiso, J. C. 2017. Bootstrap Sea Ice Concentrations from Nimbus-7 SMMR and DMSP SSM/I-SSMIS, Version 3 (dataset). Boulder, Colorado USA: NASA National Snow and Ice Data Center.
- Comiso, J. C., D. J. Cavalieri, and T. Markus. 2003. “Sea Ice Concentration, Ice Temperature, and Snow Depth Using AMSR-E Data.” IEEE Transactions on Geoscience and Remote Sensing 41 (2): 243–252. doi:10.1109/TGRS.2002.808317.
- Cortes, C., and V. Vapnik. 1995. “Support-Vector Networks.” Machine Learning 20 (3): 273–297. doi:10.1007/BF00994018.
- Delworth, T. L., A. J. Broccoli, A. Rosati, R. J. Stouffer, V. Balaji, J. A. Beesley, W. F. Cooke, K. W. Dixon, J. Dunne, and K. Dunne. 2006. “GFDL’s CM2 Global Coupled Climate Models. Part I: Formulation and Simulation Characteristics.” Journal of Climate 19 (5): 643–674. doi:10.1175/JCLI3629.1.
- Dierking, W. 2013. “Sea Ice Monitoring by Synthetic Aperture Radar.” Oceanography 26 (2): 100–111. doi:10.5670/oceanog.2013.33.
- Fu, L.-L., and B. Holt. 1982. Seasat Views Oceans and Sea Ice with Synthetic-Aperture Radar. Pasadena, CA: California Institute of Technology, Jet Propulsion Laboratory.
- Gloersen, P. 1992. Arctic and Antarctic Sea Ice, 1978-1987: Satellite Passive-Microwave Observations and Analysis. Washington, DC: Scientific and Technical Information Program, National Aeronautics and Space administration.
- Han, Y., Y. Liu, Z. Hong, Y. Zhang, S. Yang, and J. Wang. 2021. “Sea Ice Image Classification Based on Heterogeneous Data Fusion and Deep Learning.” Remote Sensing 13 (4): 592. doi:10.3390/rs13040592.
- Hara, Y., R. G. Atkins, R. T. Shin, J. A. Kong, S. H. Yueh, and R. Kwok. 1995. “Application of Neural Networks for Sea Ice Classification in Polarimetric SAR Images.” IEEE Transactions on Geoscience and Remote Sensing 33 (3): 740–748. doi:10.1109/36.387589.
- Hill, E., M. LaNore, and S. Véronneau. 2015. “Northern Sea Route: An Overview of Transportation Risks, Safety, and Security.” Journal of Transportation Security 8 (3): 69–78. doi:10.1007/s12198-015-0158-6.
- Holmes, Q. A., D. R. Nuesch, and R. A. Shuchman. 1984. “Textural Analysis and Real-Time Classification of Sea-Ice Types Using Digital SAR Data.” IEEE Transactions on Geoscience and Remote Sensing (2): 113–120. doi:10.1109/TGRS.1984.350602.
- Hong, D.-B., and C.-S. Yang. 2018. “Automatic Discrimination Approach of Sea Ice in the Arctic Ocean Using Sentinel-1 Extra Wide Swath Dual-Polarized SAR Data.” International Journal of Remote Sensing 39 (13): 4469–4483. doi:10.1080/01431161.2017.1415486.
- Hwang, P. A., B. Zhang, J. V. Toporkov, and W. Perrie. 2010. “Comparison of Composite Bragg Theory and Quad-Polarization Radar Backscatter from RADARSAT-2: With Applications to Wave Breaking and High Wind Retrieval.” Journal of Geophysical Research 115 (C8), doi:10.1029/2009JC005995.
- Jenkins, A., and D. Holland. 2007. “Melting of Floating Ice and Sea Level Rise.” Geophysical Research Letters 34 (16), doi:10.1029/2007GL030784.
- Johannessen, O. M., V. Alexandrov, I. Y. Frolov, S. Sandven, L. H. Pettersson, L. P. Bobylev, K. Kloster, V. G. Smirnov, Y. U. Mironov, and N. G. Babich. 2006. Remote Sensing of Sea Ice in the Northern Sea Route: Studies and Applications. Heidelberg: Springer Berlin.
- Johannessen, O., S. Sandven, L. Pettersson, K. Kloster, T. Hamre, J. Solhaug, A. Volkov, V. Asmus, O. Milekhin, and V. Krovotyntsev. 1997. “ICEWATCH-real-time Sea Ice Monitoring of the Northern Sea Route Using Satellite Radar Technology.” Paper presented at the IGARSS’97. 1997 IEEE international geoscience and remote sensing symposium proceedings, remote sensing-a scientific vision for sustainable development.
- Johansson, A. M., C. Brekke, G. Spreen, and J. A. King. 2018. “X-, C-, and L-Band SAR Signatures of Newly Formed Sea Ice in Arctic Leads During Winter and Spring.” Remote Sensing of Environment 204: 162–180. doi:10.1016/j.rse.2017.10.032.
- Karvonen, J. 2014. “Baltic Sea Ice Concentration Estimation Based on C-Band Dual-Polarized SAR Data.” IEEE Transactions on Geoscience and Remote Sensing 52 (9): 5558–5566. doi:10.1109/TGRS.2013.2290331.
- Laulajainen, R. 2009. “The Arctic sea Route.” International Journal of Shipping and Transport Logistics 1 (1): 55–73. doi:10.1504/IJSTL.2009.021976.
- Lei, R., H. Xie, J. Wang, M. Leppäranta, I. Jónsdóttir, and Z. Zhang. 2015. “Changes in Sea Ice Conditions along the Arctic Northeast Passage from 1979 to 2012.” Cold Regions Science and Technology 119: 132–144. doi:10.1016/j.coldregions.2015.08.004.
- Li, X., T. Ci, and S. Luo. 2015. “Spatio-temporal Variations of Sea Ice and Navigability in the Arctic Vilkitsky Strait.” Chinese Journal of Polar Science 27: 282–288. doi:10.13679/j.jdyj.2015.3.282.
- Li, X.-M., T. Qin, and K. Wu. 2020. “Retrieval of Sea Surface Wind Speed from Spaceborne SAR Over the Arctic Marginal Ice Zone with a Neural Network.” Remote Sensing 12 (20): 3291. doi:10.3390/rs12203291.
- Li, X.-M., Y. Sun, and Q. Zhang. 2021. “Extraction of Sea Ice Cover by Sentinel-1 SAR Based on Support Vector Machine with Unsupervised Generation of Training Data.” IEEE Transactions on Geoscience and Remote Sensing 59 (4): 3040–3053. doi:10.1109/TGRS.2020.3007789.
- Li, X.-M., K. Wu, and B. Huang. 2022. “Pan-Arctic Ocean Wind and Wave Data by Spaceborne SAR.” Big Earth Data, 144–163. doi:10.1080/20964471.2021.1996858.
- Liu, H., H. Guo, and L. Zhang. 2015. “SVM-Based Sea Ice Classification Using Textural Features and Concentration from RADARSAT-2 Dual-Pol ScanSAR Data.” IEEE Journal of Selected Topics in Applied Earth Observations and Remote Sensing 8 (4): 1601–1613. doi:10.1109/JSTARS.2014.2365215.
- Maillard, P., D. A. Clausi, and H. Deng. 2005. “Operational Map-Guided Classification of SAR Sea Ice Imagery.” IEEE Transactions on Geoscience and Remote Sensing 43 (12): 2940–2951. doi:10.1109/TGRS.2005.857897.
- Melsheimer, C., and G. Spreen. 2019. “AMSR2 ASI Sea Ice Concentration Data, Arctic, Version 5.4” (July 2012 - December 2018). PANGAEA. (Dataset). Germany: Institute of Environmental Physics, University of Bremen.
- Minwei, Z., L. Xiaoming, and R. Yongzheng. 2018. “The Method Study on Automatic Sea Ice Detection with GaoFen-3 Synthetic Aperture Radar Data in Polar Regions.” Journal of Ocean University of China 40 (9): 113–124. doi:10.3969/ji.ssn.0253-4193.2018.09.010.
- Moreira, A., P. Prats-Iraola, M. Younis, G. Krieger, I. Hajnsek, and K. P. Papathanassiou. 2013. “A Tutorial on Synthetic Aperture Radar.” IEEE Geoscience and Remote Sensing Magazine 1 (1): 6–43. doi:10.1109/MGRS.2013.2248301.
- Nghiem, S., R. Kwok, S. Yueh, and M. Drinkwater. 1995. “Polarimetric Signatures of Sea Ice: 2. Experimental Observations.” Journal of Geophysical Research 100 (C7): 13681–13698. doi:10.1029/95JC00938.
- Notz, D., and S. Community. 2020. “Arctic Sea Ice in CMIP6.” Geophysical Research Letters 47 (10): e2019GL086749. doi:10.1029/2019GL086749.
- Ochilov, S., and D. A. Clausi. 2012. “Operational SAR Sea-Ice Image Classification.” IEEE Transactions on Geoscience and Remote Sensing 50 (11): 4397–4408. doi:10.1109/TGRS.2012.2192278.
- Overland, J., E. Dunlea, J. E. Box, R. Corell, M. Forsius, V. Kattsov, M. S. Olsen, J. Pawlak, L.-O. Reiersen, and M. Wang. 2019. “The Urgency of Arctic Change.” Polar Science 21: 6–13. doi:10.1016/j.polar.2018.11.008.
- Panahi, R., A. K. Ng, M. K. Afenyo, and F. Haeri. 2020. “A Novel Approach in Probabilistic Quantification of Risks Within the Context of Maritime Supply Chain: The Case of Extreme Weather Events in the Arctic.” Accident Analysis & Prevention 144: 105673. doi:10.1016/j.aap.2020.105673.
- Protection of the Arctic Marine Environment. 2022. “PAME–Arctic Shipping Status Report#1.” Accessed 14 January. https://pame.is/projects-new/arctic-shipping/pame-shipping-highlights/411-arctic-shipping-status-reports.
- Ressel, R., A. Frost, and S. Lehner. 2015. “A Neural Network-Based Classification for Sea Ice Types on X-Band SAR Images.” IEEE Journal of Selected Topics in Applied Earth Observations and Remote Sensing 8 (7): 3672–3680. doi:10.1109/JSTARS.2015.2436993.
- Reynolds, R. W., T. M. Smith, C. Liu, D. B. Chelton, K. S. Casey, and M. G. Schlax. 2007. “Daily High-Resolution-Blended Analyses for Sea Surface Temperature.” Journal of Climate 20 (22): 5473–5496. doi:10.1175/2007JCLI1824.1.
- Ronneberger, O., P. Fischer, and T. Brox. 2015. “U-net: Convolutional Networks for Biomedical Image Segmentation.” Paper presented at the International Conference on Medical image computing and computer-assisted intervention.
- Sakhuja, V. 2014. “The Polar Code and Arctic Navigation.” Strategic Analysis 38 (6): 803–811. doi:10.1080/09700161.2014.952943.
- Scheuchl, B., D. Flett, R. Caves, and I. Cumming. 2004. “Potential of RADARSAT-2 Data for Operational Sea Ice Monitoring.” Canadian Journal of Remote Sensing 30 (3): 448–461. doi:10.5589/m04-011.
- Shi, L., S. Liu, Y. Shi, X. Ao, B. Zou, and Q. Wang. 2021. “Sea Ice Concentration Products Over Polar Regions with Chinese FY3C/MWRI Data.” Remote Sensing 13 (11): 2174. doi:10.3390/rs13112174.
- Shi, L., P. Lu, B. Cheng, J. Karvonen, Q. Wang, Z. Li, and H. Han. 2015. “An Assessment of Arctic Sea Ice Concentration Retrieval Based on “HY-2” Scanning Radiometer Data Using Field Observations During CHINARE-2012 and Other Satellite Instruments.” Acta Oceanologica Sinica 34 (3): 42–50. doi:10.1007/s13131-015-0632-9.
- Simmonds, I., and K. Keay. 2009. “Extraordinary September Arctic Sea Ice Reductions and Their Relationships with Storm Behavior Over 1979–2008.” Geophysical Research Letters 36 (19), doi:10.1029/2009GL039810.
- Smith, L. C., and S. R. Stephenson. 2013. “New Trans-Arctic Shipping Routes Navigable by Midcentury.” Proceedings of the National Academy of Sciences 110 (13): E1191–E1195. doi:10.1073/pnas.1214212110.
- Soh, L.-K., and C. Tsatsoulis. 1999. “Texture Analysis of SAR Sea Ice Imagery Using Gray Level Co-Occurrence Matrices.” IEEE Transactions on Geoscience and Remote Sensing 37 (2): 780–795. doi:10.1109/36.752194.
- Song, W., M. Li, Q. He, D. Huang, C. Perra, and A. Liotta. 2018. “A Residual Convolution Neural Network for Sea Ice Classification with Sentinel-1 SAR Imagery.” Paper presented at the 2018 IEEE international conference on data mining workshops (ICDMW).
- Spreen, G., L. Kaleschke, and G. Heygster. 2008. “Sea Ice Remote Sensing Using AMSR-E 89-GHz Channels.” Journal of Geophysical Research 113 (C2), doi:10.1029/2005JC003384.
- Stoddard, M., L. Etienne, M. Fournier, R. Pelot, and L. Beveridge. 2016. “Making Sense of Arctic Maritime Traffic Using the Polar Operational Limits Assessment Risk Indexing System (POLARIS).” Paper presented at the IOP Conference series: Earth and environmental science.
- Strong, C., and I. G. Rigor. 2013. “Arctic Marginal Ice Zone Trending Wider in Summer and Narrower in Winter.” Geophysical Research Letters 40 (18): 4864–4868. doi:10.1002/grl.50928.
- Sun, Y., and X.-M. Li. 2021. “Denoising Sentinel-1 Extra-Wide Mode Cross-Polarization Images Over Sea Ice.” IEEE Transactions on Geoscience and Remote Sensing 59 (3): 2116–2131. doi:10.1109/TGRS.2020.3005831.
- Swift, C., L. Fedor, and R. Ramseier. 1985. “An Algorithm to Measure Sea Ice Concentration with Microwave Radiometers.” Journal of Geophysical Research 90 (C1): 1087–1099. doi:10.1029/JC090iC01p01087.
- Tan, W., J. Li, L. Xu, and M. A. Chapman. 2018. “Semiautomated Segmentation of Sentinel-1 SAR Imagery for Mapping Sea Ice in Labrador Coast.” IEEE Journal of Selected Topics in Applied Earth Observations and Remote Sensing 11 (5): 1419–1432. doi:10.1109/JSTARS.2018.2806640.
- Thackeray, C. W., and A. Hall. 2019. “An Emergent Constraint on Future Arctic Sea-Ice Albedo Feedback.” Nature Climate Change 9 (12): 972–978. doi:10.1038/s41558-019-0619-1.
- Tonboe, R. T., S. Eastwood, T. Lavergne, A. M. Sørensen, N. Rathmann, G. Dybkjær, L. T. Pedersen, J. L. Høyer, and S. Kern. 2016. “The EUMETSAT Sea Ice Concentration Climate Data Record.” The Cryosphere 10 (5): 2275–2290. doi:10.5194/tc-10-2275-2016.
- Vachon, P. W., and J. Wolfe. 2011. “C-Band Cross-Polarization Wind Speed Retrieval.” IEEE Geoscience and Remote Sensing Letters 8 (3): 456–459. doi: 10.1109/LGRS.2010.2085417.
- Wang, Y.-R., and X.-M. Li. 2021. “Arctic Sea Ice Cover Data from Spaceborne Synthetic Aperture Radar by Deep Learning.” Earth System Science Data 13 (6): 2723–2742. doi: 10.5194/essd-13-2723-2021.
- Wang, Y., K. Liu, R. Zhang, L. Qian, and Y. Shan. 2021. “Feasibility of the Northeast Passage: The Role of Vessel Speed, Route Planning, and Icebreaking Assistance Determined by Sea-Ice Conditions for the Container Shipping Market During 2020–2030.” Transportation Research Part E: Logistics and Transportation Review 149: 102235. doi: 10.1016/j.tre.2021.102235.
- Waseda, T., A. Webb, K. Sato, J. Inoue, A. Kohout, B. Penrose, and S. Penrose. 2018. “Correlated Increase of High Ocean Waves and Winds in the Ice-Free Waters of the Arctic Ocean.” Scientific Reports 8 (1): 1–9. doi: 10.1038/s41598-018-22500-9.
- Wu, A., and T. Che. 2022. “Routeview: An Intelligent Route Planning System for Ships Sailing Through Arctic Ice Zones Based on Big Earth Data.” International Journal of Digital Earth, doi: 10.1080/17538947.2022.2126016.
- Wu, K., X. M. Li, and B. Huang. 2021a. “Retrieval of Ocean Wave Heights from Spaceborne SAR in the Arctic Ocean with a Neural Network.” Journal of Geophysical Research: Oceans 126 (3): e2020JC016946. doi:10.1029/2020JC016946.
- Wu, T., R. Yu, Y. Lu, W. Jie, Y. Fang, J. Zhang, L. Zhang, X. Xin, L. Li, and Z. Wang. 2021b. “BCC-CSM2-HR: A High-Resolution Version of the Beijing Climate Center Climate System Model.” Geoscientific Model Development 14 (5): 2977–3006. doi: 10.5194/gmd-14-2977-2021.
- Zakhvatkina, N. Y., V. Y. Alexandrov, O. M. Johannessen, S. Sandven, and I. Y. Frolov. 2013. “Classification of Sea Ice Types in ENVISAT Synthetic Aperture Radar Images.” IEEE Transactions on Geoscience and Remote Sensing 51 (5): 2587–2600. doi: 10.1109/TGRS.2012.2212445.
- Zakhvatkina, N. Y., D. Demchev, S. Sandven, V. A. Volkov, and A. S. Komarov. 2020. “SAR Sea Ice Type Classification and Drift Retrieval in the Arctic.” In Sea Ice in the Arctic, edited by M. J. Ola, P. B. Leonid, V. S. Elena, and S. Stein, 247–299. Cham: Springer.
- Zakhvatkina, N., A. Korosov, S. Muckenhuber, S. Sandven, and M. Babiker. 2017. “Operational Algorithm for Ice–Water Classification on Dual-Polarized RADARSAT-2 Images.” The Cryosphere 11 (1): 33–46. doi: 10.5194/tc-11-33-2017.
- Zakhvatkina, N., V. Smirnov, and I. Bychkova. 2019. “Satellite SAR Data-Based Sea Ice Classification: An Overview.” Geosciences 9 (4): 152. doi: 10.3390/geosciences9040152.
- Zhang, J., and D. A. Rothrock. 2003. “Modeling Global Sea Ice with a Thickness and Enthalpy Distribution Model in Generalized Curvilinear Coordinates.” Monthly Weather Review 131 (5): 845–861. doi:10.1175/1520-0493(2003)131 < 0845:MGSIWA>2.0.CO;2
- Zheng, M., X.-M. Li, and Y. Ren. 2018. “The Method Study on Automatic Sea Ice Detection with GaoFen-3 Synthetic Aperture Radar Data in Polar Regions.” Journal of Ocean University of China 40 (9): 113–124. doi:10.3969/ji.ssn.0253-4193.2018.09.010.
- Zhang, T., Y. Yang, M. Shokr, C. Mi, X.-M. Li, X. Cheng, and F. Hui. 2021. “Deep Learning Based Sea Ice Classification with Gaofen-3 Fully Polarimetric SAR Data.” Remote Sensing 13 (8): 1452. doi: 10.3390/rs13081452.
- Zhao, X., Y. Chen, S. Kern, M. Qu, Q. Ji, P. Fan, and Y. Liu. 2021. “Distributed Acoustic Sensing Vertical Seismic Profile Data Denoiser Based on Convolutional Neural Network.” IEEE Transactions on Geoscience and Remote Sensing 60: 1–11. doi:10.1109/TGRS.2020.3042202.
- Zhao, H., and H. Hu. 2016. “Study on Economic Evaluation of the Northern Sea Route: Taking the Voyage of Yong Sheng as an Example.” Transportation Research Record: Journal of the Transportation Research Board 2549 (1): 78–85. doi: 10.3141/2549-09.