
ABSTRACT
The surface energy budget over the Qinghai-Tibet Plateau (QTP) and the Arctic significantly influences the climate system with global consequences. The performances of 30 selected Coupled Model Intercomparison Project Phase 6 (CMIP6) models were evaluated based on six sites in the QTP and Arctic. The simulation results for latent heat flux (LE) were more accurate in the QTP, where the correlation coefficient and root mean square error (RMSE) were 0.9 and 30 W m−2, respectively. The results for sensible heat flux (H) were more accurate in the Arctic, the correlation coefficient and RMSE were 0.8 and 24 W m−2, respectively. Furthermore, the multiple models mean results revealed that the surface energy flux had seasonal variation and regional differences over the QTP and the Arctic. In the QTP, H was the lowest in winter, increased in spring, and reached the maximum in summer. However, the transitional changes in spring and autumn were not apparent in the Arctic, mainly due to seasonal net radiation difference between the two places. LE was affected by precipitation and surface soil moisture content. This work is important for understanding land-atmosphere interactions and useful for improving the accuracy of land surface models simulations.
1. Introduction
Permafrost is a key component of the cryosphere, occupying approximately 21.8% of the exposed land area in the Northern Hemisphere (Obu et al. Citation2019). The diurnal variation of surface energy fluxes in permafrost regions is drastic, and has important implications for regional and global climate change (Ma et al. Citation2005; Yao et al. Citation2019). The active layer is the ‘buffer layer’ between the permafrost and the atmosphere, which has complex interactions with surface energy-water exchange (Dobiński Citation2020; Li et al. Citation2012). The active layer thaws in summer and freezes in winter, the phase transition process of water and ice during this stage changes the physical properties of the soil and the underlying surface condition, resulting in the redistribution of surface energy-water cycle (Ding et al. Citation2021; Wang, Yang, and Zhang Citation2020; Zhao et al. Citation2020). It greatly affects the exchange of energy-water between the land surface and the atmosphere (Biskaborn et al. Citation2019; Cheng et al. Citation2019; Zhao et al. Citation2000). Additionally, the surface energy budget also affects the hydrothermal process of the active layer (Hu et al. Citation2022; Ma et al. Citation2022). Therefore, studying the changes of surface energy fluxes in permafrost regions is of great significance for understanding the interaction between permafrost and the climate system.
Additionally, permafrost is sensitive to climate change and the warming of permafrost regions can amplify global climate change (Biskaborn et al. Citation2019; Mu et al. Citation2020). The Qinghai-Tibet Plateau (QTP) and the Arctic (north of 60°N), being the highest altitude and latitude areas in the northern hemisphere, respectively, respond more strongly and prominently to global warming (Guo and Wang Citation2016; Pepin et al. Citation2015). The surface air temperature on the QTP has increased 0.40–0.52 °C per decade since the 1980s (Cheng et al. Citation2019). Moreover, the latest research shows that the Arctic region has warmed at a rate of 0.75 °C per decade in the past 43 years (1979–2021), which is approximately four times the global average (0.19 °C per decade) (Rantanen et al. Citation2022). Rapid warming in permafrost regions leads to permafrost degradation (Biskaborn et al. Citation2019; Cheng and Wu Citation2007; Cheng et al. Citation2019; Zhao et al. Citation2020), resulting in changes to surface energy budgets and land-atmosphere interactions (Schaefer et al. Citation2014; Wang et al. Citation2022a). These changes, in turn, severely impact environmental deterioration and climate change.
Hence, studies on the surface energy fluxes have recently been performed over the permafrost regions (Hu et al. Citation2019; Han et al. Citation2017; Ma, Boos, and Kuang Citation2014; You et al. Citation2017). However, large uncertainties still exist in these systems. Such uncertainties include a mismatch in spatial representation between estimated fluxes and in-situ observations, topographical differences, and parameterization schemes in land surface models (Han et al. Citation2017; Yang, Guo, and Wu Citation2011), especially regarding surface sensible heat flux and the energy balance in permafrost regions of the QTP (Han et al. Citation2017; Yao et al. Citation2011). Therefore, a further understanding of the surface energy flux, especially the surface land-atmosphere interactions, would have profound implications for climate change (Hu et al. Citation2019; You et al. Citation2017). Several studies of the surface energy balance have been conducted on the QTP and the Arctic. The results imply that the surface energy flux has regional differences with obvious seasonal variations (Duan et al. Citation2022; Hu et al. Citation2019; Meng et al. Citation2021; Riihelä et al. Citation2017; Yao et al. Citation2020). However, these studies are primarily based on a single point or separate area. Studies on the regional variation between the QTP and the Arctic are scarce. Significant differences were found in permafrost extent, active layer thickness, ground temperatures, soil carbon cycles, and ecological environments between the QTP and Arctic (Wang et al. Citation2022a), leading to profound differences in the surface energy budget of the two regions. The permafrost types of the QTP and Arctic are very different due to their varying geographical locations. The QTP permafrost has a higher temperature, thinner active layer thickness, and extremely unstable thermal conditions than Arctic (Cheng and Wu Citation2007; Wu and Zhang Citation2010). The soil moisture content of the Arctic is higher, and its ecosystems have shown evidence of ‘greening’ (Bhatt et al. Citation2010; Xu et al. Citation2013), with an approximate 17% increase in peak vegetation greenness in the Arctic tundra biome (Jia, Epstein, and Walker Citation2003). Moreover, the Eurasian continent has a deeper snow cover for longer period than the QTP. Therefore, the local thermal conditions of the two are highly different. Additionally, the rapid warming of the Arctic and QTP will lead to atmospheric circulation anomalies (Dobricic, Vignati, and Russo Citation2016; Feng and Wu Citation2015). Thus, understanding the surface energy budget of the QTP and the Arctic plays an important role in the in-depth study of climate change between the two.
The Coupled Model Intercomparison Project Phase 6 (CMIP6; Eyring et al. Citation2016) is the latest and most profound coordinated international climate model intercomparison project (Wild Citation2020). The differences between the CMIP6 and CMIP5 projects include new generation models and a different end year (2014 for CMIP6 and 2005 for CMIP5) for the historical experiments (Gidden et al. Citation2019; Almazroui et al. Citation2020). Performance measurement of the CMIP6 models while simulating the surface energy flux in permafrost regions is not completely understood. Meanwhile, an analysis of the characteristics of surface energy flux and its response to climate change over the QTP and the Arctic is necessary. Therefore, the following are the main aims of this study: (1) evaluating the simulation performance of the CMIP6 models in the surface energy flux in permafrost regions over the QTP and the Arctic and (2) describing temporal and spatial variation characteristics of surface energy flux over the QTP and the Arctic.
2. Data
2.1. In situ observations
The in-situ data used in this study were obtained from the Tussock flux tower, Cherskiy flux tower, Xidatan site (XDT), Wudaoliang site (WDL), NewD66 site, and Tanggula site (TGL) (). lists the detailed information of the four sites. The Tussock flux tower was installed at moist acidic tussock tundra dominated by tussock and dwarf shrubs in Alaska, USA. The mean annual air temperature was approximately −7.4 °C; and the mean annual precipitation was approximately 318 mm, mainly concentrated in the summertime with an approximate value of 230 mm (El Sharif et al. Citation2019). Vegetation types within the flux footprint were 95% of the tussock tundra, balancing the overgrown frost boils (Cristóbal et al. Citation2017). The Cherskiy site is located in a region of forest tundra at the latitudinal treeline 100 km south of the Arctic Ocean. The ice content of the soils was significantly higher than that of permafrost soils in North America. The eddy-covariance systems were installed within the height range of 2.5–3 m, consisting of a 3D sonic anemometer and an open path infrared gas analyzer with a sampling frequency of 10 Hz (El Sharif et al. Citation2019). The data of the Tussock and Cherskiy sites were provided by the Arctic Observatory Network (AON) (http://aon.iab.uaf.edu/imnavait).
Figure 1. Location of the six sites at the North Hemisphere.
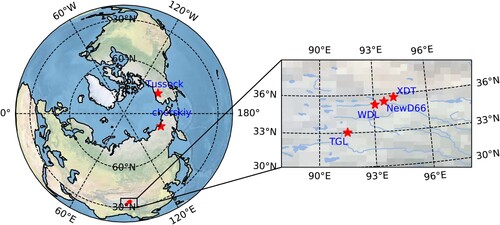
Table 1. Information of in-situ monitoring sites used in this study
The TGL site is located on a gentle slope to the southwest of Tanggula Mountain with an altitude of 5100 m in the hinterland of the QTP. The grassy alpine meadow was the main land surface type. Its coverage ranged from 30% to 40% (Li et al. Citation2019). The average annual air temperature and the mean annual pressure are approximately −4.9 °C and 538 hPa, respectively. Furthermore, the annual precipitation is approximately 436.7 mm, of which over 80% was concentrated between May and September (Gu et al. Citation2015). The XDT site is located in the northernmost permafrost in the northern QTP, representing the characteristics of the island-shaped permafrost (Zhao et al., Citation2021). WDL is located in the hinterland of the QTP. The radiation and ground thermal conditions in this area are well represented in the northern QTP, especially in the vast area between the Kunlun Mountains and the Tanggula Mountains. The NewD66 observation site is located near the Hoh Xil National Nature Reserve. The terrain around the NewD66 is open and flat, with an arid climate and little rainfall. The underlying vegetation coverage is small, mainly consisting of alpine sparse grassland. The meteorological data of the TGL and XDT sites primarily include precipitation, global radiation, soil heat flux, air temperature, wind speed, and relative humidity measurements, which were measured using the 10-m meteorological gradient tower. The downward and upward shortwave and longwave radiations were measured by a four-component net radiometer at 2 m height. All the sensors were attached to a CR1000 data logger. Furthermore, these instruments were sampled every 5 min, and the data were averaged once after 30 min (Ma et al. Citation2022). The data from TGL, XDT, and WDL sites were provided by the Cryosphere Research Station on the QTP of the Chinese Academy of Sciences (CAS). Nagqu Station of Plateau Climate and Environment, Northwest Institute of Eco-Environment and Resources, Chinese Academy of Sciences provided the data of NewD66 sites.
2.2. CMIP6 data
This study adopted CMIP6 multi-model datasets. lists 30 models of surface energy flux from the CMIP6 ‘historical’ experiments (1850-2014). More details on the CMIP6 dataset can be found on the CMIP6 database website (https://esgf-node.llnl.gov/projects/cmip6/). The models from CMIP6 were available with different horizontal resolutions, as listed in . The surface energy flux of the CMIP6 models analyzed in this study was selected from the final 30 years of these simulations (1985–2014), representing the present-day conditions. Moreover, all the CMIP6 data were re-gridded before beginning the analysis from their original resolutions to a common grid with 0.1° × 0.1° resolution using a triangulation interpolation procedure.
Table 2. List of CMIP6 models used in this study
3. Results
3.1. CMIP6 models performance evaluation
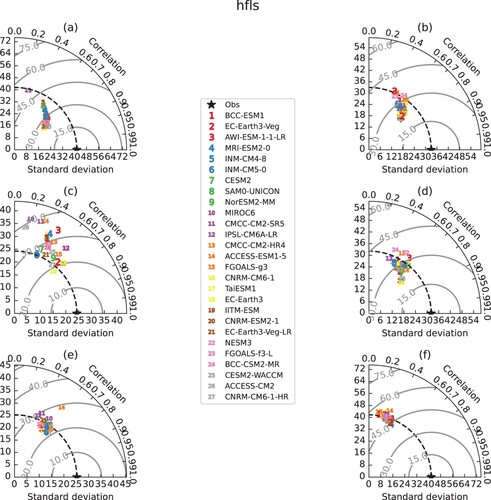
shows the temporal behavior of LE derived from the 27 CMIP6 models compared to the in-suit data from the six sites. Most CMIP6 models agree well with in-suit data, especially for the TGL and XDT sites in the QTP, with a correlation coefficient of approximately 0.9. The correlation coefficient for WDL and NewD66 sites was approximately 0.7. However, the results of different models at the WDL site were quite different. The RMSE for the four sites in the QTP was between 15 and 45 W m−2, with an average value of approximately 30 W m−2. However, the simulated LE was less accurate at the two sites in the Arctic. The correlation coefficient and RMSE were approximately 0.7 and 12–24 W m−2, respectively, at the Tussock site. The simulation at the Cherskiy site was the least accurate with correlation coefficients ranging from 0.1–0.6. Most of these were concentrated at approximately 0.3. Furthermore, the RMSE ranged from 40 to 60 W m−2, again showing the worst performance of the six sites.
Figure 2. Taylor program for a daily average of the latent heat flux between CMIP6 models and observation at (a) TGL, (b) XDT, (c)WDL, (d)NewD66, (e) Tussock, and (f) Cherskiy site. The gray line corresponds to root mean square error (RMSE).
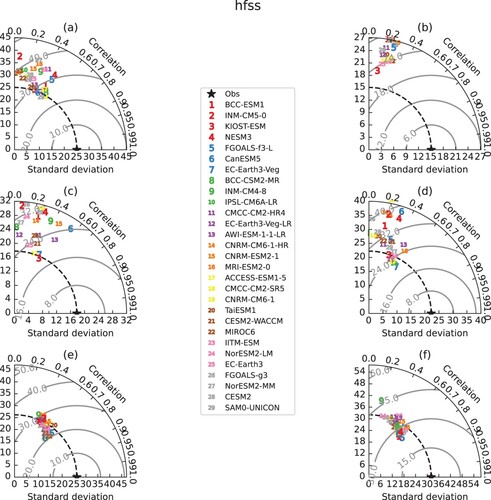
shows the daily average of the H between 29 CMIP6 models and observation at the six sites. Generally, the four sites in the QTP have poor simulation results; they are not as good as those of LE. However, the two sites in the Arctic have better simulation results, and they are better than LE. The correlation coefficient was approximately 0.4 for the TGL site, and RMSE was concentrated between 24 and 32 W m−2. For the XDT site, most models showed poor correlation coefficients, with values of approximately 0.2, and RMSE was centered between 20 and 28 W m−2. The simulation results of the WDL and NewD66 sites were relatively similar. For both, the correlation coefficients were approximately 0.4, and the RMSE was concentrated between 16 and 36 W m−2. The correlation coefficients for some models, such as the EC-Earth3, were close to 0 in the QTP. The simulation results in the Arctic region were significantly better. The correlation coefficient was approximately 0.7, and the RMSE of 24 W m−2 and 30 W m−2 for the Tussock and Cherskiy sites, respectively. Overall, this suggests that CMIP6 models can simulate much of the annual variability of H in the permafrost regions over the QTP and Arctic.
Figure 3. Taylor program for a daily average of the sensible heat flux between CMIP6 models and observation at (a) TGL, (b) XDT, (c)WDL, (d)NewD66, (e) Tussock, and (f) Cherskiy site. The gray line corresponds to root mean square error (RMSE)
3.2. The result evaluation of multiple models mean
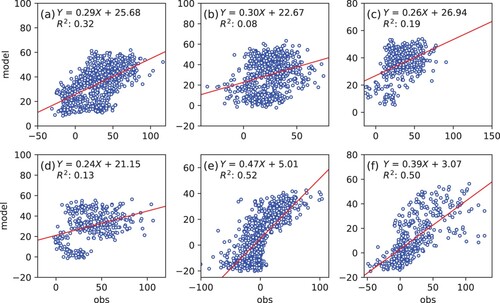
shows the comparisons between the observed values and the CMIP6 multiple models mean results of LE in the six sites. The blue dots represent the daily LE, while the red lines denote the best-fit lines. It is evident that the multiple models mean results agreed well with observations, matching the observed values closely. The observed values ranged from 0 W m−2–175 W m−2 in the QTP. However, the multiple models mean results were slightly lower, ranging from 0 W m−2–100 W m−2. The squared correlation coefficients were 0.76, 0.62, 0.47, and 0.50 for the TGL, XDT, WDL, and NewD66 sites, respectively. The simulation results in the Tussock site were slightly poorer, with a squared correlation coefficient value of 0.51. Furthermore, the Cherskiy site showed the best performance; the scatter points were evenly distributed on both sides of the best-fit line. Moreover, the squared correlation coefficient value was 0.78. shows the performance of the multiple models mean results for H at the six sites. Unlike those of LE, the multiple models mean results of H were higher than the observed values. The simulation performance of H was worse than that of LE, especially for QTP. The squared correlation coefficient for the four sites of QTP were only 0.32, 0.08, 0.19, and 0.13, respectively. The squared correlation coefficient of H in the Tussock and Cherskiy sites were 0.52 and 0.50, respectively. The values of H were smaller than those of LE in both QTP and Arctic. Overall, the CMIP6 multiple models mean results can reasonably represent the annual variation of surface energy flux.
Figure 4. Latent heat flux simulated by the multiple models mean results versus observed at (a) TGL, (b) XDT, (c)WDL, (d)NewD66, (e) Tussock, and (f) Cherskiy site.
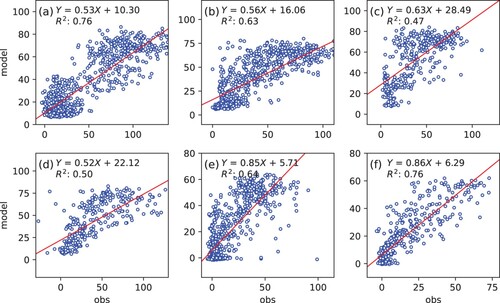
Figure 5. Sensible heat flux simulated by the multiple models mean results versus observed at (a) TGL, (b) XDT, (c)WDL, (d)NewD66, (e) Tussock, and (f) Cherskiy site.
3.3. Spatiotemporal variation characteristics of surface energy flux in the QTP and Arctic
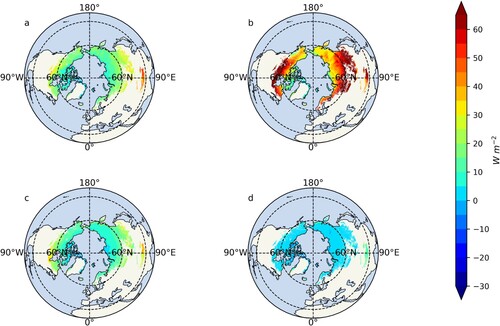
The spatial pattern of mean annual seasonal LE in the permafrost regions over the QTP and the Arctic derived from multiple models mean results are shown in . LE links global energy and water balance (Wild Citation2020). The change of LE was closely related to the rainy season of the QTP and the water content of the soil surface. The LE for the QTP decreased from south to north and from east to west. It was low in spring, and negative values appeared in the northern region. The LE increased dramatically, reaching its maximum, in summer, which was consistent with the distribution of the QTP rainy season (Gu et al. Citation2015; Yao et al. Citation2020); it reached more than 60 W m−2 in the high-value area of the eastern region. The LE in most parts of the QTP reached more than 50 W m−2. However, it decreased rapidly in winter due to the decreasing water content of surface soil after the end of the rainy season. The value in most areas of the QTP was below 20 W m−2. Furthermore, LE in the Arctic was weaker than in the QTP. The land surface had slightly negative values between −10 and 0 W m−2 in winter and spring, indicating that the atmosphere transported the LE to the surface. The value of Eurasia and North America continents ranged between 30 and 60 W m−2 in summer and autumn – except for the weakly positive values of Greenland – which was approximately 5 W m−2, indicating that the surface of the earth transported LE to the atmosphere, which may be related to the melting of snow. The long-term average annual energy budget of the entire Arctic is always negative, which is in balance with the positive value of the long-term average of low-latitude regions. However, significant differences exist in the average energy budgets of different sub-regions of the Arctic, mostly due to differences in heat between sea and land.
Figure 6. The mean seasonal variation in (a) spring, (b)summer, (c)autumn, and (d)winter of latent heat flux (units: W m−2) during 1985–2014 in permafrost regions over Arctic and QTP from CMIP6 multiple models mean.
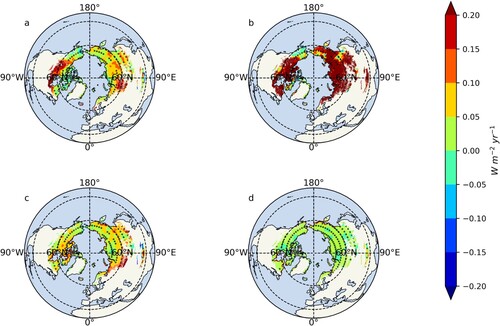
The interannual trends in seasonal variation of LE in permafrost regions during 1985–2014 is shown in . The QTP and Arctic had larger inter-annual variations in summer and autumn compared to spring and winter. The LE showed a steep increase during summer in both QTP and Arctic. However, it increased slightly in spring and autumn. On the contrary, a slightly decreasing trend was observed in some areas during winter. The annual mean of all regions showed an increasing trend. The trend was approximately 0.1–0.2 W m−2 yr−1 in the QTP. This increasing trend was observed to be slightly weaker in the Arctic, with approximately 0.05–0.15 W m−2 yr−1. This is consistent with the simulation results of Wang, Ma, and Liu (Citation2022b) in the QTP.
Figure 7. The variation trend for latent heat flux in (a) spring, (b)summer, (c)autumn, and (d)winter in permafrost regions over Arctic and QTP from 1985 to 2014. The dotted area passed the 95% significance test
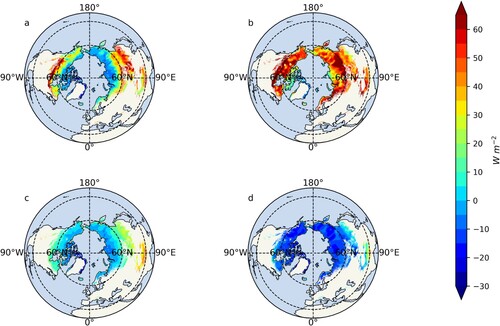
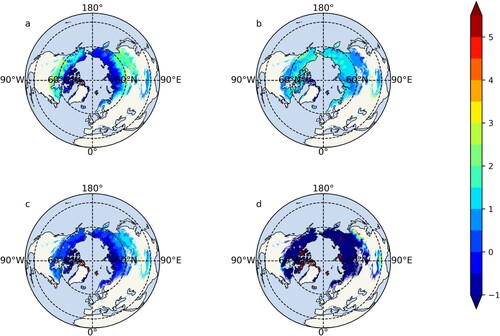
shows the spatial pattern of mean annual seasonal H in permafrost regions over the QTP and Arctic. The value of H in winter and spring was below 10 W m−2 in the QTP. However, a high-value center exists in the south of the QTP, ranging from 30 to 40 W m−2. In summer, H increased rapidly with increasing solar radiation to a maximum value of more than 70 W m−2. The average value of the central region was between 30 and 60 W m−2. Autumn is a transitional period between summer and winter. The lowest value in the northern region was reduced to approximately 10 W m−2. For the Arctic, the H of Greenland, Iceland, and the Arctic regions of Eurasia and North America were negative in winter, indicating that the atmosphere transported H to the surface. Furthermore, the amount of energy transport ranged mostly from 0 to 30 W m−2. In summer, all Arctic land except Greenland had positive H values, transported from the surface to the atmosphere, in the range of 0–30 W m−2, which balanced with the H obtained from the surface in winter.
Figure 8. The mean seasonal variation in (a) spring, (b)summer, (c)autumn, and (d)winter of sensible heat flux (units: W m−2) during 1985–2014 in permafrost regions over Arctic and QTP from CMIP6 multiple models mean.
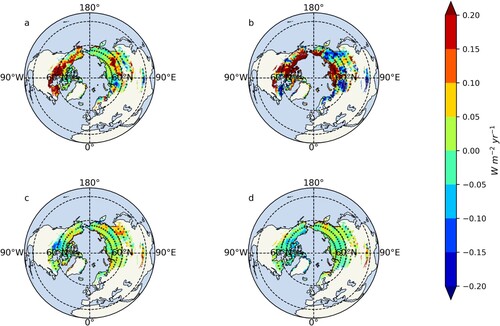
Interannual trends in the seasonal variation of H in permafrost regions during the period of 1985–2014, based on the multiple models mean results, are shown in . The H showed increasing and decreasing trends in winter and summer in QTP, respectively. For the annual mean, the central and eastern QTP showed a decreasing trend of approximately −0.05 – −0.15 W m−2 yr−1; and the western QTP showed an increasing trend of 0.1–0.2 W m−2 yr−1. The H in the high latitudes of the Arctic showed an increasing trend of 0.1–0.2 W m−2 yr−1. However, a decreasing trend of 0.1–0.15 W m−2 yr−1 was seen for regions near 60°N, such as Western Siberia.
Figure 9. The variation trend for sensible heat flux in (a) spring, (b)summer, (c)autumn, and (d)winter in permafrost regions over Arctic and QTP from 1985 to 2014. The dotted area passed the 95% significance test.
4. Discussion
4.1. The interaction between permafrost and the surface energy budget
The active layer in permafrost regions is the link between the atmosphere and the land surface. It has an important impact on the energy-water exchange between the land surface and the atmosphere (Li et al. Citation2012; Zhao et al. Citation2000). The freeze–thaw process of the active layer is highly complex. It encompasses physical and chemical changes that have significant impacts on surface energy fluxes (Hu et al. Citation2019; Luo et al. Citation2014; Wani et al. Citation2021). Previous studies have confirmed that the freeze–thaw process can significantly affect hydrothermal systems in permafrost regions, especially the surface energy flux within the land surface (Eugster et al. Citation2000). Moreover, the freezing and thawing of soil moisture require the release and absorption of large amounts of latent heat (Zhao et al. Citation2000). Furthermore, the energy partitioning at the surface also buffers against soil temperature change attenuating its magnitude (Eugster et al. Citation2000).
The Bowen ratio is the ratio of sensible to latent heat flux. It summarizes how the energy budget is partitioned between H and LE. The available energy shifts more towards the H with an increasing Bowen ratio (Eugster et al. Citation2000; Hu et al. Citation2019; Gu et al. Citation2015). In the Arctic, spring is more appropriately called light winter, in which shortwave radiation increases gradually. The increment is not significant due to the high snow albedo. At this stage, the energy budget is similar to that in winter. The average negative sensible heat flux is balanced with the long-wave radiation. The latent heat flux occupies an insignificant position in the energy budget (a), Furthermore, the Bowen ratio is negative for most of the Arctic (a). The snow and active layer start to melt during this period. The latent heat flux also increases with increasing surface soil moisture content. The summer period has strong shortwave radiation, the snow cover is the least (Serreze et al. Citation2007). The net shortwave radiation is balanced with the net longwave radiation, H, LE, and ground heat flux, leading to the thawing of the active layer in permafrost regions. The average Bowen ratio is close to one. However, it varies widely from 0.5–2 in different regions (b). This is primarily related to the local surface soil moisture content (Westermann et al. Citation2009). The shortwave radiation decreases sharply in autumn, and the snow cover for a longer period of time has not yet formed. During this period, the H shifts towards negative values (c). However, the freezing of active layer soil does not begin completely. Shortwave radiation in winter is approximately zero owing to the arrival of the polar night. At this time, the longwave radiation dominates the system. Longwave radiation is primarily balanced by negative H, which heats the land surface and cools the atmosphere. The LE has only minor importance in the energy balance during this period.
Figure 10. The mean seasonal variation in (a) spring, (b)summer, (c)autumn, (d)winter of Bowen ratio during 1985–2014 in permafrost regions over Arctic and QTP from CMIP6 multiple models mean.
Additionally, different permafrost types and soil properties also have an impact on surface energy budget changes and simulation accuracy. The TGL site is situated southwest of Tanggula Mountain on the hinterland of the QTP, the highest altitude observation station in the permafrost area (Li et al. Citation2019) and is characterized as cold permafrost. On the contrary, the XDT site is located along the permafrost boundary in the northern QTP (Zhao et al., Citation2021), It has an abundant soil moisture content, and is characterized as warm permafrost. Therefore, the two sites have different land surface energy and water exchange processes. The warm permafrost has a more intensive land surface process than cold permafrost (Yao et al. Citation2020); the latent heat effects may retard the increment in permafrost temperature, increasing the ground temperatures in cold permafrost regions more rapidly than in warm permafrost regions (Wang et al. Citation2022a). Furthermore, the soil properties of the two sites are quite different. The soil of the XDT site has a lower gravel content and higher clay and silt contents than the TGL site (Yao et al. Citation2020), which is beneficial for storing soil moisture and increasing soil thermal conductivity. Consequently, the surface hydrothermal exchange processes were stronger at the XDT site than TGL site. The accurate simulation of surface energy flux is challenging due to the complexity of hydrothermal processes. This is consistent with our evaluation result of CMIP6 models (). We found that the multi-model mean results at the XDT site were worse than the TGL ( and ), Yang et al. (Citation2021) obtained identical results; finding that the land surface process model also poorly simulated soil temperature and soil thermal conductivity at this site.
4.2. Model uncertainties in surface energy flux simulations
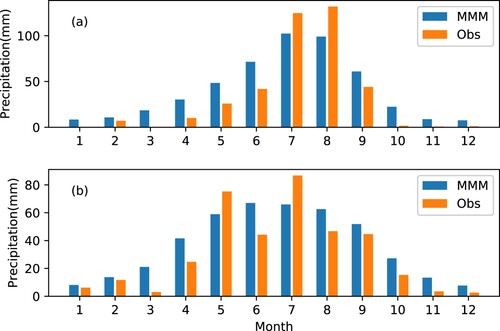
This study evaluated the performance of the surface energy flux in 30 CMIP6 models. The multiple models mean results agreed well with the observed value; however, simulation errors still remained. LE was low in winter and spring and increased significantly when the rainy season started (You et al. Citation2017; Wang et al. Citation2019). We noticed that the simulated LE was underestimated in summer, especially for the QTP. Previous studies proved that precipitation, soil moisture content, and surface condition were important influencing factors for LE (Ma et al. Citation2022; Gu et al. Citation2015; Yao et al. Citation2011, Citation2020). Due to the lack of meteorological observation data at some sites, this study compared the precipitation data from CMIP6 multiple models mean results and observed values from only the TGL and XDT sites (). Precipitation was underestimated in the rainy season (mainly in July and August), which is an important factor for the underestimation of LE in the QTP seen in this study. Additionally, the surface energy flux is influenced significantly by the freeze–thaw process (Hu et al. Citation2019); the inaccuracy of land surface models on soil hydrothermal simulation can have a large impact on the energy budget (Yang, Chen, and Qin Citation2009). The soil moisture is often underestimated in the QTP, which is a common phenomenon in land surface models (Li et al. Citation2020; Yang et al. Citation2021; Deng et al. Citation2020, Citation2021). Moreover, the reanalysis product also underestimated soil moisture. Previous studies indicated that soil moisture was also underestimated by GLDAS-Noah in the QTP (Chen et al. Citation2013; Bi et al. Citation2016). The underestimation of soil moisture is also an important reason for the underestimation of latent heat. However, the multiple models mean results and the observed values are very close in the Arctic, which may relate to the difference in surface conditions and soil moisture content between the QTP and Arctic (Wang et al. Citation2022a).
Figure 11. Monthly mean precipitation simulated by the multiple models mean (MMM) results versus observed at (a) TGL, and (b) XDT site.
Additionally, the results indicated that H was underestimated in QTP and overestimated in the Arctic. Previous studies have shown that H is primarily affected by ground air temperature gradients and surface wind speed (Duan et al. Citation2022; Yang, Guo, and Wu Citation2011; Chen et al. Citation2019; Hu et al. Citation2019; Xie et al. Citation2019; Wang, Ma, and Liu Citation2022b). Subsequently, we compared the ground air temperature gradients, and the surface wind speed between the multiple models mean results and the observed values at the four sites ( and ). shows that the multiple models mean results significantly underestimated the ground air temperature gradients in both QTP and Arctic. Similar phenomena have also been observed in previous studies, which showed that CMIP5 models also underestimated the air temperature in QTP (Wu et al. Citation2017). Additionally, Cao et al. (Citation2020) evaluated the performance of the ERA5-land soil temperature reanalysis product. They found that ERA5-Land overestimates soil temperature in the Arctic; however, it underestimates it in mid-low latitudes. We compared the wind speed between the CMIP6 multiple models mean results and the four sites to further investigate the influencing factors for H. The wind speed by multiple models mean results was lower than the observed values at the TGL and XDT sites (a and b). The underestimation of ground air temperature gradients and the wind speed are attributed to the underestimation of H in the QTP. However, we found that the wind speed by multiple models mean results was higher than the observed values at the two sites over the Arctic (c and d), which also explains the overestimation of H in the Arctic.
Figure 12. Monthly mean wind speed simulated by the multiple models mean (MMM) results versus observed at (a) TGL, (b) XDT, (c) Tussock, and (d) Cherskiy site.
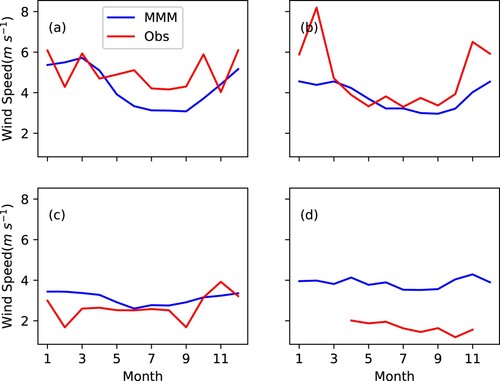
Table 3. Comparison of the difference between the monthly mean surface temperature (°C) and air temperature (°C) in the four sites and their relative error (RE).
4.3. Differences in surface energy flux variations between the QTP and the Arctic
We found that seasonal variations in average surface energy flux have significant differences between the QTP and the Arctic due to factors such as underlying surface conditions, unique geographic settings, and climate status (Hu et al. Citation2019; Li et al. Citation2006). The Asian monsoon and the freeze–thaw process are the main factors influencing the seasonal change over the QTP (Yao et al. Citation2020). Furthermore, the QTP is a weak heat sink in winter; however, it is a strong heat source in summer (Wu et al. Citation2015). The Arctic has particular lighting and climate conditions (Przybylak Citation2016). It is generally represented as an energy-deficient area. The energy budget is primarily influenced by two processes: the net loss of the local radiation budget and the net surplus of the poleward energy transport in the atmosphere-ocean system (Trenberth and Fasullo Citation2009). Comparison of and and and show that the simulation results of CMIP6 in the Arctic are better than those in the QTP.
Moreover, H increased rapidly over the permafrost region of the QTP and the Arctic (except in Greenland) from spring to summer, mainly due to the increasing solar radiation, which caused a sharp increase in the air temperature (Wang, Yang, and Wan Citation2013). The annual radiation balance of Greenland, whose surface is mainly covered by the ice sheet, is smaller than other regions (Lund et al. Citation2017). Concurrently, LE also increased over the QTP and the Arctic, except for Greenland, due to the rainy season. Furthermore, LE played an important role in modulating the hydrologic cycle of the local (Rawlins et al. Citation2010). It was mainly affected by precipitation, surface soil moisture content, and melting snow. Additionally, it responded more strongly and quickly than H; therefore, its value exceeded H in the summer. However, H and LE started diminishing after autumn due to the rapid reduction of solar radiation ( and ).
5. Conclusion
In this study, the surface energy flux of 30 CMIP6 models were assessed using in-situ data from six sites in the QTP and the Arctic. The evaluation results in this study revealed that the majority of CMIP6 models for latent heat flux (LE) were close to the in-situ data. The simulation results for LE in the QTP were better. The correlation coefficient reached 0.9, and the RMSE was approximately 30 W m−2. The simulation results of sensible heat flux (H) in the Arctic were better, the correlation coefficient of 0.8 and the RMSE of approximately 24 W m−2. Overall, the multiple models mean results can represent the surface energy flux characteristic over both the QTP and the Arctic.
The multiple models mean results showed that the surface energy flux had seasonal variation and regional differences across the QTP and the Arctic. In the QTP, H was low in winter and high in summer. An obvious transitional stage in spring and autumn was observed. However, the transition between spring and autumn in the Arctic is not apparent, mainly due to the difference in net radiation changes between the two. The simulation errors of H may result from ground air temperature gradients and surface wind speed estimation errors. Moreover, LE was large in summer and autumn and small in spring and winter. The underestimation of the precipitation and surface soil moisture content in the rainy season is an important reason for the underestimation of LE in the QTP.
Acknowledgements
This work was supported by the National Key Research and Development Program of China (2020YFA0608502), the National Natural Science Foundation of China (42071093), the Natural Science Foundation of Gansu Province (22JR5RA054), the State Key Laboratory of Cryospheric Science (SKLCS-ZZ-2022), and the National Natural Science Foundation of China (41941015, 41671070). We would also thank the Nagqu Station of Plateau Climate and Environment, Northwest Institute of Eco-Environment and Resources, Chinese Academy of Sciences provided the observed data of NewD66 site.
Disclosure statement
No potential conflict of interest was reported by the author(s).
Data availability statement
The following data used in this study are publically available at: Tussock flux tower and Cherskiy flux tower: http://aon.iab.uaf.edu/imnavait. CMIP6 data: https://esgf-node.llnl.gov/projects/cmip6/.
Additional information
Funding
References
- Almazroui, M., S. Saeed, F. Saeed, M. N. Islam, and M. Ismail. 2020. “Projections of Precipitation and Temperature Over the South Asian Countries in CMIP6.” Earth Systems and Environment 4: 297–320.
- Bhatt, U. S., D. A. Walker, M. K. Raynolds, J. C. Comiso, H. E. Epstein, G. Jia, R. Gens, et al. 2010. “Circumpolar Arctic Tundra Vegetation Change Is Linked to Sea Ice Decline.” Earth Interactions 14: 1–20.
- Bi, H., J. Ma, W. Zheng, and J. Zeng. 2016. “Comparison of Soil Moisture in GLDAS Model Simulations and in Situ Observations Over the Tibetan Plateau.” Journal of Geophysical Research: Atmospheres 121 (6): 2658–2678.
- Biskaborn, B. K., S. L. Smith, J. Noetzli, H. Matthes, G. Vieira, D. A. Streletskiy, and P. Schoeneich. 2019. “Permafrost Is Warming at a Global Scale.” Nature Communications 10: 1–11.
- Cao, B., S. Gruber, D. Zheng, and X. Li. 2020. “The ERA5-Land Soil Temperature Bias in Permafrost Regions.” The Cryosphere 14: 2581–2595.
- Chen, L., S. C. Pryor, H. Wang, and R. Zhang. 2019. “Distribution and Variation of the Surface Sensible Heat Flux Over the Central and Eastern Tibetan Plateau: Comparison of Station Observations and Multireanalysis Products.” Journal of Geophysical Research: Atmospheres 124: 6191–6206.
- Chen, Y., K. Yang, J. Qin, L. Zhao, W. Tang, and M. Han. 2013. “Evaluation of AMSR-E Retrievals and GLDAS Simulations Against Observations of a Soil Moisture Network on the Central Tibetan Plateau.” Journal of Geophysical Research: Atmospheres 118: 4466–4475.
- Cheng, G., and T. Wu. 2007. “Responses of Permafrost to Climate Change and Their Environmental Significance, Qinghai-Tibet Plateau.” Journal of Geophysical Research: Earth Surface 112 (F2): 1–10.
- Cheng, G., L. Zhao, R. Li, X. Wu, Y. Sheng, G. Hu, D. Zou, and X. Wu. 2019. “Characteristic, Changes and Impacts of Permafrost on Qinghai-Tibet Plateau.” Chinese Science Bulletin 64: 2783–2795.
- Cristóbal, J., A. Prakash, M. C. Anderson, W. P. Kustas, E. S. Euskirchen, and D. L. Kane. 2017. “Estimation of Surface Energy Fluxes in the Arctic Tundra Using the Remote Sensing Thermal-Based Two-Source Energy Balance Model.” Hydrology and Earth System Sciences 21: 1339–1358.
- Deng, M., X. Meng, Y. Lu, Z. Li, L. Zhao, Z. Hu, and H. Chen. 2021. “Impact and Sensitivity Analysis of Soil Water and Heat Transfer Parameterizations in Community Land Surface Model on the Tibetan Plateau.” Journal of Advances in Modeling Earth Systems 13: e2021MS002670.
- Deng, M., X. Meng, Y. Lyv, L. Zhao, Z. Li, Z. Hu, and H. Jing. 2020. “Comparison of Soil Water and Heat Transfer Modeling Over the Tibetan Plateau Using Two Community Land Surface Model (CLM) Versions.” Journal of Advances in Modeling Earth Systems 12: e2020MS002189.
- Ding, Y., C. Mu, T. Wu, G. Hu, D. Zou, D. Wang, W. Li, and X. Wu. 2021. “Increasing Cryospheric Hazards in a Warming Climate.” Earth-Science Reviews 213: 103500.
- Dobiński, W. 2020. “Permafrost Active Layer.” Earth-Science Reviews 208: 103301.
- Dobricic, S., E. Vignati, and S. Russo. 2016. “Large-Scale Atmospheric Warming in Winter and the Arctic Sea Ice Retreat.” Journal of Climate 29: 2869–2888.
- Duan, A., S. Liu, W. Hu, D. Hu, and Y. Peng. 2022. “Long-Term Daily Dataset of Surface Sensible Heat Flux and Latent Heat Release Over the Tibetan Plateau Based on Routine Meteorological Observations.” Big Earth Data, 1–12.
- El Sharif, H., W. Zhou, V. Ivanov, A. Sheshukov, V. Mazepa, and J. Wang. 2019. “Surface Energy Budgets of Arctic Tundra During Growing Season.” Journal of Geophysical Research: Atmospheres 124: 6999–7017.
- Eugster, W., W. R. Rouse, R. A. Pielke Sr, J. P. Mcfadden, D. D. Baldocchi, T. G. F. Kittel, and F. S. Chapin III. 2000. “Land–Atmosphere Energy Exchange in Arctic Tundra and Boreal Forest: Available Data and Feedbacks to Climate.” Global Change Biology 6: 84–115.
- Eyring, V., S. Bony, G. A. Meehl, C. A. Senior, B. Stevens, R. J. Stouffer, and K. E. Taylor. 2016. “Overview of the Coupled Model Intercomparison Project Phase 6 (Cmip6) Experimental Design and Organization.” Geoscientific Model Development 9: 1937–1958.
- Feng, C., and B. Wu. 2015. “Enhancement of Winter Arctic Warming by the Siberian High Over the Past Decade.” Atmospheric and Oceanic Science Letters 8: 257–263.
- Gidden, M. J., K. Riahi, S. J. Smith, S. Fujimori, G. Luderer, E. Kriegler, D. P. Van Vuuren, et al. 2019. “Global Emissions Pathways Under Different Socioeconomic Scenarios for Use in Cmip6: A Dataset of Harmonized Emissions Trajectories Through the End of the Century.” Geoscientific Model Development 12: 1443–1475.
- Gu, L., J. Yao, Z. Hu, and L. Zhao. 2015. “Comparison of the Surface Energy Budget Between Regions of Seasonally Frozen Ground and Permafrost on the Tibetan Plateau.” Atmospheric Research 153: 553–564.
- Guo, D., and H. Wang. 2016. “CMIP5 Permafrost Degradation Projection:A Comparison among Different Regions.” Journal of Geophysical Research: Atmospheres 121: 4499–4517.
- Han, C., Y. Ma, X. Chen, and Z. Su. 2017. “Trends of Land Surface Heat Fluxes on the Tibetan Plateau from 2001 to 2012.” International Journal of Climatology 37: 4757–4767.
- Hu, G., L. Zhao, R. Li, X. Wu, T. Wu, X. Zhu, and Q. Pang. 2019. “Simulation of Land Surface Heat Fluxes in Permafrost Regions on the Qinghai-Tibetan Plateau Using CMIP5 Models.” Atmospheric Research 220: 155–168.
- Hu, G., L. Zhao, T. Wu, X. Wu, R. Li, X. Zhu, and D. Zou. 2022. “Long-Term Soil Temperature Dynamics of the Kunlun Pass Permafrost Region on the Qinghai-Tibetan Plateau.” Theoretical and Applied Climatology, 1–14.
- Jia, G. J., H. E. Epstein, and D. A. Walker. 2003. “Greening of Arctic Alaska, 1981–2001.” Geophysical Research Letters 30: 2067.
- Li, M., Y. Ma, W. Ma, Z. Hu, H. Ishikawa, Z. Su, and F. Sun. 2006. “Analysis of Turbulence Characteristics Over the Northern Tibetan Plateau Area.” Advances in Atmospheric Sciences 23: 579–585.
- Li, X., T. Wu, X. Zhu, Y. Jiang, G. Hu, J. Hao, and J. Ni. 2020. “Improving the Noah-MP Model for Simulating Hydrothermal Regime of the Active Layer in the Permafrost Regions of the Qinghai-Tibet Plateau.” Journal of Geophysical Research: Atmospheres 125: e2020JD032588.
- Li, R., L. Zhao, Y. Ding, T. Wu, Y. Xiao, E. Du, and G. Liu. 2012. “Temporal and Spatial Variations of the Active Layer Along the Qinghai-Tibet Highway in a Permafrost Region.” Chinese Science Bulletin 57: 4609–4616.
- Li, R., L. Zhao, T. Wu, Q. Wang, Y. Ding, J. Yao, X. Wu, et al. 2019. “Soil Thermal Conductivity and Its Influencing Factors at the Tanggula Permafrost Region on the Qinghai–Tibet Plateau.” Agricultural and Forest Meteorology 264: 235–246.
- Lund, M., C. Stiegler, J. Abermann, M. Citterio, B. U. Hansen, and D. van As. 2017. “Spatiotemporal Variability in Surface Energy Balance Across Tundra, Snow and Ice in Greenland.” Ambio 46: 81–93.
- Luo, D., H. Jin, L. Lü, and Q. Wu. 2014. “Spatiotemporal Characteristics of Freezing and Thawing of the Active Layer in the Source Areas of the Yellow River (Sayr).” Chinese Science Bulletin 59: 3034–3045.
- Ma, D., W. Boos, and Z. Kuang. 2014. “Effects of Orography and Surface Heat Fluxes on the South Asian Summer Monsoon.” Journal of Climate 27: 6647–6659.
- Ma, Y., S. Fan, H. Ishikawa, O. Tsukamoto, T. Yao, T. Koike, and H. Zuo. 2005. “Diurnal and Inter-Monthly Variation of Land Surface Heat Fluxes Over the Central Tibetan Plateau Area.” Theoretical and Applied Climatology 80: 259–273.
- Ma, J., R. Li, H. Liu, Z. Huang, T. Wu, G. Hu, and Y. Xiao. 2022. “The Surface Energy Budget and Its Impact on the Freeze-Thaw Processes of Active Layer in Permafrost Regions of the Qinghai-Tibetan Plateau.” Advances in Atmospheric Sciences 39: 189–200.
- Meng, F., L. Huang, A. Chen, Y. Zhang, and S. Piao. 2021. “Spring and Autumn Phenology Across the Tibetan Plateau Inferred from Normalized Difference Vegetation Index and Solar-Induced Chlorophyll Fluorescence.” Big Earth Data 5: 182–200.
- Mu, C., B. W. Abbott, A. J. Norris, M. Mu, C. Fan, X. Chen, and L. Jia. 2020. “The Status and Stability of Permafrost Carbon on the Tibetan Plateau.” Earth-Science Reviews 211: 103433.
- Obu, J., S. Westermann, A. Bartsch, N. Berdnikov, H. H. Christiansen, A. Dashtseren, and R. Delaloye. 2019. “Northern Hemisphere Permafrost map Based on TTOP Modelling for 2000–2016 at 1 km2 Scale.” Earth-Science Reviews 193: 299–316.
- Pepin, N., R. Bradley, H. Diaz, M. Baraer, E. Caceres, N. Forsythe, and H. Fowler. 2015. “Elevation-Dependent Warming in Mountain Regions of the World.” Nature Climate Change 5: 424–430.
- Przybylak, R. 2016. The Climate of the Arctic. Atmospheric and Oceanographic Sciences Library 52, Springer International Publishing Switzerland: 287.
- Rantanen, M., A. Karpechko, A. Lipponen, K. Nordling, O. Hyvärinen, K. Ruosteenoja, and T. Vihma. 2022. “The Arctic Has Warmed Four Times Faster Than the Globe Since 1980.” Communications Earth & Environment, 3,168.
- Rawlins, M. A., M. Steele, M. M. Holland, J. C. Adam, J. E. Cherry, J. A. Francis, and P. Y. Groisman. 2010. “Analysis of the Arctic System for Freshwater Cycle Intensification: Observations and Expectations.” Journal of Climate 23: 5715–5737.
- Riihelä, A., J. R. Key, J. F. Meirink, P. Kuipers Munneke, T. Palo, and K. G. Karlsson. 2017. “An Intercomparison and Validation of Satellite-Based Surface Radiative Energy Flux Estimates Over the Arctic.” Journal of Geophysical Research: Atmospheres 122: 4829–4848.
- Schaefer, K., H. Lantuit, V. E. Romanovsky, E. A. Schuur, and R. Witt. 2014. “The Impact of the Permafrost Carbon Feedback on Global Climate.” Environmental Research Letters 9: 085003.
- Serreze, M. C., A. P. Barrett, A. G. Slater, M. Steele, J. Zhang, and K. E. Trenberth. 2007. “The Large-Scale Energy Budget of the Arctic.” Journal of Geophysical Research 112: D11122.
- Trenberth, K. E., and J. T. Fasullo. 2009. “Changes in the Flow of Energy Through the Earth’s Climate System.” Meteorologische Zeitschrift 18: 369–377.
- Wang, J., S. Luo, Z. Li, S. Wang, and Z. Li. 2019. “The Freeze/Thaw Process and the Surface Energy Budget of the Seasonally Frozen Ground in the Source Region of the Yellow River.” Theoretical and Applied Climatology 138: 1631–1646.
- Wang, S., Y. Ma, and Y. Liu. 2022b. Simulation of Sensible and Latent Heat Fluxes on the Tibetan Plateau from 1981), to 2018” Atmospheric Research 271: 106129.
- Wang, X., Y. Ran, G. Pang, D. Chen, B. Su, R. Chen, and X. Li. 2022. “Contrasting Characteristics, Changes, and Linkages of Permafrost Between the Arctic and the Third Pole.” Earth-Science Reviews 230: 104042.
- Wang, X., M. Yang, and G. Wan. 2013. “Temporal-Spatial Distribution and Evolution of Surface Sensible Heat Flux Over Qinghai-Xizang Plateau During Last 60), Years”.” Plateau Meteorol 32: 1557–1567.
- Wang, C., K. Yang, and F. Zhang. 2020. “Impacts of Soil Freeze–Thaw Process and Snow Melting Over Tibetan Plateau on Asian Summer Monsoon System: A Review and Perspective.” Frontiers in Earth Science 8: 133.
- Wani, J. M., R. J. Thayyen, C. S. P. Ojha, and S. Gruber. 2021. “The Surface Energy Balance in a Cold and Arid Permafrost Environment, Ladakh, Himalayas, India.” The Cryosphere 15: 2273–2293.
- Westermann, S., J. Lüers, M. Langer, K. Piel, and J. Boike. 2009. “The Annual Surface Energy Budget of a High-Arctic Permafrost Site on Svalbard, Norway.” The Cryosphere 3: 245–263.
- Wild, M. 2020. “The global energy balance as represented in CMIP6 climate models.” Climate Dynamics 55: 553–577.
- Wu, G., A. Duan, Y. Liu, J. Mao, R. Ren, Q. Bao, and B. He. 2015. “Tibetan Plateau Climate Dynamics: Recent Research Progress and Outlook.” National Science Review 2: 100–116.
- Wu, J., B. Wang, Y. Yang, Y. Chang, L. Chen, J. Yang, and X. Liu. 2017. “Comparing Simulated Temperature and Precipitation of Cmip 3), and Cmip5 in Arid Areas of Northwest China.” Advances in Climate Change Research 13: 198.
- Wu, Q., and T. Zhang. 2010. “Changes in Active Layer Thickness Over the Qinghai-Tibetan Plateau from 1995), to 2007.” Journal of Geophysical Research: Atmospheres 115 (D9): D09107.
- Xie, J., Y. Yu, J.-l Li, J. Ge, and C. Liu. 2019. “Comparison of Surface Sensible and Latent Heat Fluxes Over the Tibetan Plateau from Reanalysis and Observations.” Meteorology and Atmospheric Physics 131: 567–584.
- Xu, L., R. Myneni, F. Chapin Iii, T. V. Callaghan, J. Pinzon, C. J. Tucker, Z. Zhu, and J. Bi. 2013. “Temperature and Vegetation Seasonality Diminishment Over Northern Lands.” Nature Climate Change 3: 581–586.
- Yang, K., Y.-Y. Chen, and J. Qin. 2009. “Some Practical Notes on the Land Surface Modeling in the Tibetan Plateau.” Hydrology and Earth System Sciences 13: 687–701.
- Yang, K., X. Guo, and B. Wu. 2011. “Recent Trends in Surface Sensible Heat Flux on the Tibetan Plateau.” Science China Earth Sciences 54: 19–28.
- Yang, S., R. Li, T. Wu, X. Wu, L. Zhao, G. Hu, and X. Zhu. 2021. “Evaluation of Soil Thermal Conductivity Schemes Incorporated Into CLM 5: 0. in Permafrost Regions on the Tibetan Plateau.” Geoderma 401: 115330.
- Yao, J., L. Gu, C. Yang, H. Chen, J. Wang, Y. Ding, and R. Li. 2020. “Estimation of Surface Energy Fluxes in the Permafrost Region of the Tibetan Plateau Based on in Situ Measurements and the Surface Energy Balance System Model.” International Journal of Climatology 40: 5783–5800.
- Yao, T., Y. Xue, D. Chen, F. Chen, L. Thompson, P. Cui, and T. Koike. 2019. “Recent Third Pole’s Rapid Warming Accompanies Cryospheric Melt and Water Cycle Intensification and Interactions Between Monsoon and Environment: Multidisciplinary Approach with Observations, Modeling, and Analysis.” Bulletin of the American Meteorological Society 100: 423–444.
- Yao, J., L. Zhao, L. Gu, Y. Qiao, and K. Jiao. 2011. “The Surface Energy Budget in the Permafrost Region of the Tibetan Plateau.” Atmospheric Research 102: 394–407.
- You, Q., X. Xue, F. Peng, S. Dong, and Y. Gao. 2017. “Surface Water and Heat Exchange Comparison Between Alpine Meadow and Bare Land in a Permafrost Region of the Tibetan Plateau.” Agricultural and Forest Meteorology 232: 48–65.
- Zhao, L., G. Cheng, S. Li, X. Zhao, and S. Wang. 2000. “Thawing and Freezing Processes of Active Layer in Wudaoliang Region of Tibetan Plateau.” Chinese Science Bulletin 45: 2181–2187.
- Zhao, L., D. Zou, G. Hu, E. Du, Q. Pang, Y. Xiao, and R. Li. 2020. “Changing Climate and the Permafrost Environment on the Qinghai–Tibet (Xizang) Plateau.” Permafrost and Periglacial Processes 31: 396–405.
- Zhao, L., D. Zou, G. Hu, T. Wu, E. Du, G. Liu, Y. Xiao, et al. 2021. “A Synthesis Dataset of Permafrost Thermal State for the Qinghai–Tibet (Xizang) Plateau, China.” Earth System Science Data 13: 4207–4218.