
 ?Mathematical formulae have been encoded as MathML and are displayed in this HTML version using MathJax in order to improve their display. Uncheck the box to turn MathJax off. This feature requires Javascript. Click on a formula to zoom.
ABSTRACT
Semantic segmentation for remote sensing images faces challenges of unbalanced category weight, rich context causing difficulties of recognition, blurred boundaries of multi-scale objects, and so on. To address these problems, we propose a new model by combining HRNet with attention mechanisms and dilated convolution, denoted as: AD-HRNet for the semantic segmentation of remote sensing images. In the framework of AD-HRNet, we obtained the weight value of each category based on an improved weighted cross-entropy function by introducing the median frequency balance method to solve the issue of class weight imbalance. The Shuffle-CBAM module with channel attention and spatial attention in AD-HRNet framework was applied to extract more global context information of images through slightly increasing the amount of computation. To address the problem of blurred boundaries caused by multi-scale object segmentation and edge segmentation, we developed an MDC-DUC module in AD-HRNet framework to capture the context information of multi-scale objects and the edge information of many irregular objects. Taking Postdam, Vaihingen, and SAMA-VTOL datasets as materials, we verified the performance of AD-HRNet by comparing with eight typical semantic segmentation models. Experimental results shown that AD-HRNet increases the mIoUs to 75.59% and 71.58% based on the Postdam and Vaihingen datasets, respectively.
1. Introduction
Aerial images collected from satellites and aviation platforms are an important basis for realizing urban scene perception, resource management, natural disaster detection, ecological environment investigation (Li, Yao, and Zhenfeng Citation2015; Zhang et al. Citation2020), and so on.
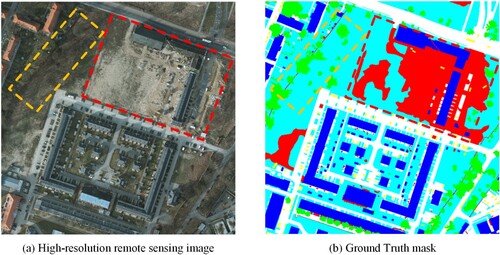
Semantic segmentation as the key step in realizing automatic analysis and utilization of remote sensing images in the above applications takes some raw image data as input and converts them into a mask with highlighted regions of interest. The traditional methodology for semantic segmentation of remote sensing images mainly applied manual inspection or machine learning algorithms, such as SIFT (Ke and Sukthankar Citation2004), HOG (Wang, Han, and Yan Citation2009), N-cut (Shi and Malik Citation2000), and so on, to extract the relevant features from the image data for subsequent processing and analysis. Unfortunately, these approaches are time-consuming, laborious, costly, and unable to achieve good generalization (Zhu et al. Citation2017; Ching et al. Citation2018). With the development of artificial intelligence and computation performance, deep-learning-based models have been widely applied in various fields related to computer vision such as biomedicine (Ching et al. Citation2018), satellite remote sensing (Zhu et al. Citation2017), city perception (Dubey et al. Citation2016), automatic driving (Grigorescu et al. Citation2020), and so on. Semantic segmentation, as a subfield of computer vision, has also made a significant breakthrough (Long, Shelhamer, and Darrell Citation2015; Ronneberger, Fischer, and Brox Citation2015; Sun, Zhao, et al. Citation2019). However, challenges for semantic segmentation based on high-resolution remote sensing images using current technologies still exist. First, remote sensing images have an extremely imbalanced category weight distribution (Kampffmeyer, Salberg, and Jenssen Citation2016; Leichtle et al. Citation2017), which leads to the segmentation accuracy of a class with low weight being far lower than that of a class with high weight. As shown in , the proportion of different categories of targets in the data set is unbalanced. For example, the proportion of car is much lower than that of other categories. Secondly, remote sensing images generally have high resolution and rich context information, but many current semantic segmentation models fail to utilize all available global context information (Zhang et al. Citation2020). Thirdly, objects in remote sensing images always have large-scale changes, and the boundary of objects is blurry, which is not conducive to segmentation (Deng et al. Citation2018). As we can see from , the objects in the red and yellow boxes in the figure are very hard to identify. Therefore, effectively solving above problems is the key to improve the accuracy of remote sensing semantic segmentation.
Figure 1. Proportion of pixels of six categories in Potsdam dataset.
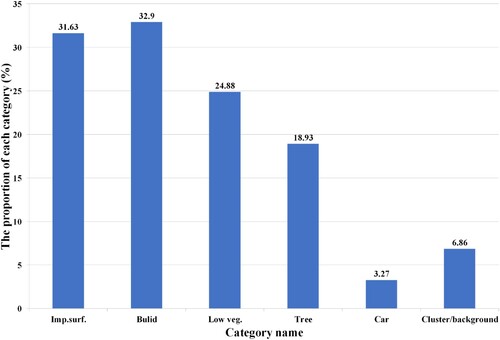
Figure 2. Illustration of high-resolution remote sensing image segmentation example. Field of vision of remote sensing image is large, but scale diversity of objects in image is high, and edge is irregular.
To address these issues, we propose a targeted semantic segmentation model by combining the HRNet with attention mechanisms and dilated convolution (denoted as: AD-HRNet). The proposed AD-HRNet used the improved weighted cross-entropy loss function by introducing the median frequency balance to obtain the weight of each category, thus reducing the impact of class imbalance. Then, based on the performance of CBAM (Woo et al. Citation2018), we designed a Shuffle-CBAM module by adding the attention mechanism to the AD-HRNet, which aimed to decrease computational expense and increase the efficiency of global context information during semantic segmentation. Also, we constructed a mixed dilated convolution + dense upsampling convolution (MDC-DUC) module in the AD-HRNet framework to improve recognition accuracy by extending the receptive field. By applying a learnable upsampling method in the framework of AD-HRNet, the missing details such as segmentation boundary, object edge, and so on, are obtained and recovered. We compared our model with the original version of HRNet model and other typical deep-learning-based methods by using the Potsdam, Vaihingen, and SAMA-VTOL datasets. The results shown that the mIoU of semantic segmentation by using the proposed AD-HRNet based on the first two datasets achieved to 75.59% and 71.58%, respectively, which had gone up by 0.74%, 0.73%, over the original version of HRNet, respectively. In addition, the relevant ablation experiments based on Postdam and Vaihingen datasets and generation test by using ASMA-VTOL also verified the effectiveness of our designed modules. In summary, the contributions of this study include:
We proposed an improved HRNet model: AD-HRNet, which deals with relevant problems of aerial remote sensing semantic segmentation by adding the designed modules including pre-processing module, Shuffle-CBAM module, and MDC-DUC module. Specifically, the improved weighted cross-entropy loss function module improves the segmentation accuracy of small targets; Shuffle-CBAM module effectively uses the global context information of images and improves the segmentation accuracy with less computational expense; MDC-DUC module solves the problem of low precision of edge segmentation of multi-scale objects and irregular objects.
The efficiency of AD-HRNet model has been demonstrated by numerous tests. The experimental results illustrated that the performance of the proposed AD-HRNet was better than the other eight typical semantic segmentation models (e.g. U-Net, FCN, CCNet, DeeplabV3, DANet, OCRNet, and UNetFormer) based on three benchmark datasets including Potsdam, Vaihingen, and SAMA-VTOL datasets.
2. Related work
2.1. General semantic segmentation
Semantic segmentation is a typical computer vision problem that takes some original data (e.g. plane images, remote sensing images, and panoramic images) as input and converts them into masks with highlighted regions of interest. Semantic segmentation as a basic task in the field of computer vision has a significant impact on the development of urban scene analysis (Zhang et al. Citation2018), remote sensing image processing (Diakogiannis et al. Citation2020), automatic driving (Treml et al. Citation2016), and other fields. Early semantic segmentation is mainly conducted based on the traditional algorithms such as grey scale segmentation (Panda and Rosenfeld Citation1978) and conditional random fields (Plath, Toussaint, and Nakajima Citation2009). Since FCN (Fully Convolutional Networks) was used for semantic segmentation of images (Long, Shelhamer, and Darrell Citation2015), deep neural-based networks have gradually become mainstream in the image semantic segmentation field due to its performance. The existing approaches on deep-learning-based semantic segmentation for images mainly included two modes. The first one is based on encoder–decoder structure, e.g. U-net (Ronneberger, Fischer, and Brox Citation2015), SegNet (Badrinarayanan, Kendall, and Cipolla Citation2017), and DeepLab series (Chen et al. Citation2017; Chen et al. Citation2017). And the other one maintains the high-resolution representation by high-resolution convolution, e.g. HRNet (Sun, Zhao, et al. Citation2019). In addition, using dilated convolution (P. Wang et al. Citation2018) and deformable convolution (Dai et al. Citation2017) to replacing the conventional convolution was also a common way to adjust the receptive field for some semantic segmentation models. Apart from that, the development of Transformer-based algorithms in the field of computer vision in recent years (Dosovitskiy et al. Citation2020) also promoted the application of semantic segmentation model with attention mechanism. However, thus far, for complex scenes, making full use of the context information of images and accurately segmenting multi-scale objects with irregular shapes and fuzzy boundaries are still a difficult task. A complex external environment (e.g. sunshine, clouds, and occlusion) also increases the difficulty of semantic segmentation.
2.2. Semantic segmentation of remote sensing imagery
At present, the remote sensing images have been widely used in many fields of society, such as natural disaster monitoring (Dong and Shan Citation2013; Joyce et al. Citation2009), land resource management (Alqurashi and Kumar Citation2013), ecological environment investigation (Kerr and Ostrovsky Citation2003; Song et al. Citation2020), and so on. The basis of these studies or applications is to accurately and efficiently segment remote sensing images based on targets’ category. Therefore, semantic segmentation technology has received much attention in the field of remote sensing. For example, Kemker, Salvaggio, and Kanan (Citation2018) applied a DCNN full-convolution network to the semantic segmentation of multispectral remote sensing images and obtained good results on their RIT-18 dataset. Diakogiannis et al. (Citation2020) developed a new semantic segmentation architecture (named as: ResUNet-a) and a novel loss function based on Dice loss to get reliable and efficient segmentation results from high-resolution aerial remote sensing images. Seong and Choi (Citation2021) constructed a semantic segmentation model combined with a multi-attention mechanism (denoted as: CSAG-HRNet model) to enhance the extraction of buildings. Du et al. (Citation2021) illustrated a novel semantic segmentation method for remote sensing by combining Deeplabv3+ and object-based image analysis (OBIA). Liu et al. (Citation2022) built a novel residual ASPP block with attention net and named it as RAANet to acquire more scale information by introducing attention mechanism. The disadvantage is that it will increase the amount of calculation, and at the same time, it can’t solve the problems of class imbalance and low accuracy of object boundary recognition. With the development of transformer in the field of computer vision, semantic segmentation method based on transformer has sprung up. For instance, Meng et al. (Citation2022) proposed a class-guided Swin transformer method for semantic segmentation of remote sensing images, which enhanced the utilization of Vit in obtaining global information. However, in terms of local information acquisition, transformer-based model is weaker than CNN-related models. Therefore, Class-guided Swin Transformer cannot solve the problem of low accuracy of object boundary recognition. Wang et al. (Citation2022) established an UNetFormer based on the encoder–decoder architecture for segmenting urban scene in real-time. They also developed a global-local attention mechanism to get the global and local information of images. Both UNetFormer and our proposed model take into account the importance of obtaining global and local information about an image, but our model is better at resolving object boundary ambiguities and class imbalances than the encoder–decoder architecture used by UNetFormer.
2.3. Attention mechanism
The attention mechanism is important for capturing the global information of images. There are three kinds of attention mechanism in the field of computer vision: spatial attention, channel attention, and spatial-channel mixed attention (Liu et al. Citation2021). The spatial attention mechanism is an adaptive spatial region selection mechanism whose purpose is to obtain the context dependence between pixels (X. Wang et al. Citation2018). For example, ViT (Dosovitskiy et al. Citation2020) and Non-Local (X. Wang et al. Citation2018) models applied spatial attention mechanism to achieve target detection, semantic segmentation, and other basic tasks. In a deep neural network, different channels of different feature maps generally represent different objects. The channel attention mechanism evaluates the importance of each feature channel and then enhances or suppresses different channels for different categories to determine the attention position (Guo et al. Citation2022). At present, the representative neural network model using channel attention is the SENet (Hu, Shen, and Sun Citation2018). The basic idea of the SENet model is to add a bypass branch after the normal convolution operation, sequentially perform the squeeze operation and the excitation operation to obtain the weight of each feature channel, and then apply the weight to the original feature channel to learn the importance of different channels. Using the spatial-channel mixed attention mechanism is better than the other two kinds of attention mechanism. However, it also inevitably leads to an increase in memory occupation and computational expense (Zhang and Yang Citation2021). So, we should pay attention to a trade-off between accuracy, time, and video memory when using the double attention mechanism. Beyond that, the well-known models based on dual attention mechanism are CBAM (Woo et al. Citation2018), BAM (Park et al. Citation2018), and DANet (Fu et al. Citation2019). The attention mechanism used in these models can obtain context information and get a better result during semantic segmentation for images. However, how to construct a suitable attention module for remote sensing images is still a hot topic in the field of sematic segmentation because of its characteristics of large size and rich information.
3. Methodology
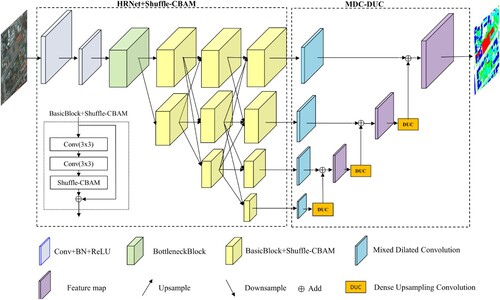
By analysing the limitations of the present models for semantic segmentation of remote sensing images, we constructed a novel framework (named as AD-HRNet) by combining the HRNet with attention mechanisms and dilated convolution, as shown in . In our model, we improved the original version of HRNet by introducing the designed Shuffle-CBAM attention module and Mixed Dilated Convolution+ Dense Upsampling Convolution (MDC-DUC) module whilst maintaining the traditional advantages of it. Specifically, we used the improved weighted cross-entropy function to replace the original cross-entropy function in the architecture of HRNet, which was to solve the problem of class imbalance during semantic segmentation. We added an attention mechanism to each module of HRNet and fused the information of feature maps in the dimensions of channel and space without causing too much calculation. It should be noted that we designed a Shuffle-CBAM module and added it to the end of each basic block of the original version of HRNet, as shown in . In addition, we also added a new module MDC-DUC to the proposed AD-HRNet, which is used to increase the diversity of receptive fields through mixed convolution blocks and solve the ‘gridding’ problem caused by conventional expansion convolution. In the framework of AD-HRNet, we used the learnable upsampling convolution to replace the traditional bilinear interpolation method in the architecture of HRNet to capture and recover the missed details. The final semantic segmentation feature map is obtained by layer-by-layer fusion.
Figure 3. The structure of the proposed AD-HRNet.
3.1. Brief introduction for HRNet structure
Most existing semantic segmentation models based on the encoder-decoder architecture used high-to-low-resolution encoders connected in series to extract feature maps and then restored the high-resolution representation through the corresponding decoders. However, the disadvantage of this idea is that the encoder generates a fuzzy feature map with a high probability after multiple convolutions for feature extraction, and some edge details and small target objects will be lost. The HRNet model is the first one to be used for human posture estimation (Sun, Xiao, et al. Citation2019). It uses the high-resolution convolution to keep a high-resolution representation of a branch all the time and applies the module to fuse the feature maps of parallel low-resolution convolution for enhancing the representation. In the original HRNet (Sun, Zhao, et al. Citation2019) network, the input image is down sampled to a quarter of the original image by two 3 × 3 convolutions. Then, two characteristic images with different sizes are output by one bottleneck block. Next, three groups of basic blocks with different channel numbers are connected. The structural designs of the bottleneck block and basic block follow the principle of ResNet (He et al. Citation2016). Finally, four feature maps with different sizes and dimensions are reshaped into the size of the high-resolution subnet by bilinear interpolation, and the output is determined by a 1 × 1 convolution layer.
3.2. Improved modules of AD-HRNet
Taking HRNet as the basic architecture, we proposed a novel model AD-HRNet by using the following modules.
3.2.1. The improved weighted cross-entropy loss
By considering the limitation of loss function used in the HRNet model, e.g. unable to solving the class imbalance problem, we applied an improved weighted cross-entropy loss function to solve this issue during semantic segmentation. It should be noted that the weighted cross-entropy loss was firstly proposed by Khoshboresh-Masouleh, Alidoost, and Arefi (Citation2020) to solve the class imbalance problem. In this study, we modified it by adding the median frequency balance method (Badrinarayanan, Kendall, and Cipolla Citation2017) to get the weight of each category to further weaken the impact of class imbalance and enhance the segmentation accuracy of targets with a small proportion in images. The conventional cross-entropy loss function in the framework of AD-HRNet can be calculated based on Equation (1).
(1)
(1) where y is the real category label, p is the predicted probability of the corresponding category, and N is the batch size.
To alleviate the problem of class imbalance during semantic segmentation, we calculate the corresponding weight of each category by the following formulas.
(2)
(2)
(3)
(3) where
is the weight of the category, pi is the proportion of each category in the images, i = 1, 2, … , n. The parameter m is the median of the dataset P which is composed by pi and can be denoted as: P = [p1, p2, … , pn]. The parameter ni is the number of images with corresponding category and ntotal is the total number of images of all categories.
We add the computation equation of the corresponding weights of each category into the standard cross-entropy loss function and obtain the final weighted cross-entropy loss formula, as shown in Equation (4).
(4)
(4) The Equation (4) is the final loss function of the proposed AD-HRNet. The parameter
is the set of weights for all kinds of categories. The variables
and
are the ground truth and predict result, respectively.
3.2.2. Shuffle-CBAM
As we have illustrated in the section of literature review, the present attention mechanisms applied in the field of computer vision have some limitations such as increasing the computational expense by using spatial-channel mixed attention mechanism (Zhang and Yang Citation2021). By analysing the features of CBAM (Woo et al. Citation2018), we developed a more lightweight attention module, named as: Shuffle-CBAM. The structure of the Shuffle-CBAM is shown in .
Figure 4. The structure diagram of Shuffle-CBAM module. We reduce number of feature maps through spatial attention block and channel attention block by grouping strategy to reduce amount of computation required, and then use ‘channel shuffle’ to interact with information between feature maps to obtain global context information.
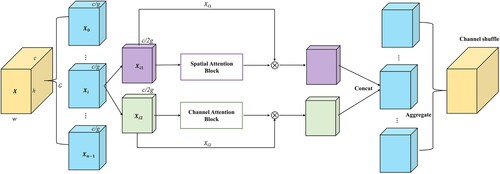
As shown in , the main idea of Shuffle-CBAM is to divide the input feature maps into several groups according to the number of channels first. Then, feature maps belonging to each group are further categorized into two groups based on the dimensions. The spatial attention and channel attention mechanism are, respectively, applied for sub-feature maps of each group. At the final steps of Shuffle-CBAM, all sub-features are aggregated and then interacted by using a channel shuffle mechanism. Details of two kinds of attention modules including spatial attention block and channel attention block applied in the Shuffle-CBAM architecture are shown in .
Figure 5. Detailed design of spatial attention and channel attention blocks. Attention is largely designed to be similar to CBAM, with certain tweaks in details to make our Shuffle-CBAM modules more efficient.
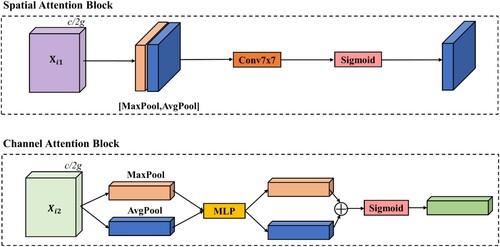
As we can see from , in the spatial attention block, given a feature map where C, H, and W represent the channel number, height, and width of it, respectively. First, the feature map
is grouped according to the dimension of the channels. We set the group number
as a super parameter, but we must ensure that
is divisible by the channel number
. After grouping, feature map
is divided into
group
. In the channel attention block, the feature map
is divided into two groups according to the channel dimension, denoted as:
. Through the operations of parallel average pooling and maximum pooling for
, we obtain two 2D feature maps:
and
. The generated feature maps are concatenated to generate effective feature representations, and then a standard 7 × 7 convolutions are used to generate spatial attention maps. Meanwhile, two different spatial context feature vectors
and
are generated by using average pooling and maximum pooling for
. The spatial context features vectors
and
are sent to a shared network composed by a multilayer perceptron to generate a channel map
. Finally, the output feature vectors are fused by summing the elements.
The formulas of spatial attention and channel attention are shown as follows.
(5)
(5) where
denotes executing a standard 7 × 7 convolution operation,
is the operation of concatenating tensors according to channel dimensions,
executes an average pooling operation,
executes a maximum pooling operation,
is the grouped feature map, and
is the spatial attention map of the final output. Here, the reason why we used a standard 7 × 7 convolution operation is because it can get the best results (Woo et al. Citation2018).
(6)
(6) where
denotes the activation function,
executes the multilayer perceptron operation,
is the grouped feature map, and
is the channel attention map of the final output. Other symbols in Equation (6) are same with Equation (5).
It should be noted that we used a similar method to ShuffleNet (Ma et al. Citation2018) to aggregate all sub-features. That is, we use the ‘channel shuffle’ to enable information exchange between different groups. We keep the input feature map and output feature map through the Shuffle-CBAM module consistent in size to maintain the good scalability of our module.
3.2.3. MDC-DUC
Dilated convolution is commonly used to replace regular convolution to extend the receptive field of convolutional kernel, which can obtain more effective information and improve the segmentation accuracy through a small amount of calculation during semantic segmentation (P. Wang et al. Citation2018). However, due to the existence of the dilated rate, the convolutional kernel is dispersed, which causes discontinuity in information acquisition and a serious grid effect. Bilinear interpolation (Gribbon and Bailey Citation2004) is a conventional upsampling method used by many semantic segmentation models including HRNet. The advantage of bilinear interpolation is that the calculation is simple and fast. Since bilinear interpolation predicts the pixel value of the sample point by several nearby pixels, it inevitably causes the loss of image details which reduces the segmentation accuracy. In this study, we construct an MDC-DUC module to replace the bilinear interpolation module in the original version of HRNet by considering both advantages of MDC (Mixed Dilated Convolution) and DUC (Dense Upsampling Convolution) blocks, as shown in . In MDC-DUC module, the DUC block is applied to recover more missing detailed information. The proposed MDC block is embedded to the four parallel outputs of the original HRNet to expend the diversity of the receptive field, thus increasing the semantic accuracy at pixel-level, as shown in . Specifically, the designed MDC block in this study is consisting of a dilated convolution with three different dilation rates (e.g. d = 1, 2, 5). The relevant formula for the dilated convolution is as follows.
(7)
(7) where
is the size of the input convolutional kernel,
is the dilated coefficient, and
is equal to convolutional kernel size after dilated operation.
Figure 6. For structural design of MDC, we fused input feature map and output feature map of MDC to obtain more accurate results.
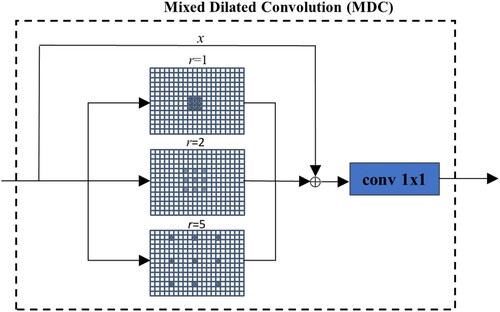
Based on EquationEquation 7(7)
(7) , we can see that the receptive field of our MDC block is equivalent to the standard convolution. That is the receptive field of the convolutional kernel includes 3, 5, and 11. The size formula for the output of the convolutional layer is shown in Equation (8).
(8)
(8) where
is the feature map dimensions entered,
is the feature map dimensions of the output,
is the size of pooling,
is stride, and
represents a rounding-down operation. The convolutional kernel size is 3 × 3, so when step size
is equal to 1 and pool size
is equal to the expansion coefficient
, the input and output feature plot sizes are equal. The purpose of designing the MDC block is to capture more semantic information and to make convolutions operable on the feature map of the complete input with no missing regions. The dilated rate used in this paper refers to the mixed dilated convolution principle of Wang et al. (Citation2018). The advantage of using this expansion rate is to minimize the grid effect of the expansion convolution while maximizing the effective information of different scale targets. In addition, we analysed the structure of ResNet and Expansion convolutional blocks with skip connections and proposed a new strategy for adding the skip connection. Specifically, we perform a concatenation operation between the feature map of the mixed convolutional output and the original feature map of the input. This can further replenish the features in the previous feature map of the expanded convolutional block. Then, we use a 1 × 1 convolution to fuse the feature during feature map connection and reduce the subsequent operation amount (see ).
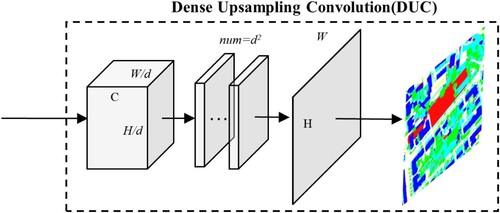
In this study, the DUC block is used to replace the bilinear interpolation used in the original version of HRNet (Sun, Zhao, et al. Citation2019), as shown in . The main idea of the DUC is to use the number of channels to compensate for the loss of feature map size caused by the previous convolution operation such as bilinear interpolation. In addition, DUC is a learnable module that can recover image details better than bilinear interpolation. Assuming to enter an image , where
are the number of channels, height, and width of the image, respectively. The model outputs a label map with a size of
and assigns a corresponding category label to each pixel of the map. Suppose the feature map outputted from the MDC block output is
, where
,
, and
are the sampling factors. The specific function of DUC is to reshape the feature map
into
through a 3 × 3 convolution. And the feature map
is reshaped into a feature map
again. Therefore, the number of channels of the final generated feature map is
, the height is
, and the width is W. DUC uses convolution operations directly on the feature plot of the mixed dilated convolutional output to obtain a label map with a final output size of
. We upsampled three feature maps with smaller sizes using their corresponding DUCs and then fused them layer by layer.
Figure 7. The structure diagram of DUC.
4. Experiment
4.1. Experimental setting and evaluation metrics
In this study, we implemented the proposed network model by using Python (version 3.8.2) and PyTorch (version 1.4.0) on workstations containing two NVIDIA GEFORCE RTX 2080Ti blocks. During model training, we utilized an SGD optimizer with the base learning rate of 0.01, the momentum of 0.9 and a weight decay coefficient of 0.0004. The improved weighted cross-entropy function illustrated in Section 3.2.1 was used as the loss function. The batch size was set as 16 and 32 in training process and testing process, respectively. The number of epochs by using Potsdam dataset and Vaihingen dataset was, respectively, 484 and 100 during training, thereby achieving the best performance of the model on 2 GPUs and syncBN. Meanwhile, the augmentation techniques such as random scale and flip were also used during training process. We compared our proposed AD-HRNet with the original version of HRNet and other seven representative classical semantic segmentation models (e.g. U-Net, FCN, CCNet, DeeplabV3, DANet, OCRNet, and UNetFormer) by using these two datasets. In addition, we performed ablation experiments on the individual components to demonstrate the effectiveness of the proposed modules including the improved weighted cross-entropy function at the pre-process module, Shuffle-CBAM module and MDC-DUC module. The generation experiment was also conducted by using the SAMA-VTOL dataset (Bayanlou and Khoshboresh-Masouleh Citation2021) to validate the effectiveness of the proposed AD-HRNet. The evaluation metrics we used included the overall accuracy, precision, recall, and overall and individual mIOU and F1-score for each category, all of which were related to the confusion matrix shown in .
Table 1. Confusion matrix.
Our evaluation index selection follows the general guidelines in the field of semantic segmentation, including the overall accuracy (OA), precision, recall, F1-score, and mean intersection computed over the union (mIoU) (Xu et al. Citation2020). The formulas of these evaluation indices are shown below.
(9)
(9)
(10)
(10)
(11)
(11)
(12)
(12)
(13)
(13) where
, and
are the true positive, true negative, false-positive, and false negative pixels in the prediction map, respectively.
4.2. Dataset
We mainly experimented the proposed AD-HRNet on ISPRS 2D Semantic Segmentation Benchmark Dataset. The ISPRS 2D semantic segmentation benchmark dataset includes the Potsdam and Vaihingen datasets, both of which are freely available. This dataset consists of six categories: impervious surfaces, buildings, low vegetation, trees, cars, and clusters/backgrounds. Details about these two datasets and their pre-processing method are listed in .
Table 2. Dataset settings.
Potsdam as one of the most used datasets in the field of remote sensing semantic segmentation, contains 38 6000 × 6000 pixel drone images collected over the city of Potsdam. We divided it into two parts: training sets including 24 photos and testing sets including 14 photos based on the method proposed by Li et al. (Citation2021). Since these high-resolution images are too large to train directly using the common hardware, we split each photo into 512 × 512 patches. To avoid the integrity impact of the splitting, we used a 96-pixel overlap. In the end, we obtained a training set of 5400 images and a test set of 3150 images.
The Vaihingen dataset has numerous independent items and tiny multistorey buildings despite being a very small dataset. This dataset contains 33 remote sensing images ranging in size from 1996 × 1995 to 3816 × 2550, with the same category classification as the Potsdam dataset. In this paper, 16 images are selected as the training set and 17 images as the test set. These images are also split into 512 × 512 patches, and the overlap of 96 pixels is used to avoid the adverse effects of splitting. After the splitting is completed, a training set containing 479 images and a test set of 555 images are obtained.
Apart from these two datasets, we also applied the SAMA-VTOL dataset to validate the effectiveness of the proposed model (Bayanlou and Khoshboresh-Masouleh Citation2021). The SAMA-VTOL dataset consists of much larger multi-task information and is suitable for learning. In SAMA-VTOL dataset, 10 kinds of targets are defined for the semantic segmentation task, including water, ground, parcel boundary, waste object, vehicle, farmland, vegetation, building shadow, building, and vegetation. Although the website of SAMA-VTOL introduced it, there was no public training data providing for users. The providers of SAMA-VTOL only publicized one testing image for users. Therefore, we used it to validate the generation of AD-HRNet model.
4.3. Experimental results
4.3.1. Comparisons between AD-HRNet and other typical models
To validate the performance of the proposed AD-HRNet, we compared it with other eight typical semantic segmentation models based on Potsdam and Vaihingen datasets, including U-Net (Ronneberger, Fischer, and Brox Citation2015), FCN (Long, Shelhamer, and Darrell Citation2015), CCNet (Huang et al. Citation2019), DeeplabV3 (Chen et al. Citation2017), DANet (Fu et al. Citation2019), OCRNet (Yuan et al. Citation2019), UNetFormer (Wang et al. Citation2022), and the original version of HRNet (Sun et al. Citation2019). The best results of each evaluation index in all tables are highlighted in bold.
Table 3. Comparisons of segmentation performance based on Potsdam dataset.
Based on the statistics shown in , AD-HRNet model achieved a better performance in the W18 and W48 versions than other models. It should be noted that the W18 and W48 represent the width of the high-resolution convolution. By comparing with the original version of HRNet_W18, the proposed AD-HRNet_W18 increased the overall values of mIoU and F1 score by 0.95% and 0.72%, respectively. In addition, the performance of semantic segmentation for high-resolution images by using AD-HRNet_W48 was also improved. The overall values of mIoU and F1 score of AD-HRNet_W48 were, respectively, increased by 0.74% and 0.54% by comparing with HRNet_W48. Although the statistics shown in illustrate that the overall values of mIOU and F1 scores by using UNetFormer are better than other models (e.g. U-Net, FCN, CCNet, DeeplabV3, DANet, and OCRNet), the performance of AD-HRNet is still better than it. According to the visualization results by using these models, UNetFormer was good at obtaining global information. But it fails to recognize the targets with small weight and the edges of multi-scale objects. Beyond that, the comparisons with other typical semantic segmentation models also show that AD-HRNet significantly improved the value of mIoU of each category except for identifying cars based on AD-HRNet_W48, as shown in . Here, the reason why the proposed model for recognizing cars is not better than HRNet_48 because the weight value of cars in Postdam is too small. Also, the edge of many cars is connected with other targets such as Tree and Cluster, thus affecting the final improvement.
Table 4. mIoU and IoU scores for each category on Potsdam dataset.
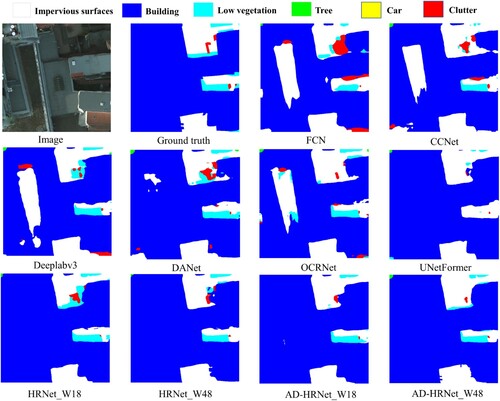
We visualized the semantic segmentation results of all compared models in . As we can see from , the proposed model can accurately segment different objects and is superior to other models in the integrity and edge of segmentation. In addition, it can also identify small objects well. For example, the proposed AD-HRNet can identify buildings without small area vacancy by comparing with other models. The connectivity of the recognized targets is also kept well. In addition, in , we can find that the proposed AD-HRNet can roughly identify the overall structure of the low vegetation class, while other models perform ordinarily in the aspects of segmentation integrity and detail edges.
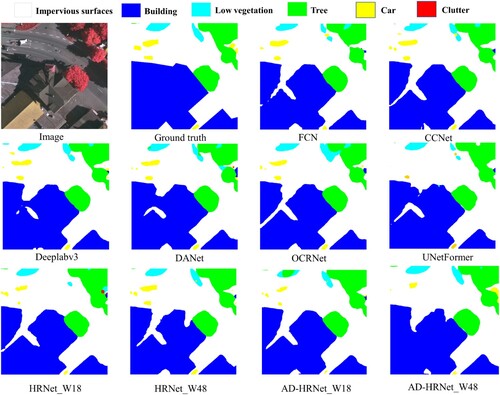
Figure 8. Prediction graph visualization results of each model on Potsdam dataset.
shows the comparisons of the proposed model with other semantic segmentation models by using Vaihingen dataset. The experimental results indicated that the proposed AD-HRNet_W18 improves the overall value of mIoU by 1.51% and F1 score by 1.43% relative to HRNet_W18. Meanwhile, AD-HRNet_W48 improves the overall value of mIoU and F1 score by 0.73% and 0.61%, respectively, by comparing with HRNet_W48.
Table 5. Comparisons of segmentation performance based on Vaihingen dataset.
illustrates the comparisons of AD-HRNet with other models for each category segmentation. According to the statistical values in , we can find the value of mIOU and F1 score for classes of Imp. Surf, Build, Car, and Cluster by using AD-HRNet_W18 are higher than HRNet_18. For AD-HRNet_48, the value of mIoU for segmenting the classes of Low veg., Tree, Car, and Cluster is higher than HRNet_48. In , we also find that the proposed AD-HRNet no matter with W18 or W48 version, the value of mIoU of some classes is not better than HRNet. By analysing the reasons, we found that our model mainly improved the value of mIoU for some small targets. Meanwhile, it also gets more accurate results for edge segmentation. However, this advantage also makes targets with a high weight and blurred edges are segmented into several pieces, thereby reducing the accuracy of segmentation.
Table 6. mIoU and IoU scores for each category on Vaihingen dataset.
also shows the visualization of semantic segmentation by using Vaihingen dataset. By comparing with other models, the proposed AD-HRNet identified targets without causing many empty areas, e.g. Building segmentation. For segmenting the classes of Tree and Low vegetation, the proposed AD-HRNet can get more details of target edges than other models.
Figure 9. Prediction graph visualization results of each model on Vaihingen dataset.
Based on the quantitative analysis by using two different typical data sets, we find that the performance of AD-HRNet_W18 in sematic segmentation of high-resolution images has a higher promotion by comparing with AD-HRNet_W48. Although the proposed AD-HRNet achieved a better performance than HRNet, improvements are still needed in the future work. For example, how to improve the parallel structure to increase the performance of semantic segmentation in W-48 versions. In addition, the proposed model in this study improved the segmentation results by using both Potsdam and Vaihingen datasets, and the improvement on Vaihingen dataset is slightly larger than that of Potsdam dataset. This may be because the volume of training data of Potsdam dataset is higher than Vaihingen dataset while HRNet also can obtain the global information during training, which make it can recognize edges of targets during testing. For Vaihingen dataset, the proportion of building category is very large which increases the complexity of edge information. In this study, we added the module e.g. MDC-DUC to the framework of AD-HRNet to solve this issue. The experimental results shown the improvement by using Vaihingen dataset is bigger than Potsdam dataset, as shown in and .
Beyond that, we evaluated the stability of our model by setting the epoch to 100 and 484, respectively, based on Postdam dataset and further compared the performance of AD-HRNet with HRNet based on the evaluation indexes illustrated in Section 4.1 (see ). The statistical results shown that the value of mIoU and F1 score by using AD-HRNet is gone up by 0.54% and 0.38% above the HRNet when the number of epochs is set to 100. The performance of training results gets further enhanced after we increased the number of epochs to 484. This test indicates that the proposed model keeps a better performance than HRNet no matter the number of epochs is less or more. Moreover, we conducted five repeated experiments based on the proposed model by using Postdam dataset. The results shown in above tables are on a medium performance. The standard deviations of mIoU and F1 score computed based on these repeated tests were 0.32 and 0.25, respectively.
Table 7. Evaluation results by setting the number of epochs to 100 and 484, respectively.
4.3.2. Ablation experiment
To demonstrate the effectiveness of each module, we conducted ablation experiments by using Potsdam and Vaihingen datasets. These models were evaluated based on the indices illustrated in Section 4.1. For the convenience of analysis, the best results of each evaluation index in the table are highlighted in bold, as shown in .
Table 8. Ablation experiments on Potsdam dataset.
Based on the experimental results, we can find that the Shuffle-CBAM module and the MDC-DUC module played a certain role in improving the segmentation ability of HRNet by using the Potsdam dataset. The values of mIoU and F1 increased by 0.68% and 0.48%, respectively, by integrating the Shuffle-CBAM module into the framework of HRNet. Additionally, the values of mIoU and F1 improved by 0.81% and 0.57%, respectively, by integrating the MDC-DUC module again into the framework of HRNet. In , the proposed AD-HRNet improved mIoU and F1 by 0.95% and 0.72%, respectively, by comparing with HRNet. In this study, we used the improved weighted cross-entropy loss function to balance the identification ability for targets with different weights. Although the improvement by using the improved weighted cross-entropy is not obvious by comparing with other modules, it is still effective based on the experimental results shown in .
To validate the performance of the modules added in the AD-HRNet more intuitively, we visualize the experimental results by using the Postdam dataset (see ). For semantic segmentation task of remote sensing images, it is very difficult to identify the shape and boundary of incomplete multi-scale objects and irregular objects. In (c), we can find the original version of HRNet model cannot solve this problem well. By using dilated convolution to expand the receptive field of the convolution kernel to obtain more local information and applying dense upsampling convolution to reduce the information loss during upsampling, HRNet with the MDC-DUC module can obtain edges of segmented objects with a better accuracy, as shown in (d). For AD-HRNet, we proposed to use the attention mechanism to obtain the global information of images. In (e), we can find that the HRNet with the proposed shuffle-CBAM can identify objects with different scales, especially small objects.
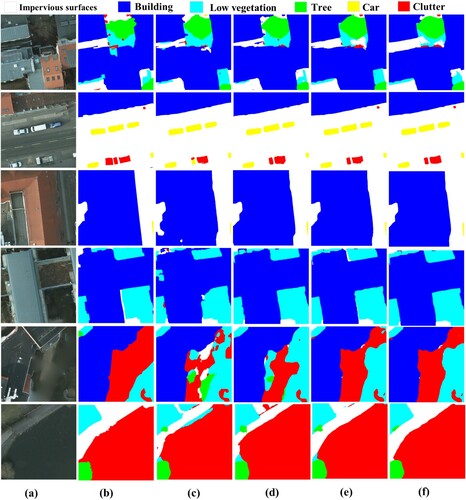
Figure 10. Visualization results on Potsdam dataset. (a) Images, (b) Ground truth, (c) HRNet, (d) HRNet + MDC-DUC, (e) HRNet + Shuffle-CBAM, and (f) AD-HRNet.
The experimental results shown in indicate that the improved weighted cross-entropy loss function can get a better result for identifying small objects by increasing the value of mIoU and F1 score to 0.30% and 0.45%, respectively, based on Vaihingen dataset. By adding the Shuffle-CBAM module to the framework of HRNet can increase the mIoU and F1-Score by 0.82% and 0.8%, respectively. And after adding the MDC-DUC module, the mIoU and F1-Score of HRNet are increased by 0.75% and 0.62%, respectively. However, the statistics also indicated that the precision of our model by using Vaihingen dataset is slightly lower than the original version of HRNet. It is because our model mainly solved the problem of class imbalance, which may reduce the accuracy of some large objects and lead to a slight decrease in the precision. Based on the existing studies, most of researchers pay more attention to improve the value of mIoU and F1-Score during semantic segmentation for remote sensing images. Although the precision of AD-HRNet model based on Vaihingen dataset is slightly lower, it significantly improved the value of mIoU and F1-Score by 1.51% and 1.56%, respectively.
Table 9. Ablation experiments on Vaihingen dataset.
illustrates the visualization results of the ablation experiment by using Vaihingen dataset. As we can see from , the proposed modules including MDC-DUC and Shuffle-CBAM are effective in identifying small targets and recognizing the edges of multi-scale objects (see (d,e)). For example, an unrecognized small Building based on HRNet is identified when we added the MDC-DUC module to the framework of HRNet ((d)). The visualized result shown in and indicates that the proposed AD-HRNet by embedding with the constructed modules of Shuffle-CBAM and MDC-DUC not only improves the ability of recognizing objects with various scales (especially for small objects), but also enhances the ability of edge recognition.
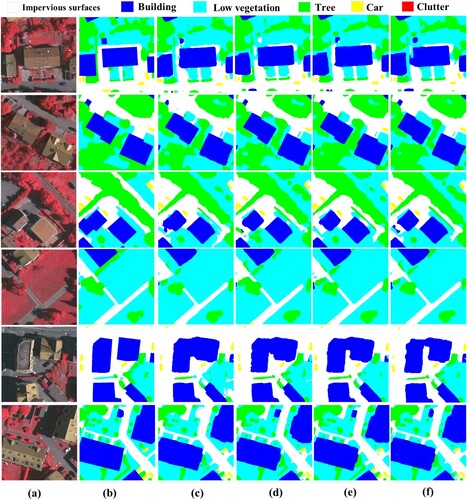
Figure 11. Visualization results on Vaihingen dataset. (a) Images, (b) Ground truth, (c) HRNet, (d) HRNet + MDC-DUC, (e) HRNet + Shuffle-CBAM, and (f) AD-HRNet.
The experiments conducted on Potsdam and Vaihingen datasets also show that the inference speed of GFLOPs and single image by using our model is slightly slower than HRNet (see and ). In this study, we focused on improving the performance of model in the aspect of mIoU and F1 score and didn’t pay more attention on how to reduce the time cost during semantic segmentation. Thus, future work for addressing this issue is still needed.
4.3.3. Generalization experiment
In this study, our model was trained by using Postdam and Vaihingen datasets. Since the training set of SAMA-VTOL is not public to users, our model cannot be trained by images with geometric features and radiation characteristics which existed in SAMA-VTOL. Thus, we applied the testing image provided by SAMA-VTOL dataset to validate the generalization of AD-HRNet. The experimental result is shown in .
Figure 12. Visualizations of generation experiment by using SAMA-VTOL testing image.
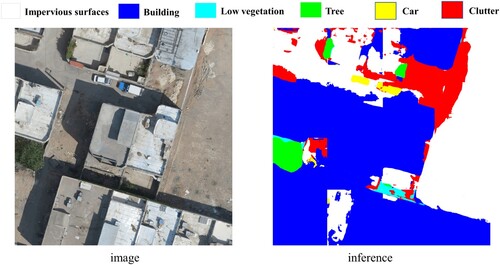
As we can see from , the proposed model AD-HRNet can effectively recognize the targets with the class of Impervious surfaces, Building, Low vegetation, Tree, Car, and Clutter. These unrecognized or misidentified objects are basically categories that do not exist in the training sets, such as building shadows.
5. Conclusion
In this study, we designed a novel model called as AD-HRNet by combing the HRNet with attention mechanisms and dilated convolution for the semantic segmentation of remote sensing data. In the framework of AD-HRNet, two new modules: Shuffle-CBAM and MDC-DUC, are constructed by us to improve the segmentation accuracy. The Shuffle-CBAM module in AD-HRNet model is integrated by channel attention and spatial attention to use for obtaining more global context information of images by slightly increasing the amount of computation. The MDC-DUC module can better capture the information of multi-scale objects and the edge information of a large number of irregular objects by using the characteristics learned through dense upsampling convolution after expending the receptive field of convolution kernel based on the dilated convolution. In addition, we used the median frequency balance method to obtain the weight of each class and added it to the weighted cross-entropy function which is used to replace the original cross-entropy function of HRNet. This improvement solves the class imbalance problem to some extent. Our proposed AD-HRNet was comprehensively evaluated on two widely used datasets (Potsdam and Vaihingen) in the research field of remote sensing semantic segmentation. The statistics shown that it achieved mIoUs of 75.59% and 71.58%, respectively, and outperforming other existing benchmark models, e.g. HRNet, Deeplab, OCRNet, and so on. The outcomes of ablation experiments also showed how well our suggested module performs in remote sensing semantic segmentation tasks. We also validate the generalization ability of AD-HRNet by using SAMA-VTOL dataset. The experimental result shown that the proposed AD-HRNet can recognize objects from the image collected from SAMA-VTOL without their own data training. However, limitations are still existed. For example, the comparison experiments conducted by Potsdam and Vaihingen datasets illustrate that the time cost is increased by using our model. Therefore, in the future work, we will study how to reduce the cost of inference time as much as possible while improving the accuracy of the model.
Acknowledgements
The authors would like to sincerely thank the anonymous reviewers for their constructive comments and valuable suggestions to improve the quality of this article.
Disclosure statement
No potential conflict of interest was reported by the author(s).
Data availability statement
The data that support the findings of this study are openly available at [https://www.isprs.org/education/benchmarks]. The dataset SAMA-VTOL is acquired at [https://doi.org/10.6084/m9.figshare.20418366].
Additional information
Funding
References
- Alqurashi, Abdullah, and Lalit Kumar. 2013. “Investigating the Use of Remote Sensing and GIS Techniques to Detect Land Use and Land Cover Change: A Review.” Advances in Remote Sensing 2 (2): 193–204. doi:10.4236/ars.2013.22022.
- Badrinarayanan, Vijay, Alex Kendall, and Roberto Cipolla. 2017. “Segnet: A Deep Convolutional Encoder-Decoder Architecture for Image Segmentation.” IEEE Transactions on Pattern Analysis and Machine Intelligence 39 (12): 2481–2495. doi:10.1109/TPAMI.2016.2644615.
- Bayanlou, Mohammad R., and Mehdi Khoshboresh-Masouleh. 2021. “Multi-Task Learning from Fixed-Wing UAV Images for 2D/3D City Modeling.” ArXiv 2109:00918.
- Chen, Liang-Chieh, George Papandreou, Iasonas Kokkinos, Kevin Murphy, and Alan L. Yuille. 2017. “Deeplab: Semantic Image Segmentation with Deep Convolutional Nets, Atrous Convolution, and Fully Connected Crfs.” IEEE Transactions on Pattern Analysis and Machine Intelligence 40 (4): 834–848. doi:10.1109/TPAMI.2017.2699184.
- Chen, Liang-Chieh, George Papandreou, Florian Schroff, and Hartwig Adam. 2017. “Rethinking Atrous Convolution for Semantic Image Segmentation.” ArXiv 1706:05587.
- Ching, Travers, Daniel S. Himmelstein, Brett K. Beaulieu-Jones, Alexandr A. Kalinin, Brian T. Do, Gregory P. Way, Enrico Ferrero, Paul-Michael Agapow, Michael Zietz, and Michael M. Hoffman. 2018. “Opportunities and Obstacles for Deep Learning in Biology and Medicine.” Journal of The Royal Society Interface 15 (141): 20170387. doi:10.1098/rsif.2017.0387.
- Dai, Jifeng, Haozhi Qi, Yuwen Xiong, Yi Li, Guodong Zhang, Han Hu, and Yichen Wei. 2017. “Deformable Convolutional Networks.” In 2017 IEEE International Conference on Computer Vision(ICCV), 764–773. doi:10.1109/ICCV.2017.89.
- Deng, Zhipeng, Hao Sun, Shilin Zhou, Juanping Zhao, Lin Lei, and Huanxin Zou. 2018. “Multi-Scale Object Detection in Remote Sensing Imagery with Convolutional Neural Networks.” ISPRS Journal of Photogrammetry and Remote Sensing 145: 3–22. doi:10.1016/j.isprsjprs.2018.04.003.
- Diakogiannis, Foivos I., François Waldner, Peter Caccetta, and Chen Wu. 2020. “ResUNet-a: A Deep Learning Framework for Semantic Segmentation of Remotely Sensed Data.” ISPRS Journal of Photogrammetry and Remote Sensing 162: 94–114. doi:10.1016/j.isprsjprs.2020.01.013.
- Dong, Laigen, and Jie Shan. 2013. “A Comprehensive Review of Earthquake-Induced Building Damage Detection with Remote Sensing Techniques.” ISPRS Journal of Photogrammetry and Remote Sensing 84: 85–99. doi:10.1016/j.isprsjprs.2013.06.011.
- Dosovitskiy, Alexey, Lucas Beyer, Alexander Kolesnikov, Dirk Weissenborn, Xiaohua Zhai, Thomas Unterthiner, Mostafa Dehghani, Matthias Minderer, Georg Heigold, and Sylvain Gelly. 2020. “An Image Is Worth 16 × s16 Words: Transformers for Image Recognition at Scale.” ArXiv 2010:11929.
- Du, Shouji, Shihong Du, Bo Liu, and Xiuyuan Zhang. 2021. “Incorporating DeepLabv3+ and Object-Based Image Analysis for Semantic Segmentation of Very High Resolution Remote Sensing Images.” International Journal of Digital Earth 14 (3): 357–378. doi:10.1080/17538947.2020.1831087.
- Dubey, Abhimanyu, Nikhil Naik, Devi Parikh, Ramesh Raskar, and César A. Hidalgo. 2016. “Deep Learning the City: Quantifying Urban Perception at a Global Scale.” In 2016 European Conference on Computer Vision(ECCV), 196–212. doi:10.1007/978-3-319-46448-0_12.
- Fu, Jun, Jing Liu, Haijie Tian, Yong Li, Yongjun Bao, Zhiwei Fang, and Hanqing Lu. 2019. “Dual Attention Network for Scene Segmentation.” In Proceedings 2019 IEEE/CVF Conference on Computer Vision and Pattern Recognition(CVPR 2019), 3141–3149. doi:10.1109/CVPR.2019.00326.
- Gribbon, Kim T., and Donald G. Bailey. 2004. “A Novel Approach to Real-Time Bilinear Interpolation.” In Proceedings. DELTA 2004. Second IEEE International Workshop on Electronic Design, Test and Applications, 126–131. doi:10.1109/DELTA.2004.10055.
- Grigorescu, Sorin, Bogdan Trasnea, Tiberiu Cocias, and Gigel Macesanu. 2020. “A Survey of Deep Learning Techniques for Autonomous Driving.” Journal of Field Robotics 37 (3): 362–386. doi:10.1002/rob.21918.
- Guo, Meng-Hao, Tian-Xing Xu, Jiang-Jiang Liu, Zheng-Ning Liu, Peng-Tao Jiang, Tai-Jiang Mu, Song-Hai Zhang, Ralph R. Martin, Ming-Ming Cheng, and Shi-Min Hu. 2022. “Attention Mechanisms in Computer Vision: A Survey.” Computational Visual Media 8: 331–368. doi:10.1007/s41095-022-0271-y.
- He, Kaiming, Xiangyu Zhang, Shaoqing Ren, and Jian Sun. 2016. “Deep Residual Learning for Image Recognition.” In Proceedings 2016 IEEE Conference on Computer Vision and Pattern Recognition(CVPR), 770–778. doi:10.1109/CVPR.2016.90.
- Hu, Jie, Li Shen, and Gang Sun. 2018. “Squeeze-and-Excitation Networks.” In IEEE Transactions on Pattern Analysis and Machine Intelligence (TPAMI), 2011–2023. DOI: 10.1109/TPAMI.2019.2913372.
- Huang, Zilong, Xinggang Wang, Lichao Huang, Chang Huang, Yunchao Wei, and Wenyu Liu. 2019. “Ccnet: Criss-Cross Attention for Semantic Segmentation.” In IEEE Transactions on Pattern Analysis and Machine Intelligence (TPAMI). doi:10.1109/TPAMI.2020.3007032.
- Joyce, Karen E., Stella E. Belliss, Sergey v Samsonov, Stephen J. McNeill, and Phil J. Glassey. 2009. “A Review of the Status of Satellite Remote Sensing and Image Processing Techniques for Mapping Natural Hazards and Disasters.” Progress in Physical Geography 33 (2): 183–207. doi:10.1177/0309133309339563.
- Kampffmeyer, Michael, Arnt-Borre Salberg, and Robert Jenssen. 2016. “Semantic Segmentation of Small Objects and Modeling of Uncertainty in Urban Remote Sensing Images Using Deep Convolutional Neural Networks.” In Proceedings 2016 IEEE/CVF Conference on Computer Vision and Pattern Recognition Workshops(CVPRW), 680–688. doi:10.1109/CVPRW.2016.90.
- Ke, Yan, and Rahul Sukthankar. 2004. “PCA-SIFT: A More Distinctive Representation for Local Image Descriptors.” In Proceedings 2004 IEEE Computer Society Conference on Computer Vision and Pattern Recognition(CVPR), II-II. doi:10.1109/CVPR.2004.1315206.
- Kemker, Ronald, Carl Salvaggio, and Christopher Kanan. 2018. “Algorithms for Semantic Segmentation of Multispectral Remote Sensing Imagery Using Deep Learning.” ISPRS Journal of Photogrammetry and Remote Sensing 145: 60–77. doi:10.1016/j.isprsjprs.2018.04.014.
- Kerr, Jeremy T., and Marsha Ostrovsky. 2003. “From Space to Species: Ecological Applications for Remote Sensing.” Trends in Ecology & Evolution 18 (6): 299–305. doi:10.1016/S0169-5347(03)00071-5
- Khoshboresh-Masouleh, Mehdi, Fatemeh Alidoost, and Hossein Arefi. 2020. “Multiscale Building Segmentation Based on Deep Learning for Remote Sensing RGB Images from Different Sensors.” Journal of Applied Remote Sensing 14 (3): 034503. doi:10.1117/1.JRS.14.034503.
- Leichtle, Tobias, Christian Geiß, Tobia Lakes, and Hannes Taubenböck. 2017. “Class Imbalance in Unsupervised Change Detection – A Diagnostic Analysis from Urban Remote Sensing.” International Journal of Applied Earth Observation and Geoinformation 60: 83–98. doi:10.1016/j.jag.2017.04.002.
- Li, Xiangtai, Hao He, Xia Li, Duo Li, Guangliang Cheng, Jianping Shi, Lubin Weng, Yunhai Tong, and Zhouchen Lin. 2021. “PointFlow: Flowing Semantics through Points for Aerial Image Segmentation.” In Proceedings 2021 IEEE/CVF Conference on Computer Vision and Pattern Recognition(CVPR), 4215–4224. doi:10.1109/CVPR46437.2021.00420.
- Li, Deren, Yuan Yao, and S. H. A. O. Zhenfeng. 2015. “Big Data in Smart Cities.” Science China Information Sciences 58: 1–12. doi:10.1007/s11432-015-5396-5.
- Liu, Runrui, Fei Tao, Xintao Liu, Jiaming Na, Hongjun Leng, Junjie Wu, and Tong Zhou. 2022. “RAANet: A Residual ASPP with Attention Framework for Semantic Segmentation of High-Resolution Remote Sensing Images.” Remote Sensing 14 (13): 3109. doi:10.3390/rs14133109.
- Liu, Shuai, Lu Zhang, Huchuan Lu, and You He. 2021. “Center-Boundary Dual Attention for Oriented Object Detection in Remote Sensing Images.” IEEE Transactions on Geoscience and Remote Sensing 60: 1–14. doi:10.1109/TGRS.2021.3069056.
- Long, Jonathan, Evan Shelhamer, and Trevor Darrell. 2015. “Fully Convolutional Networks for Semantic Segmentation.” IEEE Transactions on Pattern Analysis and Machine Intelligence 39 (4): 640–651. doi:10.1109/TPAMI.2016.2572683.
- Ma, Ningning, Xiangyu Zhang, Hai-Tao Zheng, and Jian Sun. 2018. “Shufflenet v2: Practical Guidelines for Efficient CNN Architecture Design.” In Proceedings 2018 European Conference on Computer Vision (ECCV), 122–138. doi:10.1007/978-3-030-01264-9_8.
- Meng, Xiaoliang, Yuechi Yang, Libo Wang, Teng Wang, Rui Li, and Ce Zhang. 2022. “Class-Guided Swin Transformer for Semantic Segmentation of Remote Sensing Imagery.” IEEE Geoscience and Remote Sensing Letters 19: 1–5. doi:10.1109/LGRS.2022.3215200.
- Panda, Durga P., and Azriel Rosenfeld. 1978. “Image Segmentation by Pixel Classification in (Gray Level, Edge Value) Space.” IEEE Transactions on Computers 27 (09): 875–879. doi:10.1109/TC.1978.1675208.
- Park, Jongchan, Sanghyun Woo, Joon-Young Lee, and In So Kweon. 2018. “Bam: Bottleneck Attention Module.” ArXiv:1807.06514.
- Plath, Nils, Marc Toussaint, and Shinichi Nakajima. 2009. “Multi-Class Image Segmentation Using Conditional Random Fields and Global Classification.” In Proceedings of the 26th Annual International Conference on Machine Learning, 817–824. doi:10.1145/1553374.1553479.
- Ronneberger, Olaf, Philipp Fischer, and Thomas Brox. 2015. “U-Net: Convolutional Networks for Biomedical Image Segmentation.” Medical Image Computing and Computer-Assisted Intervention(MICCAI 9351: 234–241. doi:10.1007/978-3-319-24574-4_28.
- Seong, Seonkyeong, and Jaewan Choi. 2021. “Semantic Segmentation of Urban Buildings Using a High-Resolution Network (HRNet) with Channel and Spatial Attention Gates.” Remote Sensing 13 (16): 3087. doi:10.3390/rs13163087.
- Shi, Jianbo, and Jitendra Malik. 2000. “Normalized Cuts and Image Segmentation.” IEEE Transactions on Pattern Analysis and Machine Intelligence 22 (8): 888–905. doi:10.1109/34.868688.
- Song, Wen, Wei Song, Haihong Gu, and Fuping Li. 2020. “Progress in the Remote Sensing Monitoring of the Ecological Environment in Mining Areas.” International Journal of Environmental Research and Public Health 17 (6): 1846. doi:10.3390/ijerph17061846.
- Sun, Ke, Bin Xiao, Dong Liu, and Jingdong Wang. 2019. “Deep High-Resolution Representation Learning for Human Pose Estimation.” In Proceedings 2019, IEEE/CVF Conference on Computer Vision and Pattern Recognition(CVPR), 5686–5696. doi:10.1109/CVPR.2019.00584.
- Sun, Ke, Yang Zhao, Borui Jiang, Tianheng Cheng, Bin Xiao, Dong Liu, Yadong Mu, Xinggang Wang, Wenyu Liu, and Jingdong Wang. 2019. “High-Resolution Representations for Labeling Pixels and Regions.” ArXiv 1904:04514.
- Treml, Michael, José Arjona-Medina, Thomas Unterthiner, Rupesh Durgesh, Felix Friedmann, Peter Schuberth, Andreas Mayr, Martin Heusel, Markus Hofmarcher, and Michael Widrich. 2016. Speeding up Semantic Segmentation for Autonomous Driving.
- Wang, Panqu, Pengfei Chen, Ye Yuan, Ding Liu, Zehua Huang, Xiaodi Hou, and Garrison Cottrell. 2018. “Understanding Convolution for Semantic Segmentation.” In 2018 IEEE Winter Conference on Applications of Computer Vision (WACV), 1451–1460. doi:10.1109/WACV.2018.00163.
- Wang, Xiaolong, Ross Girshick, Abhinav Gupta, and Kaiming He. 2018. “Non-local Neural Networks.” In Proceedings 2018 IEEE/CVF Conference on Computer Vision and Pattern Recognition, 7794–7803. doi:10.1109/CVPR.2018.00813.
- Wang, Xiaoyu, Tony X. Han, and Shuicheng Yan. 2009. “An HOG-LBP Human Detector with Partial Occlusion Handling.” In 2009 IEEE 12th International Conference on Computer Vision(ICCV), 32–39. doi:10.1109/ICCV.2009.5459207.
- Wang, Libo, Rui Li, Ce Zhang, Shenghui Fang, Chenxi Duan, Xiaoliang Meng, and Peter M. Atkinson. 2022. “UNetFormer: A UNet-Like Transformer for Efficient Semantic Segmentation of Remote Sensing Urban Scene Imagery.” ISPRS Journal of Photogrammetry and Remote Sensing 190: 196–214. doi:10.1016/j.isprsjprs.2022.06.008.
- Woo, Sanghyun, Jongchan Park, Joon-Young Lee, and In So Kweon. 2018. “Cbam: Convolutional Block Attention Module.” In Proceedings 2018 European Conference on Computer Vision (ECCV), 3–19. doi:10.1007/978-3-030-01234-2_1.
- Xu, Zhiyong, Weicun Zhang, Tianxiang Zhang, and Jiangyun Li. 2020. “HRCNet: High-Resolution Context Extraction Network for Semantic Segmentation of Remote Sensing Images.” Remote Sensing 13 (1): 71. doi:10.3390/rs13010071.
- Yuan, Yuhui, Xiaokang Chen, Xilin Chen, and Jingdong Wang. 2019. “Segmentation Transformer: Object-Contextual Representations for Semantic Segmentation.” ArXiv 1909:11065.
- Zhang, Jing, Shaofu Lin, Lei Ding, and Lorenzo Bruzzone. 2020. “Multi-Scale Context Aggregation for Semantic Segmentation of Remote Sensing Images.” Remote Sensing 12 (4): 701. doi:10.3390/rs12040701.
- Zhang, Qing-Long, and Yu-Bin Yang. 2021. “Sa-Net: Shuffle Attention for Deep Convolutional Neural Networks.” In 2021 IEEE International Conference on Acoustics, Speech and Signal Processing (ICASSP), 2235–2239. doi:10.1109/ICASSP39728.2021.9414568.
- Zhang, Fan, Bolei Zhou, Liu Liu, Yu Liu, Helene H. Fung, Hui Lin, and Carlo Ratti. 2018. “Measuring Human Perceptions of a Large-Scale Urban Region Using Machine Learning.” Landscape and Urban Planning 180: 148–160. doi:10.1016/j.landurbplan.2018.08.020.
- Zhu, Xiao Xiang, Devis Tuia, Lichao Mou, Gui-Song Xia, Liangpei Zhang, Feng Xu, and Friedrich Fraundorfer. 2017. “Deep Learning in Remote Sensing: A Comprehensive Review and List of Resources.” IEEE Geoscience and Remote Sensing Magazine 5 (4): 8–36. doi:10.1109/MGRS.2017.2762307.