
 ?Mathematical formulae have been encoded as MathML and are displayed in this HTML version using MathJax in order to improve their display. Uncheck the box to turn MathJax off. This feature requires Javascript. Click on a formula to zoom.
ABSTRACT
Reliable assessment of landslide susceptibility in broad areas of terrain remains challenging due to complex topography and poor representation of randomly selected negative samples. Assessment in broad areas is now primarily based on grid units, which do not have a clear physical meaning like slope units, and their accuracy is not ideal. Nevertheless, the large amount of manual editing, due to the incorrectly generated horizontal and vertical lines during slope unit partitioning, limits using slope units for rapid assessment over large areas. Hence, this paper proposes a reliable susceptibility assessment approach to solve this problem based on optimal slope units and negative samples involving prior knowledge. Precisely, an algorithm to automatically extract slope units is designed to eliminate fragmented and erroneous units. Second, a samples labeling index (SLI) is defined based on the certainty factors model to select negative samples reasonably. Sichuan Province, China is selected for experimental analysis, with the results demonstrate that the optimized slope unit and the negative samples selection strategy consider prior knowledge achieve better results in the random forest model, support vector machine model, and artificial neural network model. In particular, the composite performance index AUC of artificial neural network model improved from 0.81 to 0.90.
1. Introduction
Susceptibility assessment of landslides serves as the foundation for hazard zoning and risk evaluation of (Abu El-Magd, Ali, and Pham Citation2021; Dahal et al. Citation2012; Thomas et al. Citation2021; van Westen, van Asch, and Soeters Citation2006), posing a vital role in disaster prevention and mitigation. The reliability of the landslide susceptibility assessment is influenced by the following key steps: mapping unit selection, conditioning factor determination, sample labeling, and assessment model construction. For broad areas, the impact of mapping unit selection and sample labeling on assessment effectiveness is particularly evident (Chen et al. Citation2020; Erener and Düzgün Citation2012; Jacobs et al. Citation2020).
Assessments in broad areas are based on grid units with no apparent physical meaning, like slope units. Furthermore, the manual partitioning of slope units is only suitable for limited areas, and the results are essentially unrepeatable. Alternatively, slope units can be extracted automatically utilizing specialized computer processing technologies. Currently, two types of methods automatically extract slope units based on digital elevation model (DEM) data. The first type extracts homogeneous units using digital image processing technology. Based on the spectral features of DEM images, this method aggregates pixel groups as slope units (Giles and Franklin Citation1998; Lin et al. Citation2018) and extracts the closed network of ridge and valley skeletons from DEM images using morphological analysis to form slope units (Wang et al. Citation2019), or superimposes the mountain shadow and slope direction image for pixel-level image segmentation to extract the slope unit (Huang et al., Citation2021). The complexity level of the partitioning results strongly depends on the precision of the DEM data (Philip and Steven Citation1998), presenting a relatively low efficiency and poor topographic landform fitting effect, posing this method unsuitable for vast study areas. The second method adheres to the hydrological principle to generate exterior basins from DEM, revises DEM separately, and superimposes them to acquire slope units. The improved methods based on the hydrological principle include: using the user-defined threshold as the parameter to control the extraction result (Massimiliano et al. Citation2016), obtaining watershed segmentation results according to curvature, which is the elevation-derived variable (Romstad and Etzelmueller Citation2012; Romstad and Etzelmüller Citation2009), and superimposing half basin and geomorphic category to obtain various types of slope unit division (Martinello et al., Citation2021). Hydrological-based schemes are more prevalent in partitioning slope units than digital image processing technology. However, partitioning slope units based on existing hydrological methods remains challenging due to the manual editing required due to inaccurate horizontal or vertical lines and fragmented units, particularly in vast areas with complicated landscapes.
Sample selection is vital for landslide susceptibility assessment, determining how the machine learning model understands the landslide feature. Positive samples are usually defined as historical landslides, i.e. units where existing landslide records are employed as positive samples. Negative samples are usually selected in the same number as positive samples (Zeng et al. Citation2022). Existing sample selection improvement strategies involve increasing the number and quality of positive samples for the case of limited landslide records (Liu et al. Citation2022) and increasing the representativeness of negative samples. Examples of achieving the latter are non-landslide areas with a slope less than 2° (Kavzoglu, Kutlug Sahin, and Colkesen Citation2014), target space exteriorization sampling (TEST) (Xiao et al. Citation2010), Mahalanobis distance-based method (Qi, Chen, and Zhang Citation2020), buffer-controlled sampling (BCS) (Zhu et al. Citation2019), and other improved negative-sample sampling methods (Chefaoui and Lobo Citation2008). The BCS method sets a buffer area within a specific range of landslide history records to avoid selecting negative samples with highly similar properties to potential landslide sites during random sampling. This strategy is widely used to generate more reasonable negative samples (Hu et al. Citation2020). Although it avoids the high probability area of landslide to a certain extent, it cannot integrate the effects of the conditioning factors on a landslide to select the negative samples that are not prone to landslide.
This paper proposes a reliable landslide susceptibility assessment approach for broad areas to address the above problems. Precisely, we design an automatic extraction algorithm to generate slope units by eliminating fragmented and erroneous units that provide directly functional slope units for landslide susceptibility assessment in broad areas. Negative sample selection involving prior knowledge is achieved through a Sample Labeling Index. Finally, based on the constructed slope units and the optimally selected negative samples set, artificial neural network model is constructed to realize the regional landslide susceptibility assessment.
2. Methodology
2.1. Principle of the approach
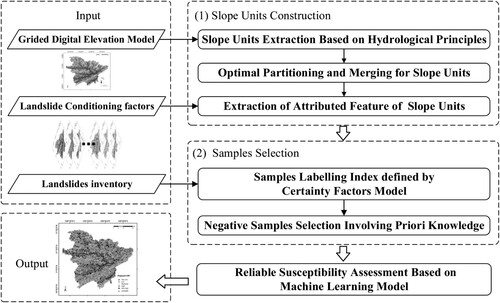
The proposed reliable landslide susceptibility assessment approach is as follows. First, the catchment area delineation is performed using the hydrological method based on DEM data. Second, the slope units are optimized and merged by an automatic extraction algorithm involving two fundamental parameters. Third, the optimized slope units extract attributed features for each conditioning factor. Fourth, the Samples Labelling Index is defined based on the Certainty Factors model, and the negative sample selection process considers prior knowledge. Finally, the optimally selected samples are used to construct artificial neural network model and predict the whole area's susceptibility. The probability of each unit belonging to a landslide is reclassified using the Natural Break method to determine landslide susceptibility. illustrates the flowchart of the reliable assessment approach, with the core steps highlighted and introduced separately in the following two sections. The core steps are automatic extraction, optimization of slope units, and selecting negative samples involving prior knowledge.
Figure 1. Flowchart of reliable landslide assessment approach proposed in this paper.
2.2. Automatic extraction and optimization of slope units
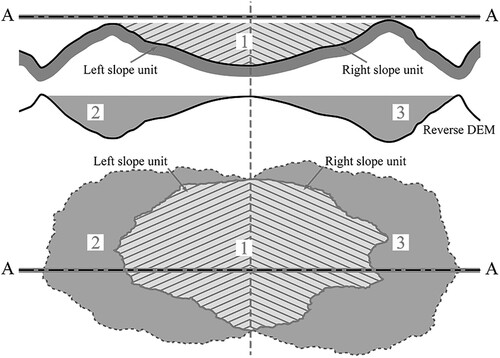
Based on surface hydrological processes, the left and right banks of each sub-basin within the basin are defined as the slope units (Carrara et al. Citation1991; Citation1995; Guzzetti et al. Citation1999). As depicted in , to extract the left and right slopes in catchment 1, the boundary line of catchment 1 is first obtained by performing operations such as flow direction and flow accumulation calculations using DEM data. Then, subtracting the value of the original DEM from the maximum elevation value of the original DEM yields the inverse DEM. The boundary lines of catchments 2 and 3 are obtained by performing operations on the inverse DEM. The junction line between catchments 2 and 3 is the valley line, while the boundary line of catchment 1 is the ridge line. The area enclosed by the ridge and valley lines is the slope unit to be extracted.
Figure 2. Schematic of slope unit extraction based on hydrological principles.
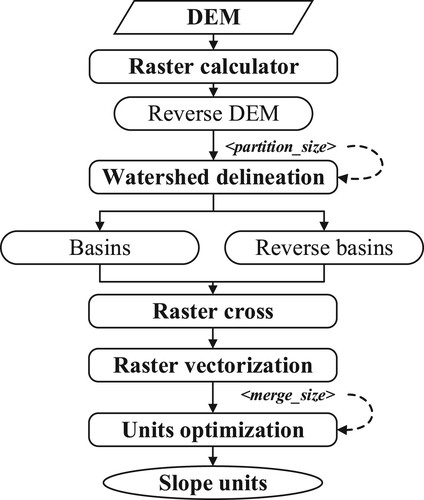
A method for optimal partitioning of slope units was proposed, which divides slope units automatically according to the given DEM data and two user-defined numerical parameters: (i) the minimum area (m2) of the sub watershed, i.e. partition size; and (ii) the maximum area (m2) for cleaning unreasonable units, i.e. merge size. The flowchart of automatic extraction and optimization of slope units is depicted in . Firstly, the inverse DEM data is calculated. Secondly, in accordance with the hydrological principle, the partition size parameter is utilized to split the sub-basins. Partition size is utilized as an input by the hydrological module to restrict the area of sub watershed surfaces generated by DEM and reverse DEM. Its value is the product of the flow accumulation threshold (minimum number of grids constituting the watershed) and the surface area represented by a single grid. Partition size determines the granularity of the divided slope units. A smaller value will result in a more detailed division and therefore significantly lengthen the extraction process. Thirdly, raster crossover and vectorization are performed. In the raster vectorization process following the overlaying of sub watersheds, the program may produce locally unrealistic slope units consisting of a few grid cells that are too small. Finally, to remove slope units with unrealistic or undesirable sizes, the merge size parameter was implemented to merge slope units with an area smaller than the parameter value into neighborhood units by removing the longest boundary between adjacent units ().
Figure 3. The flowchart of slope unit extraction and optimization.
2.3. Negative samples selection involving prior knowledge
We form a priori knowledge for negative sample selection by analyzing the correlations between landslide records and relevant conditioning factors to select representative negative samples. The certainty factors (CF) model is used to quantify the sensitivity of various intervals of each conditioning factor. Additionally, a certainty factor model-based Samples Labelling Index is defined to describe the correlations between the unit and the landslide probability, and the negative samples are selected based on the association strength. This strategy is described below, and presents the corresponding visual interpretation.
Figure 4. The visual interpretation of negative sample selection involves prior knowledge.
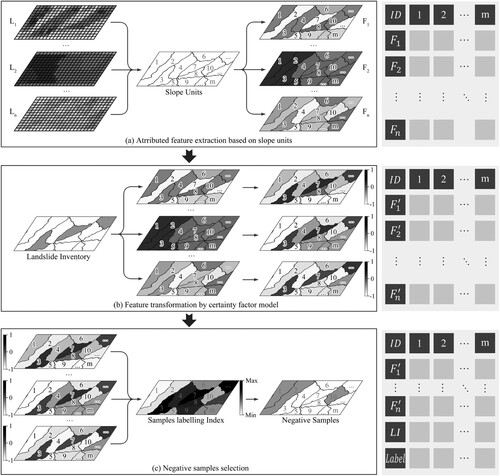
Attributed feature extraction is realized using zonal statistics with mapping units, like geometric containers, and original conditioning factors as inputs. There are two types of conditioning factors for landslides susceptibility assessment: numeric and category types. For continuous numerical factors, zonal statistics is executed by averaging the value of all cells concluded in the same slope unit. For category factors, it determines the category that appears most frequently among all cells in the same slope unit as the output. The objective of reclassification is to discretize continuous numerical data into distinct intervals or to alter the number of categories for the subsequent training. An intuitive visual interpretation of the process of feature extraction and reclassification is demonstrated in (a). L1, L2, … , Ln represent different original conditioning factor layers of the same region that are partitioned as m slope units. F1, F2, … , Fn are the results of zonal statics and reclassification of various factor layers. For the following training and prediction, a table is created in which each column represents a land plot and each row provides the features of land plot.
The certainty factor (CF) model is a probability function that analyzes the sensitivity of multiple factors that influence an event, and it has been frequently utilized in the evaluation of landslide susceptibility. This method was first proposed by Shortliffe and Buchanan (Shortliffe and Buchanan Citation1975) and then modified by Heckerman (Heckerman Citation1986). The principle of the CF model is expressed as follows:
(1)
(1) where
is the conditional probability of landslides occurring in a region belonging to the classification a for a single conditioning factor, and
is the prior probability of landslides occurring in the entire study area.
(2)
(2) where
is the area of classification a for a single conditioning factor, and
is the area of landslides belonging to classification a.
(3)
(3) where
, and i is defined as element from the set of reclassification results of a single conditioning factor.
The calculation results of the CF model are in the range of [−1,1]. When the CF value is close to zero, the priori probability is very close to the conditional probability, indicating that it is uncertain whether landslides will occur and that the occurrence of landslides in this unit is comparable to the occurrence of landslides in the entire area. Positive values indicate a high certainty of landslide occurrence, whereas negative values indicate a low certainty of landslide occurrence. By computing the CF value of various feature layers (F1, F2, … , Fn), additional features (,
, … ,
) are created, as depicted in (b) in the form of an intuitive process.
Positive units can be labeled from landslide inventory by determining whether landslides or hazards existed. Training model fitting requires the same number of negative units. The premise for improvement is to define an index describing the degree of likelihood of landslides on each unit, allowing for the automatic selection of negative units taking into account prior knowledge.
To incorporate the influence of multiple conditioning factors, one way is to calculate the combination of CF values using the following formula:
(4)
(4) where
and
are the CF values of the two factors to be combined. The combination of CF values of multiple conditioning factors is calculated in pairs in sequence. When multiple positive and negative dissimilar CF values are combined, the results are affected by the order of combing. Another way to the incorporate the influence of multiple conditioning factors is to calculate the summation of CF values using the following formula:
(5)
(5)
The Samples Labelling Index (SLI) is defined as the summation of CF values of multiple conditioning factors in this paper. Then negative samples are picked randomly from units with low probability of landslides, which indicated by SLI, as depicted in (c). After labelling negative units, the input, a table of positive and negative units with new features for the subsequent machine learning model is prepared.
3. Experiment and result
The proposed automatic extraction and optimization of slope units and the sample selection process are implemented by developing a plugin based on GRASS GIS in Python. The extracted features and susceptibility mapping are processed in ArcGIS, while the random forest model, SVM model and ANN model are realized using the Scikit-Learn package (https://scikit-learn.org).
3.1. Study region and data sources
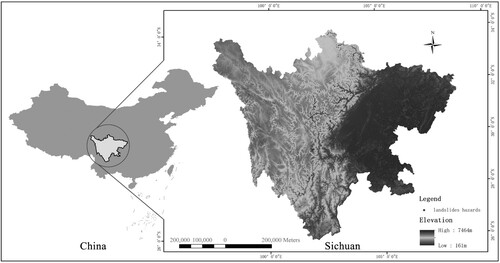
Sichuan Province is located on the southeastern side of the Tibetan Plateau, bounded by 26°03′N∼34°19′N and 97°21′E∼108°12′E, with a total area of 486,000 square kilometers. The topography of Sichuan province varies greatly in height, with the west generally being higher than the east. The geomorphology of Sichuan province is complex and characterized by extensive mountains and hills. Sichuan Province features three major seismic activity zones, including Longmen Mountain, Xianshui River, and Anning River, as well as a fully developed stratigraphy with strong geological tectonics. The climate is complex and variable. The Chengdu basin belongs to the humid subtropical climate, while the southwest mountain area has a subtropical semi-humid climate, and the northwest mountain area has a highland alpine climate. There are abundant water resources, numerous rivers, and a strong undercutting impact.
Sichuan Province is one of the most geologically hazardous provinces in China as a result of its complex natural characteristics. According to the report from the Department of Natural Resources of Sichuan Province, by the end of 2020, over 20,000 landslide hazards have been identified in Sichuan, endangering the production and safety of the local population. illustrates a map of the study region showing the locations of landslide hazard. Thus, Sichuan Province was selected as the study region to validate the proposed reliable assessment approach and its practical applications, such as disaster prevention and reduction.
Figure 5. Location and landslide hazards in the study region
In order to analyze the correlation between the complex combination of disaster-inducing environment and disaster-causing factors and landslide occurrence, several information including digital elevation model (DEM), average annual rainfall data,, normalized difference vegetation index (NDVI), roads network vector data, rivers vector data, land use and land coverage (LULC), lithology, and landslides hazard data were collected from the study area. lists the detailed information and data sources used in this study.
Table 1. List of data sources utilized in the study.
The occurrence of landslides is a complex process resulting from the interaction of many factors. The results of the selection of conditioning factors are not uniquely determined due to the changes in mechanisms between regions and the availability of observations. Ideal steps for selecting conditioning factors are as follows: 1. collect as much available data as possible based on priori experience; 2. examine the independence among factors; 3. analyze the correlation between factors and landslides occurrence; 4. optimize the selection of conditioning factors by training the model fitting.
For the experiment, we rely on experience and data access and use the following 8 conditioning factors: Aspect、Slope、Lithology、LULC、Rainfall、NDVI、Distance to roads、Distance to rivers (Akinci and Zeybek Citation2021). depicts the distribution maps of the conditioning factors.
Figure 6. Conditioning factors maps: (a) Aspect. (b) Slope. (c) Lithology. (d) LULC. (e) Rainfall. (f) NDVI. (g) Distance to roads. (h). Distance to rivers.
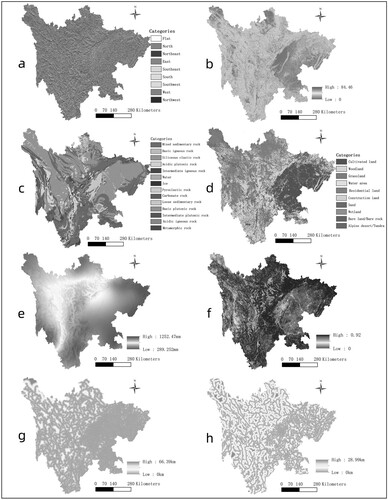
Aspect refers to the direction of a slope with north as a reference and determines rainfall and aridity and it has been widely used in various landslide assessment studies (Ali et al. Citation2022). The aspect of the study area is illustrated in (a). Slope is directly related to the velocity of water runoff and it is one of the significant triggering factors for landslide events (Yalcin and Bulut Citation2007). The study area has a steep slope ranging from 0.0° to 84.46° ((b)). Lithology is one of the main factors affecting the occurrence of landslides since lithological and structural variations often lead to changes in the strength and permeability of rocks and soils (Akinci and Zeybek Citation2021). The lithology of the study area is illustrated in (c). LULC is a critical factor in landslide susceptibility ()), typically used in other studies. When excessive rainfall occurs in a short time, flash floods and landslides occur. Thus, we consider the mean annual rainfall ((e)). NDVI indicates the proportion of vegetation cover and ranges from +1 to−1, where higher positive values signify dense vegetation covers and vice versa. In the study area, NDVI ranges from 0.0 to 0.92 ((f)). The slope cutting phenomenon due to road alters the slope’s original mechanical state and triggers its instability. Therefore, the distance from the road and the occurrence of landslides are often correlated, revealing that the closer the road, the more likely the landslide occurs. The distance to the roads ranges from 0 to 66.39 km in the study area ((g)). Proximity to a fault often means more active geological activity and the potential for landslides, while the scouring and undercutting action of rivers and the effect on the water content of soil on riparian slopes, leading to a greater susceptibility to landslides in areas close to rivers. The distance to roads ranges from 0 to 28.99 km in the study area ((h)).
3.2. The result of slope units construction
When there is a lack of precise boundary and area information about landslides, frequently occurring when conducting landslide susceptibility assessments over a vast area, the CF calculations employ the mapping unit area where the landslide is located. This requires the mapping unit to be as close as feasible to the scale of the landslide, resulting in unsatisfactory time consumption for subsequent multiple factor layer feature extraction due to the excessive number of slope units.
Three sets of optimal slope units are obtained by setting different parameters, with the corresponding statistical analysis reported in . The processing times are 1022, 432, and 197 min for a partition size of 100000, 500000, and 1,000,000 m2, respectively. This demonstrates the effectiveness of the proposed slope unit construction methods for rapid assessment of landslide susceptibility over large areas.
Table 2. Statistical analysis of different partitions of slope units.
The partitioning threshold for slope units should be determined by simultaneously retaining as many positive sample numbers as possible while involving a reasonable total number of slope units. In forming slope units by raster cross, the error units occupying a small number of grid cells are frequently generated. In this paper, slope units with an area less than 10,000 m2 (about 11 grid cells) are regarded as errors caused by raster cross. Therefore, for the subsequent feature extraction, the study area is partitioned into 1,050,261 slope units, with the partition size set to 500,000 m2.
3.3. Certainty factors of landslide conditioning factors
For the continuous numerical conditioning factors, such as slope, rainfall, and distance, the natural break approach is utilized for reclassification. Based on previous experience, the number of intervals is set to 10. Their categories were used for CF value calculation for the factors with natural classification. The CF values of the conditioning factors are computed using EquationEq. (1(1)
(1) ) and are reported in .
Table 3. CF values of conditioning factors based on optimal slope units.
3.4. The result of landslide susceptibility
The Samples Labelling Index (SLI) of all slope units were classified by the natural breaks method into five classes and the negative samples were picked from the first class close to minimum value, which implied a low probability of landslides occurring. artificial neural network (ANN) model is used for training based on the optimized slope unit and optimally selected negative samples. The trained classifier aims to predict the label of all slope units throughout the study area, and the probability of landslide slope units is classified by the natural breaks method into five classes: very low, low, moderate, high, and very high. This proposed strategy generates the landslide susceptibility maps of the study area, which are illustrated in . To highlight the details, we emphasize and visualize a typical local area (1750 km2).
Figure 7. The landslide susceptibility maps.
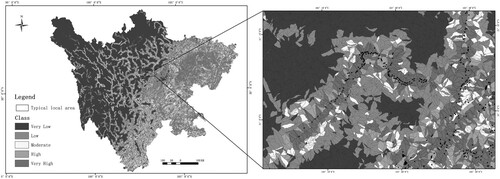
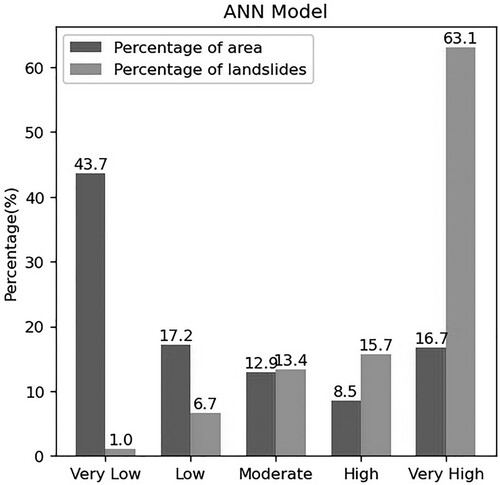
In order to assess the effect of the susceptibility assessment, the percentage of landslides occurring in different sub-areas is counted, as depicted in , which infers that very low, low, moderate, high, and very high grades covered the 43.7%, 17.2%, 12.9%, 8.5%, and 16.7% of the total study area, and contained 1.0%, 6.7%, 13.4%, 15.7%, and 63.1% of the landslide hazards, respectively. Almost 79% of the landslides are within the high susceptibility zone, and a few landslide samples are in the low susceptibility zone, revealing reasonable landslide susceptibility maps. The results adhere to the objective rule that area of low grades account for most of the predicted region, and as many landslide hazards as possible in the predicted areas are of high grade.
Figure 8. The statistics of landslides susceptibility maps.
4. Discussion
In order to verify the negative samples selection method that takes into account prior knowledge proposed in this paper, the commonly used random selection method was also used for comparison experiments. Moreover, to discuss the applicability of the improved negative samples selection method to machine learning models, three classical models are constructed, random forest model, support vector machine model and artificial neural network (Ali et al. Citation2022; Costache et al. Citation2021; Pham et al. Citation2021). The effectiveness of the improved method was analyzed and discussed in terms of the statistical indices of three models. For each model, 16,779 positive units and 16,779 negative units were selected and split into training and test sets in a ratio of 80% /20%. The training set was used for constructing the classifier, while the test set was utilized for evaluating its performance.
Statistical indices are widely utilized for evaluating the performance of classifiers. The most common statistical indices are as follows:
(5)
(5)
(6)
(6)
(7)
(7)
(8)
(8) where TP (True Positive) indicates that the true value is positive and is accurately predicted as positive; TN (True Negative) indicates that the true value is negative and is correctly predicted as negative; FP (False Positive) indicates that the true value is negative but is incorrectly predicted as positive; FN (False Negative) indicates that the true value is positive but is incorrectly predicted as negative.
Statistical indices of three models are reported in . The results show that using the negative sample labelling strategy proposed in this paper, all three models show significant improvements in all statistical indices. Accuracy, Precision, Recall and F1Score are all improved by about 10%, which indicates that the strategy in this paper selects more representative negative samples and is a general and effective sampling strategy.
Table 4. Statistical indices of typical models with different negative sampling methods.
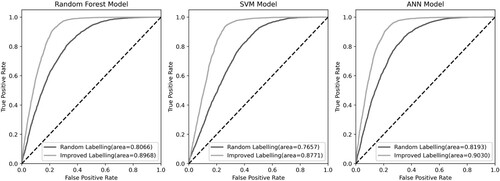
The receiver operating characteristic curve (ROC) is a quantitative analysis tool for evaluating the prediction accuracy of classifiers that uses the area under the curve (AUC) to measure the prediction accuracy of the classifier (Ali et al. Citation2021). The AUC value ranges between 0 and 1, and the greater its value, the more accurate the classifier’s predictions.
The receiver operating characteristic curves of three models with different negative sampling methods were shown in . The results show that improved labelling method achieve better results in all models. Among them, the artificial neural network model has the highest accuracy. The composite performance index AUC of ANN model improved from 0.81 to 0.90.
Figure 9. The receiver operating characteristic curves of typical models with different negative sampling methods.
5. Conclusion
To address the problems of difficult construction of slope units for landslide susceptibility assessment in broad areas and lack of representability of negative sample selection, this paper designs a reliable landslide assessment approach to achieve automatic construction of slope units, and sample selection taking into account prior knowledge. The experimental results verified the effectiveness of the approach proposed in this paper. The automatic extraction algorithm we designed can quickly generate slope units for landslide susceptibility assessment in broad areas. Improved negative sample selection method selects more representative negative samples and is a general and effective sampling strategy on machine learning models.
The method proposed in this paper still has limitations. The extraction and optimization of slope unit in a large area should increase the adaptability to the differences in landform types. Moreover, the negative sample selection involving prior knowledge needs to consider the balance of the global distribution of samples. This can be improved in the future by visual analytics methods to provide intuitive visualization of the changes among SLI parameter adjustment, distribution of samples and model accuracy.
Acknowledgements
The authors would like to express their gratitude to EditSprings (https://www.editsprings.cn) for the expert linguistic services provided and Geographic Data Sharing Infrastructure, Geographic Data Sharing Infrastructure, Resource and Environment Science and Data Center (http://www.resdc.cn), National Geological Archive of China (https://www.ngac.cn) and National Earth System Science Data Center (http://www.geodata.cn) for the data support.
Disclosure statement
No potential conflict of interest was reported by the author(s).
Additional information
Funding
References
- Abu El-Magd, Sherif Ahmed, Sk Ajim Ali, and Quoc Bao Pham. 2021. “Spatial Modeling and Susceptibility Zonation of Landslides Using Random Forest, Naïve Bayes and K-Nearest Neighbor in a Complicated Terrain.” Earth Science Informatics 14 (3): 1227–1243. doi:10.1007/s12145-021-00653-y.
- Akinci, Halil, and Mustafa Zeybek. 2021. “Comparing Classical Statistic and Machine Learning Models in Landslide Susceptibility Mapping in Ardanuc (Artvin), Turkey.” Natural Hazards 108 (2): 1515–1543. doi:10.1007/s11069-021-04743-4.
- Ali, Sk Ajim, Farhana Parvin, Quoc Bao Pham, Khaled Mohamed Khedher, Mahro Dehbozorgi, Yasin Wahid Rabby, Duong Tran Anh, and Duc Hiep Nguyen. 2022. “An Ensemble Random Forest Tree with SVM, ANN, NBT, and LMT for Landslide Susceptibility Mapping in the Rangit River Watershed, India.” Natural Hazards 113 (3): 1601–1633.
- Ali, Sk Ajim, Farhana Parvin, Jana Vojteková, Romulus Costache, Nguyen Thi Thuy Linh, Quoc Bao Pham, Matej Vojtek, Ljubomir Gigović, Ateeque Ahmad, and Mohammad Ali Ghorbani. 2021. “GIS-based Landslide Susceptibility Modeling: A Comparison Between Fuzzy Multi-Criteria and Machine Learning Algorithms.” Geoscience Frontiers 12 (2): 857–876. doi:10.1016/j.gsf.2020.09.004.
- Carrara, A., M. Cardinali, R. Detti, F. Guzzetti, V. Pasqui, and P. Reichenbach. 1991. “GIS Techniques and Statistical Models in Evaluating Landslide Hazard.” Earth Surface Processes and Landforms 16 (5): 427–445. doi:10.1002/esp.3290160505.
- Carrara, Alberto, Mauro Cardinali, Fausto Guzzetti, and Paola Reichenbach. 1995. GIS Technology in Mapping Landslide Hazard. Springer.
- Chefaoui, Rosa M., and Jorge M. Lobo. 2008. “Assessing the Effects of Pseudo-Absences on Predictive Distribution Model Performance.” Ecological Modelling 210 (4): 478–486. doi:10.1016/j.ecolmodel.2007.08.010.
- Chen, Zhuo, Shouyun Liang, Yutian Ke, Zhikun Yang, and Hongliang Zhao. 2020. “Landslide Susceptibility Assessment Using Different Slope Units Based on the Evidential Belief Function Model.” Geocarto International 35 (15): 1641–1664. doi:10.1080/10106049.2019.1582716.
- Costache, Romulus, Sk Ajim Ali, Farhana Parvin, Quoc Bao Pham, Alireza Arabameri, Hoang Nguyen, Anca Crăciun, and Duong Tran Anh. 2021. “Detection of Areas Prone to Flood-Induced Landslides Risk Using Certainty Factor and its Hybridization with Fahp, Xgboost and Deep Learning Neural Network.” Geocarto International p (p): 1–36. doi: 10.1080/19475705.2021.1920480.
- Dahal, RanjanKumar, Shuichi Hasegawa, Netra Prakash Bhandary, Prem Prasad Poudel, Atsuko Nonomura, and Ryuichi Yatabe. 2012. “A Replication of Landslide Hazard Mapping at Catchment Scale.” Geomatics, Natural Hazards and Risk 3 (2): 161–192. doi:10.1080/19475705.2011.629007.
- Erener, A., and H. S. B. Düzgün. 2012. “Landslide Susceptibility Assessment: What are the Effects of Mapping Unit and Mapping Method?” Environmental Earth Sciences 66 (3): 859–877. doi:10.1007/s12665-011-1297-0.
- Giles, Philip T., and Steven E. Franklin. 1998. “An Automated Approach to the Classification of the Slope Units Using Digital Data.” Geomorphology (Amsterdam, Netherlands) 21 (3): 251–264.
- Guzzetti, Fausto, Alberto Carrara, Mauro Cardinali, and Paola Reichenbach. 1999. “Landslide Hazard Evaluation: A Review of Current Techniques and Their Application in a Multi-Scale Study, Central Italy.” Geomorphology 31 (1-4): 181–216.
- Heckerman, David. 1986. “Probabilistic Interpretations for Mycin's Certainty Factors.” In Machine Intelligence and Pattern Recognition, edited by N. Laveen and John F. Kanal. Lemmer: North-Holland.
- Hu, Qiao, Yi Zhou, Shixing Wang, and Futao Wang. 2020. “Machine Learning and Fractal Theory Models for Landslide Susceptibility Mapping: Case Study from the Jinsha River Basin.” Geomorphology 351: Article 106975. doi:10.1016/j.geomorph.2019.106975.
- Huang, Faming, Siyu Tao, Zhilu Chang, Jinsong Huang, Xuanmei Fan, Shui-Hua Jiang, and Wenbin Li. 2021. “Efficient and Automatic Extraction of Slope Units Based on Multi-Scale Segmentation Method for Landslide Assessments.” Landslides 18 (11): 3715–3731. doi:10.1007/s10346-021-01756-9.
- Jacobs, Liesbet, Matthieu Kervyn, Paola Reichenbach, Mauro Rossi, Ivan Marchesini, Massimiliano Alvioli, and Olivier Dewitte. 2020. “Regional Susceptibility Assessments with Heterogeneous Landslide Information: Slope Unit- vs. Pixel-Based Approach.” Geomorphology 356: Article 107084.
- Kavzoglu, Taskin, Emrehan Kutlug Sahin, and Ismail Colkesen. 2014. “Landslide Susceptibility Mapping Using GIS-Based Multi-Criteria Decision Analysis, Support Vector Machines, and Logistic Regression.” Landslides 11 (3): 425–439. doi:10.1007/s10346-013-0391-7.
- Lin, Cheng-Han, Ming-Lang Lin, Hou-Ren Peng, and Hsi-Hung Lin. 2018. “Framework for Susceptibility Analysis of Layered Rock Slopes Considering the Dimensions of the Mapping Units and Geological Data Resolution at Various map Scales.” Engineering Geology 246: 310–325. doi:10.1016/j.enggeo.2018.10.004.
- Liu, Lei-Lei, Yi-LiZhang, TingXiao and CanYang. 2022. “A Frequency Ratio–Based Sampling Strategy for Landslide Susceptibility Assessment.” Bulletin of Engineering Geology and the Environment 81(9). doi: 10.1007/s10064-022-02836-3.
- Martinello, Chiara, Chiara Cappadonia, Christian Conoscenti, Valerio Agnesi, and Edoardo Rotigliano. 2021. “Optimal Slope Units Partitioning in Landslide Susceptibility Mapping.” Journal of Maps 17 (3): 152–162.
- Massimiliano, Alvioli, Marchesini Ivan, Reichenbach Paola, Rossi Mauro, Ardizzone Francesca, Fiorucci Federica, and Guzzetti Fausto. 2016. “Automatic Delineation of Geomorphological Slope Units with r.Slopeunits v1.0 and Their Optimization for Landslide Susceptibility Modeling.” Geoscientific Model Development 9 (11): 3975–3991.
- Pham, Quoc Bao, Yacine Achour, Sk Ajim Ali, Farhana Parvin, Matej Vojtek, Jana Vojteková, Nadhir Al-Ansari, et al. 2021. “A Comparison among Fuzzy Multi-Criteria Decision Making, Bivariate, Multivariate and Machine Learning Models in Landslide Susceptibility Mapping.” Geomatics, Natural Hazards and Risk 12 (1): 1741–1777. doi:10.1080/19475705.2021.1944330.
- Philip, T. Giles, and E. Franklin Steven. 1998. “An Automated Approach to the Classification of the Slope Units Using Digital Data.” Geomorphology 21 (3): 251–264.
- Qi, Junde, Bing Chen, and Dinghua Zhang. 2020. “Multi-information Fusion-Based Belt Condition Monitoring in Grinding Process Using the Improved-Mahalanobis Distance and Convolutional Neural Networks.” Journal of Manufacturing Processes 59: 302–315. doi:10.1016/j.jmapro.2020.09.061.
- Romstad, B., and B. Etzelmueller. 2012. “Mean Curvature Watersheds; a Simple Method for Segmentation of a Digital Elevation Model Into Terrain Units.” Geomorphology (Amsterdam, Netherlands) 139-140: 293–302.
- Romstad, B., and B. Etzelmüller. 2009. “Structuring the Digital Elevation Model Into Landform Elements Through Watershed Segmentation of Curvature.” Proceedings of Geomorphometry 31: 55.
- Shortliffe, E. H., and E. Buchanan. 1975. “A Model of Inexact Reasoning in Medicine.” Mathematical Biosciences 23 (3-4).
- Thomas, Anjana V., Sunil Saha, Jean Homian Danumah, S. Raveendran, Megha K. Prasad, R. S. Ajin, and Sekhar L. Kuriakose. 2021. “Landslide Susceptibility Zonation of Idukki District Using GIS in the Aftermath of 2018 Kerala Floods and Landslides: A Comparison of AHP and Frequency Ratio Methods.” Journal of Geovisualization and Spatial Analysis 5 (2): 21. doi:10.1007/s41651-021-00090-x.
- van Westen, C. J., T. W. J. van Asch, and R. Soeters. 2006. “Landslide Hazard and Risk Zonation—why is it Still so Difficult?” Bulletin of Engineering Geology and the Environment 65 (2): 167–184. doi:10.1007/s10064-005-0023-0.
- Wang, Kai, Shaojie Zhang, Ricardo DelgadoTéllez, and Fangqiang Wei. 2019. “A new Slope Unit Extraction Method for Regional Landslide Analysis Based on Morphological Image Analysis.” Bulletin of Engineering Geology and the Environment 78 (6): 4139–4151. doi:10.1007/s10064-018-1389-0.
- Xiao, Chen Chao, Yuan Tian, WenZhong Shi, QingHua Guo, and Lun Wu. 2010. “A new Method of Pseudo Absence Data Generation in Landslide Susceptibility Mapping with a Case Study of Shenzhen.” Science China Technological Sciences 53 (S1): 75–84.
- Yalcin, Ali, and Fikri Bulut. 2007. “Landslide Susceptibility Mapping Using GIS and Digital Photogrammetric Techniques: A Case Study from Ardesen (NE-Turkey).” Natural Hazards 41 (1): 201–226.
- Zeng, Haowei, Qing Zhu, Yulin Ding, Han Hu, Li Chen, Xiao Xie, Min Chen, and Yanxia Yao. 2022. “Graph Neural Networks with Constraints of Environmental Consistency for Landslide Susceptibility Evaluation.” International Journal of Geographical Information Science 36 (11): 2270–2295. doi:10.1080/13658816.2022.2103819.
- Zhu, A-Xing, Yamin Miao, Junzhi Liu, Shibiao Bai, Canying Zeng, Tianwu Ma, and Haoyuan Hong. 2019. “A Similarity-based Approach to Sampling Absence Data for Landslide Susceptibility Mapping Using Data-driven Methods.” Catena 183: Article 104188.