
 ?Mathematical formulae have been encoded as MathML and are displayed in this HTML version using MathJax in order to improve their display. Uncheck the box to turn MathJax off. This feature requires Javascript. Click on a formula to zoom.
ABSTRACT
Understanding housing preferences is critical for successful compact city development. However, there is limited research on understanding preference heterogeneity in dwelling type choices. Using the Household Income and Labour Dynamics in Australia survey, this paper identifies the key housing and built environment characteristics associated with changes in dwelling type choice from detached houses to high-density. A latent class choice model captures the heterogeneity of dwelling type preferences within a traditionally low-density city, Brisbane, Australia. Findings reveal six household classes with distinct dwelling preferences: Class 1 (senior households without children with other family members) and Class 2 (couple families with children) in inner-city areas, Class 3 (high-income young households) and Class 4 (low-income households without children) in middle-city areas, Class 5 (low-income families with children) and Class 6 (middle-income young families without children) in outer-city areas. Residential environments with better access to educational facilities encourage Classes 3 and 6 to change to high-density living. Greater land use diversity encourages Classes 2, 3, and 6 to move towards high-density living. The findings can be used to design and improve high-density housing for targeted population groups across inner-, middle- and outer-city areas.
1. Introduction
High-density housing has been promoted by governments worldwide to manage urban growth and achieve sustainable city goals (Howley Citation2009; Liao, Farber, and Ewing Citation2015; Myers and Gearin Citation2001). Inner-cityFootnote1 apartment living enhances community liveability, supports ethnic diversity, and addresses sustainability concerns through minimising automobile reliance (Howley Citation2009). However, inner-city apartment living also results in negative impacts, including increasing traffic-induced noise and air pollution (Aristodemou et al. Citation2018; Tang and Wang Citation2007). There are also constraints due to limited supplies of easily developable land, such as large former industrial or undeveloped sites available for high-rise apartment construction in inner-city areas (Gallagher, Liu, and Sigler Citation2019). This necessitates the exploration of alternatives to inner-city high-rise apartments, including middle housing, and high-density housing in outer urban areas. While scientific and policy attention has focused more on high-rise apartments in urban inner-city areas, less attention has been given to middle housing (MH), also called the ‘missing middle housing’Footnote2, a housing type that is currently in short supply (Parolek Citation2012). This housing type is important in housing supply and compact city development (Parolek Citation2020; Maharaj Citation2020). High-density housing in outer-city areas is also infrequently investigated in the existing literature. Lower housing prices, better accessibility to green spaces, and spacious dwelling sizes in high-density housing in outer urban areas may have the potential to both attract residents and achieve high-density living (Lee, Beamish, and Goss Citation2008). Examining who chooses and why they choose high-density dwelling types (both middle housing and medium- to high-rise residential) not only in inner-city areas, but also in the middle-city and outer-city areas, can help planners and policymakers understand the public demand for high-density living, and plan for high-density housing provision across urban areas.
The term ‘housing choice’ in this paper refers to ‘actual housing choice’ (hereinafter termed as ‘housing choice’). The term ‘housing preference’ in this paper refers to certain features any consumer wants to have in choosing a house to live (e.g. housing price, dwelling size). Existing studies on housing choice have found that housing preferences for certain features, such as housing or built environment characteristics, are heterogeneous in nature. For example, some people are more concerned with housing prices (Olanrewaju and Woon Citation2017), while others pay more attention to dwelling size (McKinlay, Baldwin, and Stevens Citation2019) or land-use diversity in the surrounding area (Koster and Rouwendal Citation2012).
Previous studies have employed various segmentation approaches to identify population groups with homogeneous preferences in housing choices, including lifestyle orientation (Walker and Li Citation2007), household socioeconomic variables (Niedomysl Citation2008), and latent psychological factors derived from attitude indicators (Lee et al. Citation2019; Cockx and Canters Citation2020). Multiple studies have examined the role of preference heterogeneity in housing choice, including location choice (e.g. Walker and Li Citation2007; Cockx and Canters Citation2020) and tenure choice (e.g. Chen Citation2016), but in one of the subsets of housing choice studies—dwelling type choices, the role of preference heterogeneity has yet to be explored. Understanding preference heterogeneity in dwelling type choices is important because the failure to account for the variations adequately could lead to an inappropriate or inadequate housing supply, which may further lead to the housing mismatch between the supply and the demand for dwelling types (Kelly, Weidmann, and Walsh Citation2011).
To address these knowledge gaps, this paper aims to examine the heterogeneity of housing preferences in dwelling type choices. Specifically, we identify the key features that might invoke housing choice change from low-density residences (detached houses) to high-density dwellings (both middle housing and medium- to high-rise residential) for different household groups. We also examine the role of preference heterogeneity in dwelling type choices in not only inner-city areas, but also middle and outer-urban areas. Our findings can provide evidence for housing provision policy-making and implementation by helping decision-makers target specific population groups who are likely to be receptive to the change from detached houses to high-density dwellings, particularly in outer city areas.
The ensuing section introduces critical background information for understanding high-density housing choices and the modelling of housing preference heterogeneity. This is followed by the case study context, data, and methods. The results section presents and discusses the housing and built environment characteristics that determine the preference heterogeneity of different household groups across inner-, middle- and outer-city areas. Section 5 summarises the key findings and outlines policy implications for promoting high-density development, before reporting our conclusion and avenues of future research in the final section.
2. Literature review
2.1. Who lives in high-density housing and why?
A large number of academic studies have investigated people from different socioeconomic and demographic backgrounds who live in high-density dwelling types and why they chose these types of dwellings. Questions of high-density dwelling type choice have largely been investigated through multi-dimensional factors, including household demographic, housing, and built environment characteristics (Habib and Miller Citation2009; Lee et al. Citation2010; Pinjari et al. Citation2011; Van Ham Citation2012). Previous literature has shown that those who are highly educated professionals, students, young single professionals, double income no kids (DINKs), young urban professionals (YUPPIES)are most likely to rent high-rise apartments in inner urban areas (Allen and Blandy Citation2004; Randolph Citation2006). As they grow older or start a family, these people often leave inner-city apartments (Andrew and Meen Citation2006). After children have left a household and family size decreases, some may return to inner-city apartments to enjoy low-maintenance, inner-city lifestyles (Kwon Citation2012). Housing characteristics such as monthly costs, tenure, and the number of bedrooms are often considered in conjunction with a range of other factors when residents make housing decisions (Schirmer, van Eggermond, and Axhausen Citation2014; Tong et al. Citation2020). Furthermore, a number of the built environment and socioeconomic characteristics have been shown to influence housing choices, including land-use mix, population density, employment density, neighbourhood socioeconomic status, distance to transport provisions, facilities, and education resources (Ghasri and Rashidi Citation2018; Tokunaga and Murota Citation2022; Kerr, Klocker, and Gibson Citation2021; Torres, Greene, and de D Ortúzar Citation2013).
Existing housing choice studies have tended to focus on residents and their reasons for choosing inner-city high-rise apartments. Middle housing (MH) has received less attention in housing choice studies. Housing choice studies show a high demand for MH, as this high-density housing type is recommended as an affordable housing tool to accommodate different income levels, lifestyles, and demographics (Parolek Citation2012; Parolek Citation2020; An et al. Citation2022). Existing high-density housing choice studies also give less attention to the suburban context, where housing and built environment characteristics may be substantially different from that of inner-city areas. High-density housing choices in outer suburbs have been largely overlooked (Larco Citation2010). Dwellings in outer suburbs tend to be more affordable and larger than those in inner-city suburbs. The built environment in outer-city suburbs tends to feature more abundant open space, less crowded transport, and lower density than in inner-city areas (Brody Citation2013; Williamson Citation2013). Today, more and more high-density dwellings in outer urban areas are alternatives to detached houses (Rosewall and Shoory Citation2017; Australian Bureau of Statistics Citation2022). In contrast, there is limited easily developable land (e.g. large former industrial or undeveloped sites) available for apartment construction in inner-city areas (Gallagher, Liu, and Sigler Citation2019). The high demand for MH, in combination with the limited available land for high-density development in inner-city areas, creates a situation that necessitates the exploration of high-density housing choices in outer urban areas.
2.2. Modelling the heterogeneity of housing preference
Studies have shown that households’ preferences for housing choices are heterogeneous in nature. To account for this preference heterogeneity, segmentation approaches are often applied by studies to classify individuals or households into segments (or subgroups) that have the same preferences(Kamakura and Russell Citation1989). One of these segmentation approaches is to use observable socio-demographic and economic variables to determine a variable for segmentation and the number of segments. This approach is usually called the a-priori approach. For example, the population might be divided into two segments based on gender (Devlin Citation1994) or age (Jancz and Trojanek Citation2020). Though this approach is simple, the assumed homogeneity within each segment cannot be guaranteed (Fu and Juan Citation2017).
Another segmentation option is the a-posteriori approach, a multivariate statistical classification technique that contains richer information (e.g. unobservable latent psychological factors) in describing each segment. One of the most popular a-posteriori approaches is cluster analysis. This analysis is performed based on certain selected variables, such as socio-demographic characteristics and latent psychological factors derived from a large number of attitudinal indicators (Salomon, Waddell, and Wegener Citation2002). For example, Ge and Hokao (Citation2006) used cluster analysis to obtain three residential lifestyles in two Japanese cities, Saga and Kitakyushu. However, Bhat (Citation1997) noted that using cluster analysis might pose difficulties in estimating and interpreting parameters. Two other popular a-posteriori approaches are the mixed logit model (McFadden and Train Citation2000) and the latent class model (LCM) (McFadden Citation1986). The mixed logit model captures the random variation of individual tastes and takes into account unobserved covariates over time. Hoshino (Citation2011) employed a mixed logit model to identify the heterogeneity of housing preferences in Tokyo, and the result revealed significant heterogeneity in some residential attributes, such as residential land use. Though the mixed logit model effectively identifies residential preference heterogeneity, it cannot capture the different preferences of different segments (Ma et al. Citation2015).
To capture the preferences of different segments of a population, the LCM probabilistically assigns each respondent to each segment, in which both the membership probability and choice probability are simultaneously estimated (Wedel and Kamakura Citation2000). On the basis of individual and household socio-demographic characteristics (e.g. household income and structure), Walker and Li (Citation2007) identified three lifestyle groups, including suburban, auto, and school-oriented, transit and school-oriented but in a suburban setting, and urban and auto-oriented; Liao, Farber, and Ewing (Citation2015) found that those most likely to choose compact and transit-oriented neighbourhoods included: families with fewer school-age children; low-income households and renters; and individuals who valued social heterogeneity with less desire for privacy. In Kitchener Waterloo, Canada, Huang, Parker, and Minaker (Citation2021) found that seniors and smaller-sized households were more likely to choose a transit-oriented development neighbourhood due to the transit accessibility, walkability, and green open space in the neighbourhoods. Cockx and Canters (Citation2020) found that tenure status, education level, nationality, and household type distinguish heterogeneous residential location preference profiles in Belgium. However, the mechanisms of the preference heterogeneity in dwelling type choice studies yet remain unexplored (Kelly, Weidmann, and Walsh Citation2011; Yeoman and Akehurst Citation2015).
3. Study context, data, and method
3.1. Study context
The Brisbane local government area (hereon referred to as ‘Brisbane’) is the capital city of the State of Queensland (). It is located in South East Queensland, one of the fastest-growing metropolitan regions in Australia. Brisbane has recently undertaken initiatives to increase the diversity and density of its residential dwellings (Queensland Government Citation2017). The traditional housing supply dominated by detached houses has resulted in adverse environmental impacts, and has been criticised as being unsustainable (Queensland Government Citation2017). Considering recent high population growth rates and net interstate migration (Australian Government Citation2021), there is a need to think about where and how to accommodate the increasing population in a sustainable way—for example, by having more population living in high-density housing rather than detached houses. However, until now, there has been little research in Brisbane that explores the feasibility of how housing preferences could be changed to favour high-density housing over detached houses. Therefore, this study seeks to identify who (potential household groups) and why (potential influencing factors) people choose high-density housing in Brisbane.
Figure 1. The study area.
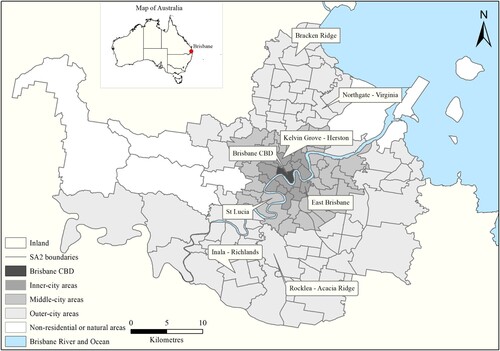
The study area was classified into three urban areas (), in accordance with the latest definition provided by the Brisbane City Council (Citation2021). Areas were excluded if they were non-residential (i.e. with less than 50 households) or predominately national parks, state forests, lakes, and other water bodies, or industrial areas (i.e. the airport) in the northeast of Brisbane.
3.2. Data collection and processing
Data used in this study include: (1) the HILDA survey, and (2) built environment data obtained from multiple resources.
3.2.1. HILDA survey
The HILDA survey is an ongoing longitudinal survey that has been running since 2001 (Summerfield et al. Citation2018). The survey records a wide range of detailed individual and household characteristics such as household composition, income, dwelling structure, and residential mobility, with the objective of representing as wide a range of the Australian population as possible. Brisbane HILDA data from 2006 to 2016 have been selected for this study to ensure the consistency of administrative boundariesFootnote3 and an adequate number of observations. Referring to existing dwelling type choice studies (Liao, Farber, and Ewing Citation2015; Yeoman and Akehurst Citation2015), we extracted three household variables (household size, household type, and household income) and five dwelling variables (the dwelling structure, the number of bedrooms, tenure, rent, and mortgage) from the HILDA data.
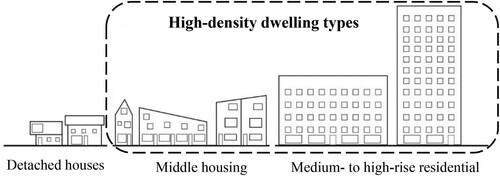
We categorised dwelling structures into three types as per the classification by the Queensland Government (Citation2017). As shown in , the dwelling types in this study are (1) DH: detached houses, single-family homes, and single-detached units; (2) MH: middle housing types, including diverse low- to mid-rise housing types such as duplexes, triplexes, quadplexes, townhouses, and small apartment buildings; and (3) MHR: medium- to high-rise residential (four stories or above).
Figure 2. Dwelling type categories, revised from Parolek (Citation2012).
We reclassified the 26 categories of household type data into six types (one-person household under 40, couple under 40 without children, one-parent household, couple family with children under 15, couple family with children aged 15 years or over, and households over 40 without children), according to the lifecycle theory (Mulder Citation1993). We classified household income into three categories—low-, medium-, and high-income—according to Australian Bureau of Statistics (Citation2017). Finally, we aggregated the monthly rent and mortgage data to create a new variable—monthly housing cost, by referencing a similar work by Yates and Mackay (Citation2006).
3.2.2. Built environment data
Built environment data from multiple sources are used to quantify neighbourhood characteristics. We aggregated built environment data to Statistical Area Level 2 (SA2), a medium-sized statistical unit with a population size ranging from 3000 to 25,000 persons (Australian Bureau of Statistics Citation2016b). SA2s are often used to represent single suburbs or neighbourhoods, and they are suitable to serve as spatial units for analysing housing choices.
We estimated population and employment from 2007 to 2010, and from 2012 to 2015 using the population and employment data from the 2006, 2011, and 2016 censuses, using an annual growth rate calculated as:
(1)
(1)
(2)
(2)
(3)
(3)
(4)
(4) where
and
are the number of populations at the initial year
and the end year
. We calculated the number of populations from 2007 to 2010 by assigning
and
. Similarly, population and employment numbers from 2012 to 2015 were similarly estimated. Then we calculated the population density and employment density by calculating the number of residents and employment per square kilometre.
We quantified the other built environment features using multiple variables as documented in .
Table 1. Variables used in the latent class model.
3.3. Analytical methods
Our analytical process consists of two components (). The first component uses a multinomial logistic regression model (MNL) to identify factors driving dwelling type choices. The dependent variable is the three dwelling type choices, and the reference is the detached house. The independent variables are the three housing variables and nine built environment variables in the Component 1 box. Based on the outputs of Component 1, Component 2 identifies (1) latent household classes, both the number and naming of the class, and (2) the probability of each household class choosing each dwelling type. The dependent variable is the same as that in the MNL. The independent variables are the combination of all the observable variables in . This stage uses the latent class choice model (LCM).
Figure 3. The analytical process.
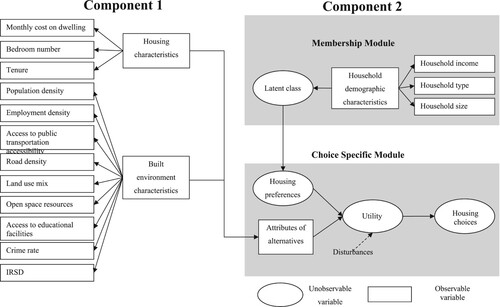
The LCM model consists of two components: (1) the class membership module; and (2) the class specific module ().
The class membership module is a multinomial logistic regression model, and it estimates the probability that household h belongs to class s, and the utility function for the estimation is defined as follows:
(5)
(5) where
is a vector of the socio-demographic characteristics of the household h,
is the class specific constant,
is a vector of parameters that need to be estimated, and
is the random error.
The class specific module is also a multinomial logistic regression model, and the utility function is defined as follows:
(6)
(6) where
denotes the utility of housing choice p for the household h belonging to Class
;
is a vector of observable attributes of housing choice
for household
;
is the random error of the utility specification; and
is a vector of taste parameters for housing choice
with decisions made by Class
and this parameter will capture the housing choice heterogeneity; for example, some classes might be more sensitive to housing variables, such as monthly cost and the number of bedrooms, while others might make a decision based on their preference for other built environment variables, such as crime rate or access to educational facilities. The advantage of using LCM is, this model can simultaneously estimate (1) the probability of households belonging to latent classes and (2) the probability of each latent household class choosing each alternative. Therefore, we choose LCM as the analytical method to analyse who and why choose certain dwelling types.
We run this two-component analytical method using Apollo, an open-source R package (Hess and Palma Citation2019). We used three sets of metrics to measure the model’s goodness-of-fit, including Bayesian Information Criteria (BIC), Akaike Information Criteria (AIC), and rho-bar squared. Higher rho-bar squared, lower BIC, and lower AIC indicate better model fit. In addition to these three metrics, we also measure the model’s goodness-of-fit based on interpretability (Rid and Profeta Citation2011; Walker and Li Citation2007; Liao, Farber, and Ewing Citation2015).
All the dependent and independent variables were based on HILDA survey and built environment data (). The number of latent classes (household classes in this paper) is unobservable, so we experimented with three possible numbers of classes in each urban area to identify the best latent number of household classes. After identifying the number of household classes, we produced a map to illustrate the location probability of each class. The map used an equal interval classification method to maximise the visual difference between household classes.
Before conducting the regression, we examined the potential collinearity amongst different variables using variance inflation factor (VIF) (Table S1). All the VIFs were less than 10, indicating that there was no multicollinearity among the independent variables (Kennedy Citation2008).
4. Results
4.1. Demographic, housing, and built environment profile
Table S2 presents the descriptive statistics for each of the variables used in this study. People tend to choose detached houses in each urban ring. Of all the dwelling choices in the study, only 26.61% of the housing choices are middle housing and medium- to high-rise residential, generally representing the low occupancy rate of residential choice by high-density dwellings in Brisbane. In terms of the three dwelling types, middle housing has the lowest choice proportion across the three urban rings. This dwelling choice pattern could be attributed to the availability of each dwelling type across different urban areas, as suggested by the Queensland Government (Citation2017).
4.2. Identification of latent household classes
In determining the best specification, both the number and naming, for each latent household class in each of the three urban areas, various latent classes and model specifications have been tested. We ran nine models with different household class numbers (). For each urban area, the two-class model was chosen based on its fit statistics and degree of interpretability.
Table 2. Estimated choice model performance.
Based on the selected two-class models in each urban area, we named each household class according to the coefficients of household demographic characteristics in the class membership module (). Overall, we have six household classes: Class 1 (senior households without children with other family members) constitutes 34.02% of the sample population in inner-city suburbs and mainly consists of elder households without children but with other related or unrelated people living in the same dwelling; Class 2 (couple families with children) constitutes 65.98% of the sample population in the inner-city suburbs; Class 3 (high-income young households) constitutes 54.82% of the sample population in middle suburbs and it consists largely of the young high-income couples without kids, and couple families with children under 15; Class 4 (low-income households without children) constitutes 45.18% of the sample population in middle suburbs, and it is likely to consists of lower-income young singles or older households without children; Class 5 (low-income families with children) constitutes 79.30% of the sample population in outer-city suburbs; and Class 6 (middle-income young families without children) constitutes 20.70% of the sample population in outer-city suburbs. The following analysis is based on the clarification of these six classes.
Table 3. Class membership module.
4.3. Determinants of dwelling type choices for each household class
presents the extent to which each housing and built environment feature is associated with the dwelling type choices of each household class. The probability of households belonging to a certain household class is averaged over SA2s for identifying the spatial distribution of different household classes ().
Figure 4. Probability of belonging to household classes.
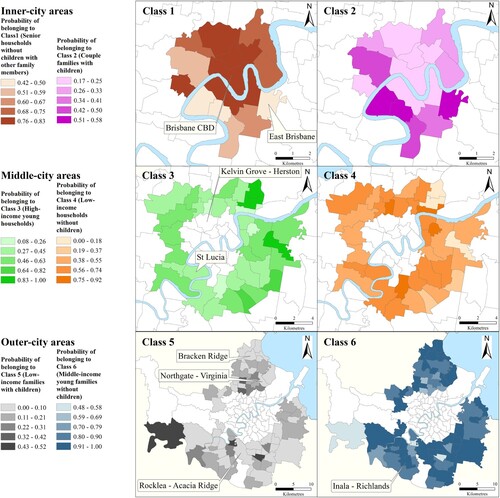
Table 4. Class-specific choice module.
Model 1 (for inner-city areas) consists of two household-level dwelling preference classes. Class 1 (senior households without children with other family members) is likely to choose smaller-sized high-density dwellings with neighbourhoods that feature high green coverage, high crime rates, and less access to public transportation. They are likely to be concentrated in Brisbane CBD and the surrounding suburbs. Class 2 (couple families with children) is likely to choose smaller sized high-density dwellings with the neighbourhood featured by high green coverage, high land use mix, and high crime rates. These households tend to be concentrated in the suburbs such as East Brisbane and other suburbs along the Brisbane River ().
Model 2 (for middle-city areas) consists of two household-level dwelling preference classes. Class 3 (high-income young households) is likely to choose smaller-sized high-density dwellings in neighbourhoods featuring high population density, high green coverage, good access to educational facilities, lower road density, high mixed land use, and high crime rates. Class 4 (low-income households without children) tends to be unaffected by most built environment variables except for population density and Access to public transportation. These low-income young singles are largely young graduates or just entering employment. They tend to be concentrated in or around suburbs near universities, namely, Kelvin Grove (the Queensland University of Technology) and St Lucia (the University of Queensland).
Model 3 (for outer-city areas) consists of two household-level dwelling preference classes. Class 5 (low-income families with children) is likely to rent smaller-sized high-density dwellings in neighbourhoods with high population density, low road density, high mixed land use, low access to educational facilities, and low IRSD. Class 6 (middle-income young couple families without children) is likely to choose smaller-sized high-density dwellings in neighbourhoods featuring a high population density, high green coverage, high mixed land use, higher access to educational facilities, and lower IRSD. They tend to be concentrated in outer-south suburbs like Inala-Richlands and Rocklea-Acacia Ridge or outer-northern suburbs such as Bracken Ridge and Northgate–Virginia, with good accessibility to education and other amenities.
We further examined the dwelling type choice changes under hypothetical changes in housing and built environment characteristics. The results are presented in , where the percentage of dwelling type choice changes of each household class is listed in response to a 1% increase in each built environment characteristic and a 100% increase in bedroom numbers. Doubling the number of bedrooms in a dwelling will decrease the probability of residents choosing high-density dwellings, especially for Class 2 in the inner-city area (−136.66% in choosing MH and −118.59% in choosing MHR), Class 4 in the middle-city area (−217.59% in choosing MH and −226.39% in choosing MHR), and Class 5 in the outer-city area (−232.43% in choosing MH and −235.28% in choosing MHR). This is reasonable as these three households are either small-sized families or low-income households, both of whom are unlikely to need additional bedrooms and may not be able to afford the housing costs associated with these increased dwelling sizes (Clinton Citation2018). The 1% increase in transport accessibility (e.g. higher road density, more bus stations) is unlikely to increase the probability of residents choosing high-density dwellings, except for those in Class 2 in the inner-city area, who may choose MHR due to increased road density. A plausible explanation is that most residents in high-density dwellings may be concerned with the negative impacts of increased transport accessibility (e.g. traffic congestion), despite Class 2 in the inner-city area may pay more attention to the positive impacts of high road density (e.g. slower traffic and more pedestrian crossing opportunities) (Mortezaei Citation2012).
Table 5. Dwelling type choice changes under hypothetical changes.
Access to educational facilities plays an active role in increasing the likelihood of choosing high-density housing, arriving at growths of +90.95% for Class 3 in the middle-city area choosing MH and +98.99% for Class 6 households in the outer-city area choosing MHR. The only exception to this trend can be found in Class 5 in the outer-city area. Class 5 consists primarily of larger-size low-income households that may not be able to afford the increase in housing prices that would result from increased educational accessibility (Guo et al. Citation2016). Similarly, an increase in land-use mix leads to a significant increase in the probability of residents choosing high-density dwelling types, from +2.74% to +254.92%. This is reasonable as more diverse urban land use usually indicates more convenient access to different types of activities in the neighbourhood, and apartment dwellers have been identified as placing a higher value on land-use mix than detached house dwellers (Koster and Rouwendal Citation2012). However, in the inner-city area, the increase in green coverage would increase the probability of choosing MH (+1777.87% for Class 1 households and +6.45% for Class 2 households) but decrease the likelihood of choosing MHR (−65.79% for Class 1 households and −52.47% for Class 2 households). One plausible explanation explanation is that the MH may have more direct access to green space than MHR, and as such, MH dwellers value green coverage more than MHR dwellers. In addition, the increase in crime will increase the probability of people choosing MHR dwellings which usually have better security characteristics, such as security cameras and key code entry systems (Australian Bureau of Statistics Citation2021).
5. Discussion
This study extends the existing literature (Kelly, Weidmann, and Walsh Citation2011; Yeoman and Akehurst Citation2015) by examining the role of preference heterogeneity in dwelling type choice across the inner-, middle- and outer-city areas of Brisbane. Our results show that in each of the three urban areas, two household classes are distinguished by their housing preferences: Class 1 (senior households without children with other family members) and Class 2 (couple families with children) in the inner-city area; Class 3 (high-income young households) and Class 4 (low-income households without children) in the middle-city area; Class 5 (low-income families with children) and Class 6 (middle-income young couple families without children) in the outer-city area. The dwelling choice change probability of each class to housing and built environment characteristics is analysed to discover how the changes in housing and the built environment could increase the probability of residents choosing high-density housing.
Our findings contribute to a more comprehensive understanding of households’ dwelling type choices. Given that current research and housing provision policies for high-density housing have focussed on apartments in inner-city areas, our study analyses high-density dwelling choices across a broader range of dwelling types and urban spaces. The main similarity across the three urban areas is the negative impact of the number of bedrooms and the positive impact of the land-use mix. There are more differences than similarities across the three areas. First, tenure is only found to be associated with the high-density dwelling choices in outer-city suburbs, where most of the residents are low-income apartment renters. Second, Access to public transportation and green coverage is not related to high-density dwelling choices in outer-city suburbs, but it is relevant to high-density dwelling residents in the inner- and middle-urban areas. Specifically, a 1% increase in Access to public transportation will decrease high-density dwelling choice probability, ranging from −26.75% for Class 1 in the inner-city suburbs choosing middle housing to −570.41% for Class 4 in the middle-city suburbs choosing middle housing. This is reasonable as the increase in Access to public transportation will inevitably bring more commuters and, therefore, noise pollution (for example, see Fan, Teo, and Wan Citation2021). The noise pollution is undesirable for residents, especially Class 4 in the middle-city suburbs with older households who are more sensitive to noise than other household groups (Liu et al. Citation2002). An increase in green coverage is likely to increase the probability of high-density dwelling choices for Class 1 and Class 3. Similar results have also been found in previous studies where older adults and couple families with children attach a high level of importance to having access to green spaces (for example, see Aspinall et al. Citation2010; Mulliner, Riley, and Maliene Citation2020; Raynor Citation2018). However, this may not be the case for people living in outer-city areas where an increase in already-abundant green coverage may not sufficiently affect people’s choices of dwelling types. Similarly, access to educational facilities is not related to dwelling type choices for residents in inner-city suburbs where a range of quality education facilities with easy access already exists.
In addition to the above factors, population density is a positive determinant for households in the middle- and outer-city areas choosing high-density dwellings (although this has not been observed to be associated with that of the inner-city area). This is due to the fact that higher residential density usually indicates better urban amenities and the presence of public services (Appold and Yuen Citation2007; Guo et al. Citation2016). This benefit may not sufficiently change people’s housing choices in the inner-city area where sufficient urban amenities and public services already exist. Socioeconomic disadvantage measured as IRSD is likely to be negatively associated with high-density dwelling choices in the outer-city areas.
Our findings provide policy implications for urban planning, housing policy, and real estate development. First, we recommend the design of high-density dwellings be targeted at different household classes with distinguished preferences across all urban areas. For example, in the middle-city area, Class 3 is more likely to be responsive to the variations in education accessibility and mixed land use. Increasing education accessibility, land-use mix, and green coverage in the middle-city area will likely encourage those in Class 3 to switch their preferences to high-density dwellings. Residential zoning policies can take advantage of the characteristics of Class 3 by providing more high-density dwelling types and improving education resource accessibility, mixed land use, and green coverage in the middle-city areas. Second, as there is a substantial share of low-income households (Class 4 and Class 5) that prefer high-density dwelling types, it is suggested that high-density housing developments should be designed to accommodate lower-income residents through reduced prices or mixing rentals with units that are purchasable outright, given that current policy interventions that specifically target low-income residents are limited (Easthope et al. Citation2020). Furthermore, due to the difference in the demographic feature of Class 4 (low-income households without children) and Class 5 (low-income families with children), population-targeted high-density housing construction strategies are recommended. For example, small units for Class 4 in the middle-city area and larger-sized housing for Class 5 in the outer-city area.
There are a number of limitations associated with the current study that can pave the avenue for future research. First, there are two limitations related to the HILDA survey data. One issue is the limited incorporation of dwelling characteristics (three variables, including monthly cost of dwelling, number of bedrooms, and tenure). As such, future analyses could be enriched by the involvement of lot and building architectural details, such as lot size and if the dwelling has a balcony, both of which have been observed to influence people’s dwelling choices (Kelly, Weidmann, and Walsh Citation2011; Yeoman and Akehurst Citation2015). Another issue is that the HILDA survey data tell us less about the subjective attitudes, perceptions, and lifestyles on individual’s self-selection that will influence people’s housing decisions (Olaru, Smith, and Taplin Citation2011; Yang and O’Neill Citation2014). The class membership module presented in this study could be strengthened by incorporating psychometric indicators. An extension could involve a survey of such psychometric indicators such as lifestyle preferences (e.g. using a gym or not), feeling of place belonging, security concerns, etc. Second, the study is limited by the measure of some built environment indicators. We quantified the private transport accessibility using road network data at a one-time point—2013—without considering the dynamic nature of change of this factor over time. Given that this variable is not readily available, it presents opportunities for future research.
6. Conclusion
This study enriches the growing body of knowledge in housing choice studies by modelling residents’ dwelling type choices that consider residents’ preference heterogeneity, which is rarely considered in the current literature. The proposed analytical framework in this study can be readily applied to different geographic contexts, and a variety of urban areas with different urban morphologies (e.g. monocentric and polycentric urban structures). Our findings provide new insights for governments, planning authorities, and housing industries to design and improve high-density properties by enhancing the housing design and neighbourhood-built environment for different households. Catering to the demands of rapidly increasing populations, more efforts are needed to delineate areas for real estate development and/or urban densification and to provide affordable housing to households with different socioeconomic backgrounds. Due to the importance of high-density and mixed housing in accommodating ethnocultural diverse urban populations (Fincher and Costello Citation2005; Liu et al. Citation2018), our analysis of high-density housing is beneficial to help Australia head toward a multicultural and liveable country.
Geolocation information
The study area in this paper is Brisbane, Australia.
Disclosure statement
No potential conflict of interest was reported by the author(s).
Data availability statement
The following data sources that we used in this paper are publicly available and provided by different governments:
Census of Population and Housing datasets from Australian Bureau of Statistics: https://www.abs.gov.au/websitedbs/censushome.nsf/home/historicaldata2006?opendocument&navpos=280. https://www.abs.gov.au/websitedbs/censushome.nsf/home/historicaldata2011?opendocument&navpos=280. https://www.abs.gov.au/websitedbs/censushome.nsf/home/2016.
HILDA Survey from Australian Government: https://dataverse.ada.edu.au/dataverse.xhtml?alias=hilda.
Road dataset from Australian Government: https://data.gov.au/data/dataset/2016-soe-blt-metro-aria-transport.
The Metropolitan Accessibility/Remoteness Index from Australian Government: https://data.gov.au/data/dataset/2016-soe-blt-metro-aria-transport.
Offence rates dataset from Queensland Government: https://www.data.qld.gov.au/dataset/offence-rates-police-divisions-monthly-from-july-2001/resource/b9f21870-af65-487d-8cc0-50fcaa473b3d.
Additional information
Funding
Notes
1 This paper uses the notion of ‘three urban areas’ to explore the heterogeneity in dwelling type preferences across different urban areas. The term is adapted from (Latham Citation2003), who classified Sydney into three distinctive ‘arcs': the ‘global’ arc, the ‘middle’ arc, and the ‘outer’ arc. Similarly, we classify Brisbane into three urban areas: inner-city areas, middle-city areas, and outer-city areas. Inner-city areas refer to the central areas near Central Business Districts (CBDs). These areas are featured by the high-density population and employment. Outer-city areas refer to suburbs located at the periphery of cities. These suburbs are usually featured by high rates of home purchase, car dependence, and single-family dwellings. Middle-city areas are the intermediate zone between the inner-city areas and outer-city areas. This paper uses the notion of ‘three urban areas’ in Brisbane, a monocentric city, as an example. This notion could also be applied in the polycentric city with multiple city centres.
2 Missing middle housing is a high-density housing type, which usually consists of duplexes, triplexes, quadplexes, townhouses, and small apartment buildings.
3 In December 2010, the Australian Statistical Geography Standard (ASGS) was released and replaced the previous Australian Standard Geographical Classification (ASGC) that has been used for the collection and dissemination of geographically classified statistics. Statistics have been based on the ASGS since August 2011.
References
- Allen, Chris, and Sarah Blandy. 2004. “Fables of the Reconstruction: Inner-Urban Regeneration, City Centre Living and the Reinvention of Urban Space.” Paper presented at the international conference of the international sociological association, research committee, Toronto, June 24–27.
- An, Brian Y., Raphael W. Bostic, Andrew Jakabovics, Anthony W. Orlando, and Seva Rodnyansky. 2022. “Small and Medium Multifamily Housing: Affordability and Availability.” Housing Studies 37 (7): 1274–1297. doi:10.1080/02673037.2020.1842339.
- Andrew, Mark, and Geoffrey Meen. 2006. “Population Structure and Location Choice: A Study of London and South East England.” Papers in Regional Science 85 (3): 401–419. doi:10.1111/j.1435-5957.2006.00092.x.
- Appold, Stephen, and Belinda Yuen. 2007. “Families in Flats, Revisited.” Urban Studies 44 (3): 569–589. doi:10.1080/00420980601131860.
- Aristodemou, Elsa, Luz Maria Boganegra, Laetitia Mottet, Dimitrios Pavlidis, Achilleas Constantinou, Christopher Pain, Alan Robins, and Helen ApSimon. 2018. “How Tall Buildings Affect Turbulent air Flows and Dispersion of Pollution Within a Neighbourhood.” Environmental Pollution 233: 782–796. doi:10.1016/j.envpol.2017.10.041.
- Aspinall, Peter A, Catharine Ward Thompson, Susana Alves, Takemi Sugiyama, Roger Brice, and Adrian Vickers. 2010. “Preference and Relative Importance for Environmental Attributes of Neighbourhood Open Space in Older People.” Environment and Planning B: Planning and Design 37 (6): 1022–1039. doi:10.1068/b36024.
- Australian Bureau of Statistics. 2006. “2006 Census data.” Accessed 29th September 2021. https://www.abs.gov.au/websitedbs/censushome.nsf/home/historicaldata2006?opendocument&navpos=280.
- Australian Bureau of Statistics. 2011. “2011 Census data.” Accessed 29th September 2021. https://www.abs.gov.au/websitedbs/censushome.nsf/home/historicaldata2011?opendocument&navpos=280.
- Australian Bureau of Statistics. 2016. “2016 Census.” Accessed 20th September 2021. https://www.abs.gov.au/websitedbs/censushome.nsf/home/2016.
- Australian Bureau of Statistics. 2016. “Statistical Area Level 2 (SA2).” Accessed 29th September 2021. https://www.abs.gov.au/ausstats/[email protected]/Lookup/by%20Subject/1270.0.55.001~July%202016~Main%20Features~Statistical%20Area%20Level%202%20(SA2)∼10014.
- Australian Bureau of Statistics. 2017. “Household Income and Wealth, Australia.” Accessed 29th Spetember 2021. https://www.abs.gov.au/ausstats/[email protected]/Lookup/by%20Subject/6523.0~2015-16~Main%20Features~Characteristics%20of%20Low,%20Middle%20and%20High%20Income%20Households~8.
- Australian Bureau of Statistics. 2021. “Crime Victimisation, Australia, 2017-18 “, Accessed 29th September 2021. https://www.abs.gov.au/ausstats/[email protected]/Lookup/by%20Subject/4530.0~2017-18~Main%20Features~Queensland~43.
- Australian Bureau of Statistics. 2022. “Building Approvals, Australia.” Accessed 9th November 2022. https://www.abs.gov.au/statistics/industry/building-and-construction/building-approvals-australia/latest-release#abs-stat-datasets.
- Australian Government. 2013. “Roads.” Accessed 29th September 2021. https://data.gov.au/dataset/ds-sa-4cc17ac3-ce49-4525-971b-6122023b8937/details.
- Australian Government. 2017. “2016 SoE Built Environment Accessibility to public transport, capital cities, 2011.” Accessed 29th September 2021. https://data.gov.au/data/dataset/2016-soe-blt-metro-aria-transport.
- Australian Government. 2021. “Regional internal migration estimates, provisional, March 2021.” Accessed 29th September 2021. https://population.gov.au/docs/econote_prime_march_2021.pdf.
- Bhat, Chandra R. 1997. “An Endogenous Segmentation Mode Choice Model with an Application to Intercity Travel.” Transportation Science 31 (1): 34–48. doi:10.1287/trsc.31.1.34.
- Brisbane City Council. 2021. “Opportunity: inner city.” Accessed 29th September 2021. https://www.brisbane.qld.gov.au/about-council/governance-and-strategy/business-in-brisbane/growing-brisbanes-economy/opportunity-brisbane/opportunity-inner-city.
- Brody, Samuel. 2013. “The Characteristics, Causes, and Consequences of Sprawling Development Patterns in the United States.” Nature Education Knowledge 4 (5): 2.
- Chen, Guo. 2016. “The Heterogeneity of Housing-Tenure Choice in Urban China: A Case Study Based in Guangzhou.” Urban Studies 53 (5): 957–977. doi:10.1177/0042098015571822.
- Clinton, Emma. 2018. “Micro-Living: Why Occupants Choose to Live in Very Small Dwellings?” Australian Planner 55 (3-4): 189–197. doi:10.1080/07293682.2019.1632363.
- Cockx, Kasper, and Frank Canters. 2020. “Determining Heterogeneity of Residential Location Preferences of Households in Belgium.” Applied Geography 124: 102271. doi:10.1016/j.apgeog.2020.102271.
- Devlin, Ann Sloan. 1994. “Gender-Role and Housing Preferences.” Journal of Environmental Psychology 14 (3): 225–235. doi:10.1016/S0272-4944(94)80058-8.
- Easthope, H., L. Crommelin, L. Troy, G. Davison, M. Nethercote, S. Foster, R. Van Den Nouwelant, A. Kleeman, B. Randolph, and R. Horne. 2020. Improving Outcomes for Apartment Residents and Neighbourhoods. Melbourne: Australian Housing and Urban Research Institute.
- Fan, Yi, Ho Pin Teo, and Wayne X Wan. 2021. “Public Transport, Noise Complaints, and Housing: Evidence from Sentiment Analysis in Singapore.” Journal of Regional Science 61 (3): 570–596. doi:10.1111/jors.12524.
- Fincher, Ruth, and Lauren Costello. 2005. “Narratives of High-Rise Housing: Placing the Ethnicized Newcomer in Inner Melbourne.” Social & Cultural Geography 6 (2): 201–217. doi:10.1080/14649360500074634.
- Fu, Xuemei, and Zhicai Juan. 2017. “Accommodating Preference Heterogeneity in Commuting Mode Choice: An Empirical Investigation in Shaoxing, China.” Transportation Planning and Technology 40 (4): 434–448. doi:10.1080/03081060.2017.1300240.
- Gallagher, Rachel, Yan Liu, and Thomas Sigler. 2019. “Parcel Amalgamation as a Mechanism for Achieving Urban Consolidation Through Densification: The Fixity of Property Boundaries Over Time.” Land Use Policy 89: 104239. doi:10.1016/j.landusepol.2019.104239.
- Ge, Jian, and Kazunori Hokao. 2006. “Research on Residential Lifestyles in Japanese Cities from the Viewpoints of Residential Preference, Residential Choice and Residential Satisfaction.” Landscape and Urban Planning 78 (3): 165–178. doi:10.1016/j.landurbplan.2005.07.004.
- Ghasri, Milad, and Taha Hossein Rashidi. 2018. “Investigating How Household’s Decision on Next Tenure Status Affects Residential Relocation Timing.” Journal of Housing and the Built Environment 33 (2): 385–408. doi:10.1007/s10901-017-9570-5.
- Guo, Yuntao, Shubham Agrawal, Srinivas Peeta, and Sekhar Somenahalli. 2016. “Impacts of Property Accessibility and Neighborhood Built Environment on Single-Unit and Multiunit Residential Property Values.” Transportation Research Record 2568 (1): 103–112. doi:10.3141/2568-15.
- Habib, Muhammad Ahsanul, and Eric J Miller. 2009. “Reference-Dependent Residential Location Choice Model Within a Relocation Context.” Transportation Research Record 2133 (1): 92–99. doi:10.3141/2133-10.
- Hess, Stephane, and David Palma. 2019. “Apollo: A Flexible, Powerful and Customisable Freeware Package for Choice Model Estimation and Application.” Journal of Choice Modelling 32: 100170. doi:10.1016/j.jocm.2019.100170.
- Hoshino, Tadao. 2011. “Estimation and Analysis of Preference Heterogeneity in Residential Choice Behaviour.” Urban Studies 48 (2): 363–382. doi:10.1177/0042098010363498.
- Howley, Peter. 2009. “Attitudes Towards Compact City Living: Towards a Greater Understanding of Residential Behaviour.” Land Use Policy 26 (3): 792–798. doi:10.1016/j.landusepol.2008.10.004.
- Huang, Yu, Dawn Parker, and Leia Minaker. 2021. “Identifying Latent Demand for Transit-Oriented Development Neighbourhoods: Evidence from a Mid-Sized Urban Area in Canada.” Journal of Transport Geography 90: 102940. doi:10.1016/j.jtrangeo.2020.102940.
- Jancz, Anna, and Radoslaw Trojanek. 2020. “Housing Preferences of Seniors and Pre-Senior Citizens in Poland—A Case Study.” Sustainability 12 (11): 4599. doi:10.3390/su12114599.
- Kamakura, Wagner A, and Gary J Russell. 1989. “A Probabilistic Choice Model for Market Segmentation and Elasticity Structure.” Journal of Marketing Research 26 (4): 379–390. doi:10.1177/002224378902600401.
- Kelly, Jane-Frances, Ben Weidmann, and Marcus Walsh. 2011. The Housing We’d Choose. Melbourne: Grattan Institute.
- Kennedy, Peter. 2008. A Guide to Econometrics. 6th ed. Malden, MA: Blackwell.
- Kerr, Sophie-May, Natascha Klocker, and Chris Gibson. 2021. “From Backyards to Balconies: Cultural Norms and Parents’ Experiences of Home in Higher-Density Housing.” Housing Studies 36 (3): 421–443. doi:10.1080/02673037.2019.1709625.
- Koster, Hans RA, and Jan Rouwendal. 2012. “The Impact of Mixed Land Use on Residential Property Values.” Journal of Regional Science 52 (5): 733–761. doi:10.1111/j.1467-9787.2012.00776.x.
- Kwon, Hyun Joo. 2012. “Housing behavior of older adults in multifamily housing.” PhD diss, Virginia Polytechnic Institute and State University.
- Larco, Nico. 2010. “Suburbia Shifted: Overlooked Trends and Opportunities in Suburban Multifamily Housing.” Journal of Architectural and Planning Research 27 (1): 69–87.
- Latham, Mark. 2003. From the Suburbs: Building a Nation from our Neighbourhoods. Annandale, NSW: Pluto Press.
- Lee, Hyun-Jeong, Julia O. Beamish, and Rosemary Carucci Goss. 2008. “Location Preferences of Multifamily Housing Residents.” Housing and Society 35 (1): 41–58. doi:10.1080/08882746.2008.11430557.
- Lee, Yongsung, Giovanni Circella, Patricia L Mokhtarian, and Subhrajit Guhathakurta. 2019. “Heterogeneous Residential Preferences among Millennials and Members of Generation X in California: A Latent-Class Approach.” Transportation Research Part D: Transport and Environment 76: 289–304. doi:10.1016/j.trd.2019.08.001.
- Lee, Brian H Y, Paul Waddell, Liming Wang, and Ram M Pendyala. 2010. “Reexamining the Influence of Work and Nonwork Accessibility on Residential Location Choices with a Microanalytic Framework.” Environment and Planning A: Economy and Space 42 (4): 913–930. doi:10.1068/a4291.
- Liao, Felix Haifeng, Steven Farber, and Reid Ewing. 2015. “Compact Development and Preference Heterogeneity in Residential Location Choice Behaviour: A Latent Class Analysis.” Urban Studies 52 (2): 314–337. doi:10.1177/0042098014527138.
- Liu, Edgar, Hazel Easthope, Christina Ho, and Caitlin Buckle. 2018. “Diversity and Participation in Private Apartment Buildings: A Review of the Literature.” Geographical Research 56 (4): 401–409. doi:10.1111/1745-5871.12282.
- Liu, Wen, Lewis A Lipsitz, Manuel Montero-Odasso, Jonathan Bean, D. Casey Kerrigan, and James J Collins. 2002. “Noise-enhanced Vibrotactile Sensitivity in Older Adults, Patients with Stroke, and Patients with Diabetic Neuropathy.” Archives of Physical Medicine and Rehabilitation 83 (2): 171–176. doi:10.1053/apmr.2002.28025.
- Ma, Tai-Yu, Philippe Gerber, Samuel Carpentier, and Sylvain Klein. 2015. “Mode Choice with Latent Preference Heterogeneity: A Case Study for Employees of the EU Institutions in Luxembourg.” Transportmetrica A: Transport Science 11 (5): 441–463. doi:10.1080/23249935.2015.1007175.
- Maharaj, Shrimatee H Ojah. 2020. “Factors Affecting the Supply of “Missing Middle” Housing Types in Walkable Urban Core Neighborhoods.” Muma Business Review 4: 001–015. doi:10.28945/4544.
- McFadden, Daniel. 1986. “The Choice Theory Approach to Market Research.” Marketing Science 5 (4): 275–297. doi:10.1287/mksc.5.4.275.
- McFadden, Daniel, and Kenneth Train. 2000. “Mixed MNL Models for Discrete Response.” Journal of Applied Econometrics 15 (5): 447–470. doi:10.1002/1099-1255(200009/10)15:5<447::AID-JAE570>3.0.CO;2-1.
- McKinlay, Anna, Claudia Baldwin, and Nicholas J Stevens. 2019. “Size Matters: Dwelling Size as a Critical Factor for Sustainable Urban Development.” Urban Policy and Research 37 (2): 135–150. doi:10.1080/08111146.2017.1374944.
- Mortezaei, G. 2012. “Assessing Social Equity Factors and Dwellers’ Desirability Perception of Compact City Centre Residing.” Paper presented at the 2012 IEEE business, engineering & industrial applications colloquium (BEIAC), Kuala Lumpur, April 7-8.
- Mulder, Clara Helena. 1993. “Migration dynamics: A life course approach.” PhD diss, University of Amsterdam.
- Mulliner, Emma, Mike Riley, and Vida Maliene. 2020. “Older People’s Preferences for Housing and Environment Characteristics.” Sustainability 12 (14): 5723. doi:10.3390/su12145723.
- Myers, Dowell, and Elizabeth Gearin. 2001. “Current Preferences and Future Demand for Denser Residential Environments.” Housing Policy Debate 12 (4): 633–659. doi:10.1080/10511482.2001.9521422.
- Niedomysl, Thomas. 2008. “Residential Preferences for Interregional Migration in Sweden: Demographic, Socioeconomic, and Geographical Determinants.” Environment and Planning A: Economy and Space 40 (5): 1109–1131. doi:10.1068/a39177.
- Olanrewaju, AbdulLateef, and Tan Chai Woon. 2017. “An Exploration of Determinants of Affordable Housing Choice.” International Journal of Housing Markets and Analysis 10 (5): 703–723. doi:10.1108/IJHMA-11-2016-0074.
- Olaru, Doina, Brett Smith, and John H. E. Taplin. 2011. “Residential Location and Transit-Oriented Development in a New Rail Corridor.” Transportation Research Part A: Policy and Practice 45 (3): 219–237. doi:10.1016/j.tra.2010.12.007.
- Parolek, Daniel. 2012. “Missing middle housing: Responding to the demand for walkable urban living.” Accessed 29th September 2021. https://opticosdesign.com/blog/missing-middle-housing-responding-to-the-demand-for-walkable-urban-living-2/.
- Parolek, Daniel G. 2020. Missing Middle Housing: Thinking Big and Building Small to Respond to Today’s Housing Crisis. Washington, D. C: Island Press.
- Pinjari, Abdul Rawoof, Ram M. Pendyala, Chandra R. Bhat, and Paul A. Waddell. 2011. “Modeling the Choice Continuum: An Integrated Model of Residential Location, Auto Ownership, Bicycle Ownership, and Commute Tour Mode Choice Decisions.” Transportation 38 (6): 933–958. doi:10.1007/s11116-011-9360-y.
- Queensland Government. 2017. “ShapingSEQ: South East Queensland Regional Plan 2017.” Accessed 29th September 2021. https://dilgpprd.blob.core.windows.net/general/shapingseq.pdf.
- Queensland Government. 2021. “Offence Rates—police divisions—monthly from July 2001.” Accessed 29th September 2021. https://www.data.qld.gov.au/dataset/offence-rates-police-divisions-monthly-from-july-2001/resource/b9f21870-af65-487d-8cc0-50fcaa473b3d.
- Randolph, Bill. 2006. “Delivering the Compact City in Australia: Current Trends and Future Implications.” Urban Policy and Research 24 (4): 473–490. doi:10.1080/08111140601035259.
- Raynor, Katrina. 2018. “Social Representations of Children in Higher Density Housing: Enviable, Inevitable or Evil?” Housing Studies 33 (8): 1207–1226. doi:10.1080/02673037.2018.1424807.
- Rid, Wolfgang, and Adriano Profeta. 2011. “Stated Preferences for Sustainable Housing Development in Germany—a Latent Class Analysis.” Journal of Planning Education and Research 31 (1): 26–46. doi:10.1177/0739456X10393952.
- Rosewall, Tom, and Michael Shoory. 2017. “Houses and Apartments in Australia.” Accessed 29th September 2021. https://www.rba.gov.au/publications/bulletin/2017/jun/pdf/bu-0617-1-houses-and-apartments-in-australia.pdf.
- Salomon, Ilan, Paul Waddell, and Michael Wegener. 2002. “Sustainable Life Styles? Microsimulation of Household Formation, Housing Choice and Travel Behaviour.” In Social Change and Sustainable Transport, edited by William R. Black and Peter Nijkamp, 125–131. Bloomington: Indiana University Press.
- Schirmer, Patrick M, Michael AB van Eggermond, and Kay W Axhausen. 2014. “The Role of Location in Residential Location Choice Models: A Review of Literature.” Journal of Transport and Land Use 7 (2): 3–21. doi:10.5198/jtlu.v7i2.740.
- Summerfield, Michelle, Simon Freidin, Markus Hahn, Nathan La, Ninette Macalalad, Nicole Watson, Roger Wilkins, and Mark Wooden. 2018. HILDA User Manual–Release 18. Melbourne: Melbourne Institute of Applied Economic and Social Research, University of Melbourne.
- Tang, U. W., and Z. S. Wang. 2007. “Influences of Urban Forms on Traffic-Induced Noise and Air Pollution: Results from a Modelling System.” Environmental Modelling & Software 22 (12): 1750–1764. doi:10.1016/j.envsoft.2007.02.003.
- Tokunaga, Ryoji, and Masako Murota. 2022. “Residential Preferences Based on Life Stage Groups of Residents and Factors Related to Types of Intentions to Continue Living in or Relocating from Super-High-Rise Condominiums.” Journal of Asian Architecture and Building Engineering, 1–18. doi:10.1080/13467581.2022.2052299.
- Tong, De, Yu Zhang, Ian MacLachlan, and Guicai Li. 2020. “Migrant Housing Choices from a Social Capital Perspective: The Case of Shenzhen, China.” Habitat International 96: 102082. doi:10.1016/j.habitatint.2019.102082.
- Torres, Ignacia, Margarita Greene, and J. de D Ortúzar. 2013. “Valuation of Housing and Neighbourhood Attributes for City Centre Location: A Case Study in Santiago.” Habitat International 39: 62–74. doi:10.1016/j.habitatint.2012.10.007.
- Van Ham, M. 2012. “Economics of Housing Choice.” In The International Encyclopedia of Housing and Home, edited by M. Elsinga S, J. Smith, L. Fox-O’Mahony, S. E. Ong, and S. Wachter, 42–46. Oxford: Elsevier.
- Walker, Joan L, and Jieping Li. 2007. “Latent Lifestyle Preferences and Household Location Decisions.” Journal of Geographical Systems 9 (1): 77–101. doi:10.1007/s10109-006-0030-0.
- Wedel, Michel, and Wagner A Kamakura. 2000. Market Segmentation: Conceptual and Methodological Foundations. 2nd ed. Boston: Kluwer Academic.
- Williamson, June. 2013. Designing Suburban Futures: New Models from Build a Better Burb. Washington, DC: Island Press.
- Yang, Yizhao, and Kelly O’Neill. 2014. “Understanding Factors Affecting People’s Attitudes Toward Living in Compact and Mixed-use Environments: A Case Study of a New Urbanist Project in Eugene, Oregon, USA.” Journal of Urbanism: International Research on Placemaking and Urban Sustainability 7 (1): 1–22. doi:10.1080/17549175.2013.827585.
- Yates, Judith, and Daniel F. Mackay. 2006. “Discrete Choice Modelling of Urban Housing Markets: A Critical Review and an Application.” Urban Studies 43 (3): 559–581. doi:10.1080/00420980500533695.
- Yeoman, Rodney, and Greg Akehurst. 2015. The Housing We’d Choose: A Study of Housing Preferences, Choices and Trade-Offs in Auckland. Auckland: Market Economics Limited.