
 ?Mathematical formulae have been encoded as MathML and are displayed in this HTML version using MathJax in order to improve their display. Uncheck the box to turn MathJax off. This feature requires Javascript. Click on a formula to zoom.
ABSTRACT
Accurate landslide extraction is significant for landslide disaster prevention and control. Remote sensing images have been widely used in landslide investigation, and landslide extraction methods based on deep learning combined with remote sensing images (such as U-Net) have received a lot of attention. However, because of the variable shape and texture features of landslides in remote sensing images, the rich spectral features, and the complexity of their surrounding features, landslide extraction using U-Net can lead to problems such as false detection and missed detection. Therefore, this study introduces the channel attention mechanism called the squeeze-and-excitation network (SENet) in the feature fusion part of U-Net; the study also constructs an attention U-Net landside extraction model combining SENet and U-Net, and uses Sentinel-2A remote sensing images for model training and validation. The extraction results are evaluated through different evaluation metrics and compared with those of two models: U-Net and U-Net Backbone (U-Net Without Skip Connection). The results show that proposed the model can effectively extract landslides based on Sentinel-2A remote sensing images with an F1 value of 87.94%, which is about 2% and 3% higher than U-Net and U-Net Backbone, respectively, with less false detection and more accurate extraction results.
1. Introduction
Landslides are a common geological disaster, in which a large amount of rocks, debris, or soil is loosened by rivers, rain, earthquakes, and other factors before moving, downward along a slope under the effect of gravity (Prakash, Manconi, and Loew Citation2020). Landslides are characterized by high hazard and destruction, susceptibility, and suddenness, posing a serious threat to the safety of human life and property worldwide while, causing damage to the surface environment (Cheng et al. Citation2021; Thomas et al. Citation2021; Wandong et al. Citation2021). Therefore, rapid and accurate landslide extraction of landslide areas is essential for carrying out emergency relief work and postdisaster recovery. In addition, accurate landslide extraction to obtain spatial information on landslides, including the location and extent information, is the basis for landslide susceptibility modeling, risk assessment, and other work (Ghorbanzadeh, Gholamnia, and Ghamisi Citation2022; Trinh et al. Citation2022).
Currently, landslide extraction methods mainly include field surveys and investigations, remote sensing methods, and deep learning methods (Li et al. Citation2022; Mohan et al. Citation2021). Field surveys and investigation are the most direct and traditional methods for landslide identification, obtaining landslide information with high accuracy but requiring a lot of labor, material, and time (Li, Shi, Lu, et al. Citation2016). Remote sensing methods include visual interpretation, pixel based, and object based (Chen, Trinder, and Niu Citation2017; Guzzetti et al. Citation2012; Li, Shi, Myint, et al. Citation2016; Martha et al. Citation2012; Zhao et al. Citation2017). Visual interpretation was the earliest method used in remote sensing interpretation. It is a professional method for landslide extraction based on the characteristics of image tone, texture, shape, and position (Xu et al. Citation2009). The results of visual interpretation are generally more accurate, but the method requires staff with extensive knowledge and experience, hence requiring a lot of time and effort, which may fall in meeting the needs of emergency disaster relief decision-making (Liu et al. Citation2020; Wang et al. Citation2021). The pixel-based landslide detection method mainly adopts a change detection strategy. By observing land cover changes in different periods, landslides can usually be detected (Yang, Wang, and Shi Citation2013). However, this method only uses the spectral feature information of a single pixel, ignoring the correlation between adjacent pixels, which can cause the misclassification of pixels (Wandong et al. Citation2021; Yi and Zhang Citation2020). The object-oriented method can effectively use the spectral characteristics of the target object on the image to reduce errors in pixel classification information extraction (Blaschke, Feizizadeh, and Hölbling Citation2014). However, the object-oriented method is generally only used for specific research areas when setting thresholds; hence, its universality needs to be further improved (Keyport et al. Citation2018). With its strong feature extraction capability, deep learning can extract intrinsic features and deep features (Liu and Wu Citation2016; Sarkar and Mishra Citation2018; Tien Bui et al. Citation2020; Zhu et al. Citation2020). A fully convolutional network (FCN) (Long, Shelhamer, and Darrell Citation2015) is the first end-to-end fully convolutional network model for pixel-level prediction. Based on FCN, U-Net introduced concatenate operations through the skip connection structure to effectively fuse high- and low-dimensional features of images and greatly improve segmentation accuracy (He et al. Citation2021; Ronneberger, Fischer, and Brox Citation2015). The U-Net network model can handle the complex features of remote sensing images well and has strong feature- learning capability (Shamsolmoali et al. Citation2019).
U-Net was initially used for biomedical image segmentation; later, it was widely used in landslide extraction based on remote sensing images, and satisfactory results were achieved (Dong et al. Citation2022; Qi et al. Citation2020; Zhang et al. Citation2020). Soares, Dias, and Grohmann (Citation2020) used the U-Net model to realize the automatic extraction of landslides in the mountains of Rio de Janeiro, Brazil. However, when the U-Net model is directly used to extract small-scale landslides because of the insufficient RGB spectral information of remote sensing images, the landslide characteristics are not obvious, and the model has trouble learning characteristics. When there are objects in the image that are similar to the landslide spectrum, such as bare land, dry land, and so forth, the U-Net model will cause false and missed detection. Liu et al. (Citation2020) added the residual learning unit to U-Net and expanded the input data from three channels of RGB to six channels by adding a digital surface model (DSM), slope, and aspect, three parameters closely related to landslides; in doing this, they were able to achieve good results. However, less attention has been paid to the multiple feature channels formed after the U-Net skip connection. In addition, when extracting landslides, U-Net directly fuses the extracted shallow and deep features with features through the skip connection structure, and the semantic difference between them is large, which easily generates a semantic gap (He et al. Citation2021; Pang et al. Citation2019), thus causing interference with the deep features learned by the U-Net model. Meanwhile, multiple feature channels are formed after feature fusion, and the U-Net model lacks attention to the importance of feature channels, hence affecting the model performance and accuracy of the landslide extraction results. Therefore, how to distinguish the importance of feature channels, enhance learning for landslide features, effectively distinguish landslides from their easily confused features, and improve the accuracy of landslide extraction is a thorny problem faced by various landslide extraction methods (Bragagnolo et al. Citation2021).
In the present paper, the channel attention mechanism network model squeeze-and-excitation network (SENet) is added after the skip connection of U-Net (Hu, Shen, and Sun Citation2018) so that the improved U-Net model can adjust the weights of the feature channels, focus on the feature channels with a large contribution to feature classification, and process the fused feature channels more effectively, focusing on learning landslide features and, thus, solving the problem of different semantic gaps arising from a direct jump connection of U-Net to features of different dimensions. Meanwhile, combined with Sentinel-2A remote sensing data for landslide extraction, Sentinel-2A remote sensing data contain 13 spectral bands with rich spectral information, which is conducive to the model’s learning of landslide features, thus improving the accuracy of landslide extraction.
The objectives of the present paper are as follows: (1) to propose an attention U-Net landside extraction model combining SENet and U-Net to reduce the false and missed detection rate of landslide identification in remote sensing images and improve the accuracy of landslide extraction; (2) to use the U-Net and U-Net Backbone models for the same remote sensing image landslide extraction task and compare the extraction performance and results of the improved attention U-Net model; and (3), based on the Sentinel-2A satellite image, use the improved attention U-Net model to select landslide prone scenes (Lanzhou City) for large-scale landslide extraction.
2. Materials and methods
2.1. Experimental scene and data sources
Lanzhou City is located at 35°34′20″–37°07′07″ N, 102°35′58″–104°34′29″ E. It is situated in the northwest region of China and is one of the most important central cities in the western region (). The study area covers an area of about 2565 km2. The topography of Lanzhou is high in the west and south and low in the northeast, and the Yellow River flows from west to south to the northeast and crosses the entire territory. Climatically, Lanzhou is deeply inland and belongs to the temperate semiarid climate zone, with a dry climate, annual average temperature of 10.3°C, and annual average precipitation of 327 mm, mainly concentrated in June to September and, mostly in the form of heavy and torrential rainfall; this has been coupled with the increasing impact of human engineering activities on the geological environment. The increasing impact of human engineering activities on the geological environment in recent years has made landslide disasters in the territory frequent. The types of landslides in Lanzhou are mainly mixed, medium, and small loess landslides. The landslides mainly develop in loess and loess-like soils, which are difficult to distinguish from the surrounding features, while the landslide boundaries are difficult to define (Mei and Zhang Citation2010).
Figure 1. Experimental area.
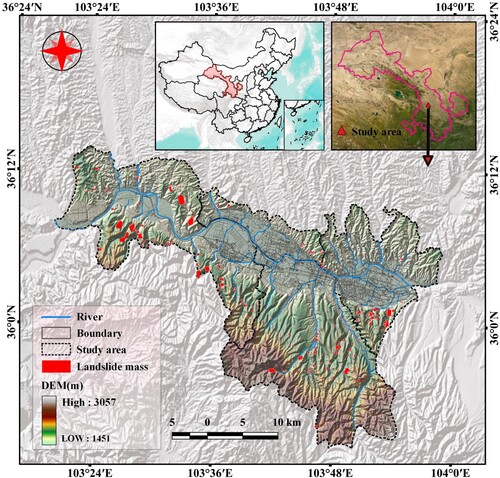
Sentinel-2A satellite remote sensing data obtained from the official website of the USGS (United States Geological Survey, http://www.usgs.gov) were used for landslide extraction. Sentinel-2A is a high-resolution multispectral imaging satellite that uses a multispectral imager (MSI) with an altitude of 786 km and width of 290 km, covering 13 spectral bands with rich waveform information. Sentinel-2A covers the visible, near-infrared, and mid-infrared bands and has a ground resolution of 10, 20, and 60 m at three levels. The specific sensor parameters are shown in . To avoid the influence of clouds on satellite imaging, the cloud coverage should be set to 0% when downloading images. According to the cloud coverage setting, the present study selected Lanzhou’s remote sensing image data obtained by the Sentinel-2A satellite in December 2021.
Table 1. Sentinel 2A satellite sensor parameters.
2.2. Methods
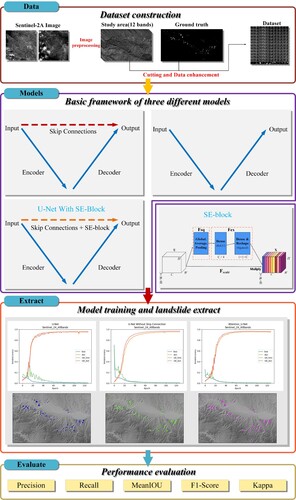
First, two Sentinel-2A images were selected to ensure the coverage of the entire study area, and the experimental dataset was constructed after preprocessing to generate experimental samples. Then, a channel attention U-Net model was constructed with TensorFlow as the base framework, and the model was trained using the experimental dataset to extract the landslides. Finally, the extraction results of the U-Net, U-Net Backbone, and improved attentional U-Net models were compared, the experimental results were evaluated using relevant evaluation metrics and the performance of the landslide extraction model was analyzed. The specific idea is shown in , and the following subsections provide detailed information about various aspects of the methods.
Figure 2. Landslide extraction flowchart.
2.2.1. Data processing and dataset
The acquired Sentinel-2A image data downloaded from the USGS were Level-1C (L1C) data, which were not atmospherically corrected. The L1C-level data needed to be preprocessed before it could be used for landslide extraction. To remove radiometric errors caused by atmospheric influences, the true surface reflectance of the feature was inverted. First, atmospheric correction of the L1C level data was required to obtain Level-2A (L2A) data. In the present paper, the L1C-level data were processed using Sen2cor, a plug-in released by European Space Agency (ESA) to produce L2A-level data, to obtain L2A-level data. Next, the L2A-level data were resampled at 10 m resolution using SNAP software and exported for subsequent processing and analysis. Finally, the resampled image data were imported into ENVI software for mosaic processing to ensure that it could contain the entire study area.
After the data preprocessing has been completed, the landslide dataset needed to be produced. The production process included the following three parts:
Sentinel-2A image data: The 12 preprocessed bands of Sentinel-2A images were loaded into ArcMap 10.5 for processing, and Sentinel-2A images of the study area were obtained. Because of the large size of the original satellite image, to make it compatible with the network input requirements, code was written in Python to crop the image using an overlapping cut strategy with a step size of 128; doing this dividied the original Sentinel-2A satellite image into several subimages of size 256 × 256 and normalized them, with each one containing one or more landslide events (a). In deep learning, the number of training samples is generally sufficient, but there is still a shortage of high-quality representative training samples. To increase the number of samples and noisy data to improve the generalization ability and robustness of the model, the present study employed some data enhancement strategies to generate more training samples. For the enhancement method, the cut image was mirrored and rotated (90° counterclockwise) to obtain 5,448 training samples of a size of 256 × 256.
Figure 3. Sample of the partial dataset (12 bands, ground truth). (a) Image of a band of Sentinel-2A in the study area (band 8, the yellow rectangle represents the position of the part of the subimages obtained after cutting, with the number corresponding to that in b), (b) Subimages obtained after cutting (12 bands, ground truth).
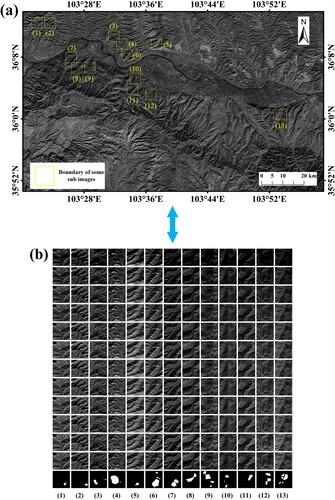
For the dataset, first, according to the historical landslide data, the landslides in the study area were vectorized and labeled on Google Earth through visual interpretation. Then, the labeled landslide vector data were imported into ArcMap 10.5 to convert these into raster data and export the data as a binary image to obtain ground truth, which was the label for deep learning model training. The foreground (white) represents the landslide area, and the background (black) represents the nonlandslide area. Then, the same cutting and data augmentation was performed for the ground truth as for the Sentinel-2A image. Finally, the 5,448 training samples and the ground truth obtained above were randomly divided according to the ratio of the training set: validation set: test set as 6:2:2. After the division was finished, the training set contained 3,270 samples, the validation set contained 1,089 samples, and the test set contained 1,089 samples. The training set, validation set, and test set were mutually exclusive (b). The training set was used to train the model, the validation set was used to select the optimal model parameters, and the test set was used to quantitatively evaluate the performance of the model.
2.2.2. U-Net network
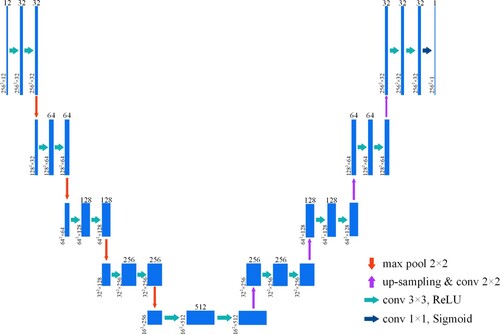
The U-Net is a two-dimensional image semantic segmentation network based on a FCN (Ronneberger, Fischer, and Brox Citation2015). One critical idea of U-Net is the skip connection structure, which can fuse low-dimensional and high-dimensional features and significantly improve segmentation accuracy. At the same time, U-Net can accurately segment images based on few training data and has a fast training speed, making the network widely used in remote sensing image segmentation. The U-Net architecture consists of a systolic path (encoder), extended path (decoder), and skip connection structure, forming a U-shaped structure, which is a typical encoder-decoder structure (Chang et al. Citation2021; Liu et al. Citation2019).
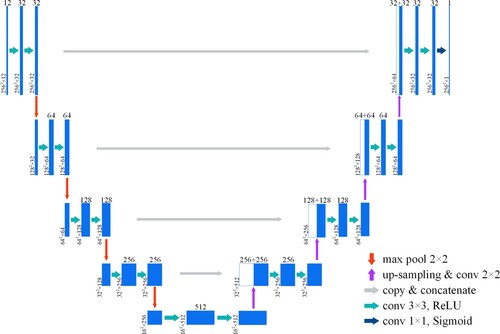
The encoder was used to extract features from the image and reduce spatial dimensionality. The encoder was similar to the standard CNN architecture and contained convolutional layers and downsampling layers. The convolutional layer was used to extract image features, and the downsampling layer was used to filter unimportant high-frequency information and perform feature dimensionality reduction. Repeated convolution and pooling operations can fully extract the higher-level features of an image. The role of the decoder is to upsample the feature maps extracted by the encoder to match the size of the input image, thus performing pixel-level semantic prediction of the input image. The decoder contained convolutional layers, upsampling layers, and dimensional splicing operations (concatenate). In the decoding process, the number of channels of the feature map was halved at each upsampling; then, the feature maps of the corresponding scales in the encoding and decoding parts were fused by a dimensional splicing operation (concatenate). Dimensional splicing (concatenate) splices the channel dimensions of the feature map together to form thicker features. This operation can retain higher-resolution, more detailed information to improve the resolution and edge accuracy of the final segmentation results. In the present study, U-Net was used as the basic network of the landslide boundary information extraction model. The number of U-Net channels started from 32 and rose to 512 after four downsampling iterations. The structure is shown in .
Figure 4. U-Net network structure.
The skip connection structure of U-Net can improve segmentation accuracy by combining shallow, low-level mappings from the encoder with deep, high-level features from the decoder. However, some studies have pointed out that segmentation is not effective when the segmentation target is very small and that the skip connection structure directly combines shallow and deep features, which tends to generate a semantic gap (semantic gap) (He et al. Citation2021). Although the skip connection is a natural design, the feature mappings at the same scale for encoder and decoder networks are semantically different, and they cannot be guaranteed to be the best match of feature fusion (Abdollahi and Pradhan Citation2021). Therefore, in the current study, a U-Net (U-Net Backbone) network model with the skip connection structure removed (Wang et al. Citation2022; Xiao, Yang, and Sadovnik Citation2021) (structure shown in ) was used for landslide extraction, and the model was compared with U-Net and the improved attentional U-Net.
Figure 5. U-Net Backbone network structure.
2.2.3. Channel attention mechanism U-Net network
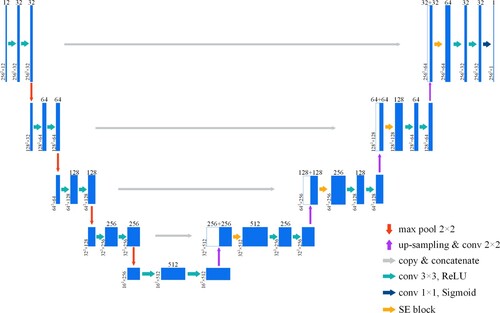
The attention mechanism (AM) is derived from the study of human vision: human vision obtains the targeted focus by quickly scanning the global image, that is, the focus of attention; then, they eye invests more attention resources in this area to obtain more detailed information about the target that needs to be focused on while suppressing other irrelevant information (Quader et al. Citation2020). Starting in 2014, AM was first applied in the field of machine translation and then widely used in the field of computer vision (Niu, Zhong, and Yu Citation2021; Oktay et al. Citation2018). AMs applied to the field of computer vision have been generally classified into the spatial domain attention, channel domain attention, and mixed domain attention. The core of the AM is to let the network focus on what it needs to pay more attention to. The AM is generally embodied in the form of weights, allocating limited information processing resources to the important parts, thus achieving the effect of improving the performance of deep learning models (Guo et al. Citation2022; Yang Citation2020). In the current study, only the landslide features were extracted. One of the difficulties in landslide research is that other features such as vegetation, bare ground, dry land, and so forth are treated as backgrounds, and the background parts that occupy most of the image area are regarded as irrelevant information. Some backgrounds have high spectral similarity with landslides, and the complex background information affects the accuracy of landslide extraction. Considering that U-Net forms more ‘thick’ features after the concatenate operation of the channel dimension in the skip connection part, the number of channels increases to avoid the semantic gap and redundant information that may arise after the concatenate operation to affect the feature-learning ability of the model. Therefore, the present study incorporated SENet, a channel attention mechanism, after each skip connection of the U-Net network to estimate the contribution of different feature channels to landslide classification and enhance or suppress different channels according to their contribution. The squeeze-and-excitation block (SE-block) is the core of SENet, and its structure is shown in . The modified attention U-Net network structure is shown in .
Figure 6. Squeeze-and-Excitation block (SE-block).
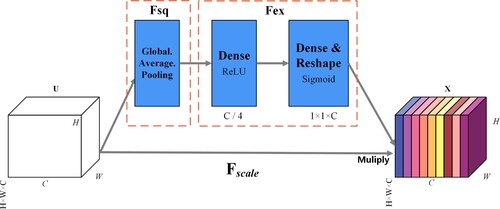
Figure 7. Improved attention U-Net network structure.
SENet aims to model the correlation between different channels and automatically obtain the importance of each feature channel through network learning before then assigning different weight coefficients to each channel to reinforce the important features and suppress the nonimportant ones. The implementation of SENet can be abstracted into three steps, as follows:
Squeeze operation: The first is the squeeze operation, which follows the spatial dimensionality of the feature map U by global averaging pooling (formula 1) to perform feature compression on it; this turns each two-dimensional feature channel into a one-dimensional real number , which has a global perceptual field and whose output dimensionality is the same as that of the input feature channel:
(1)
(1) where
is a certain feature map, H and W are the height and width of the feature map, C is the number of channels, and
is a scalar value reflecting the global features of the feature map.
Excitation operation: This operation is used to fully capture the dependence between channels and to learn the nonlinear relationship between channels. It is a mechanism similar to the gate in a recurrent neural network. The weight is generated for each feature channel by parameter W. The excitation operation is mainly composed of two fully connected layers and two activation functions. The first fully connected layer uses ReLU as the activation function, and the second fully connected layer uses Sigmoid as the activation function. The expression formula is shown in formula 2:
(2)
(2) where
,
, σ is the Sigmoid activation function, and δ is the ReLU activation function. Two fully connected layers with parameters W1 and W2 are used to enhance the generalization capability of the network.
Reweight operation: The weights obtained from the output of the excitation operation are weighted to the previous features by multiplication on a channel-by-channel basis to complete the rescaling of the original features in the channel dimension (formula 3); this enables the model to automatically learn the importance of each channel, thus enhancing the learning and recognition of the image features:
(3)
(3) where
,
and
represent the channel product between the scalar
and feature map
.
2.2.4. Training model
The training of the deep learning model is based on high computational power (Qi et al. Citation2020). U-Net stitches together the feature maps in the channel dimension to form thicker features. At the same time, the intermediate variables in the network and large number of intermediate parameters generated when using the optimization algorithm cause U-Net to consume a large amount of video memory during the training process, hence requiring high hardware requirements. The hardware configuration of this experiment is shown in , and the software configuration is shown in .
Table 2. Basic system platform configuration.
Table 3. The core software configuration.
There are numerous parameters to be set and adjusted in the process of model training, and batch size is one of the more important parameters. Batch size is often set between a few dozen and few hundred but generally not more than 1000. In this experiment, considering the memory limitation of the graphics card, the batch size was set to 64.
After several pre-experiment tests and considering the hardware limitations, the computational efficiency of the model, and the accuracy of the results, the number of iterations (epoch) during the experiment was set to 128 times, the learning rate to 0.00001, and the optimizer as the Adaptive moment estimation (Adam) (Kingma and Ba Citation2014). Adam is simple to implement and is very suitable for a wide range of nonconvex optimization problems in the field of machine learning (Xiao, Yang, and Sadovnik Citation2021). In the present paper, we study the image semantic segmentation problem, which is a binary classification of image pixels, and binary cross- entropy (BCE) has been chosen as the loss function. The BCE was applied to the binary classification task and can be defined as follows:
(4)
(4) Among them, N represents the number of classification categories, y is a binary label 0 or 1, and p(y) is the probability that the output belongs to the y label.
In the experiments, all models were trained from the initial stage without involving any pretrained models. The area under the ROC curve (area under curve, AUC) was selected to monitor the training process of the models during model training, and the U-Net, U-Net Backbone, and modified attentional U-Net were trained under the same experimental settings.
2.2.5. Evaluation index
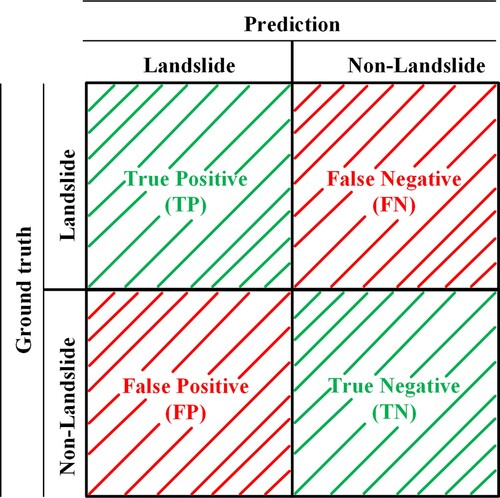
To make a comprehensive quantitative evaluation of the performance of the trained model for landslide extraction, six commonly used quantitative evaluation indexes were used: Kappa coefficient (Kappa), AUC, mean intersection over union (MIoU), precision (P), recall (R), and F1-score (F1). The classification task involved was a binary classification task and the confusion matrix shown in , where TP (true positive) indicates that the model correctly predicted the landslide target, FN (false negative) indicates that the landslide target was incorrectly predicted as a non-landslide, FP (false positive) indicates that the non-landslide target was incorrectly predicted as a landslide, and TN (true negative) indicates that the model correctly predicted the non-landslide target. However, these four indicators are relatively basic and do not clearly reflect the comprehensive performance of the model. Precision and recall were calculated based on these four basic indicators (Gao et al. Citation2021).
Figure 8. Confusion matrix diagram.
The Kappa coefficient is a measure of consistency, which for classification problems is the agreement between the model prediction and actual classification result. The Kappa coefficient can be calculated based on the confusion matrix and takes values between −1 and 1, usually greater than 0. The formula for calculating the Kappa coefficient is as follows:
(5)
(5) where n is the total number of columns of the confusion matrix (total number of categories);
is the number of samples in row i and column i of the confusion matrix, that is, the number of correctly classified samples;
and
are the total numbers of samples in row i and column i, respectively; and N is the total number of samples used for accuracy evaluation.
The AUC is defined as the area under the ROC curve and is a performance metric measuring the merits of a learner. Simply put, the larger the AUC value, the higher the correct rate of the classifier. The calculation formula is as follows:
(6)
(6) where
denotes the serial number of the i-th sample, the probability score is ranked from small to large, and M and N are the number of positive and negative samples, respectively.
denotes the rank sequence number of positive samples only.
MIoU is a standard evaluation index of the semantic segmentation network; it is the ratio of the intersection and union between the prediction results of each category and real labels and is the result of summation and re-average. The calculation formula is as follows:
(7)
(7) Precision measures the ratio of correct targets to those judged to be correct, that is, the percentage of correctly predicted (the true label is positive) samples among all samples for which the model predicts a positive case; this is calculated as follows:
(8)
(8)
Recall measures the proportion of the correct target judged as the correct target in the correct target; that is, the percentage of all samples with positive labels is predicted. The calculation formula is as follows:
(9)
(9) The F1-score (F1) is the harmonic mean of precision and recall, which is a more balanced indicator. Considering both the precision and recall, this can better reflect the comprehensive performance of the model. The larger the F1, the better the performance of the model. The calculation formula is as follows:
(10)
(10)
3. Results and analysis
3.1. Landslide extraction model performance analysis
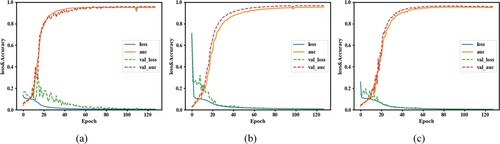
The same experimental parameters were set. Three networks based on U-Net, U-Net Backbone, and improved attention U-Net were trained for the landslide extraction model, respectively. The loss function curves and evaluation index curves of the training and validation sets are shown in . As can be seen from , the loss function and evaluation index curves of the three models – U-Net, U-Net Backbone, and improved attention U-Net – were relatively stable on both the training and validation sets, indicating that the training process parameters were reasonably set. The AUC values of the three models of U-Net, U-Net Backbone, and improved attention U-Net on both the training and validation sets reached above 90%, indicating that all three models performed well on the dataset. In the specific process, 128 epochs were set during training process of this experiment. In the initial stage of training, the AUC values of the three models of U-Net, U-Net Backbone, and improved attention U-Net were relatively low, showing a rapid increase between the 10th and 30th epochs, but the AUC value and loss value of the U-Net model tended to be stable after about the 55th epoch (a) before gradually converging. The AUC and loss values of the U-Net Backbone (b) model tended to be stable and gradually converged after about 70 epochs. The AUC value and loss value of the attention U-Net model (c) tended to be stable and gradually converge after about 60 epochs. Compared with both the U-Net and the improved attentional U-Net models, the convergence speed of the U-Net Backbone model was relatively slow, probably because of the relatively weak learning ability of this model for landslide features, which led to a longer convergence time. It can also be found from the training curves that both the U-Net and U-Net Backbone models had larger loss values compared with the improved attentional U-Net model. In addition, the U-Net and U-Net Backbone models fluctuated more during the initial phase of training, while the improved attentional U-Net model was relatively stable. The performance of the attention U-Net model proposed in the current paper was better compared with the U-Net and U-Net Backbone models. The attention U-Net model also showed good performance in landslide extraction.
Figure 9. Training process curves of the three models. (a) U-Net, (b) U-Net Backbone, (c) Attention U-Net.
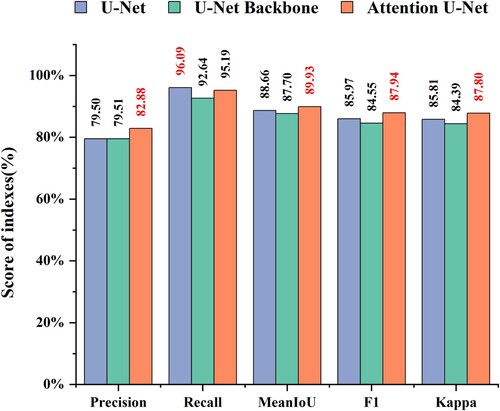
To further evaluate model performance, the present study used the confusion matrix to calculate five evaluation metrics – precision, recall, MeanIoU, F1, and Kappa to quantitatively evaluate the prediction results of the three models. The evaluation metrics were calculated as shown in . shows that the attention U-Net model outperformed the U-Net model and the U-Net Backbone model in the four comprehensive evaluation metrics of precision, F1, Kappa, and MeanIoU. Still, the recall value of the proposed attention U-Net model (95.19%) was slightly lower than that of the U-Net model (96.09%). Recall is used to evaluate the detection coverage of the detector for all targets to be detected. From the analysis above, the U-Net model had a high false detection rate for small landslides. The experimental scenario in the present paper had smaller landslides, so it is highly likely that the U-Net model identified other objects as landslides, which eventually led to its high recall value. Deep learning evaluation metrics need to synthesize multiple metrics to better reveal the performance of the model. In the present study, the proposed attention U-Net model had better balance and comprehensive performance by quantifying five metrics in general. Therefore, the proposed attention U-Net model had high performance and was an excellent model for landslide extraction.
Figure 10. Evaluation index of landslide extraction results of different models.
3.2. Landslide extraction results
3.2.1. Analysis of fine landslide extraction results
In the present study, U-Net, U-Net Backbone, and the proposed channel attention mechanism U-Net were used to extract the landslide boundary of the main urban area of Lanzhou City. The fine extraction results for typical areas are shown in . The first column in shows the synthetic images of the Sentinel-2A satellite in 2, 3, and, 4 bands, the second column shows the ground truth, the third column shows the extraction results of the U-Net model, the fourth column shows the extraction results of the U-Net Backbone model, and the fifth column shows the extraction results of the improved attentional U-Net model. The visual interpretation in reveals that all three models – U-Net, U-Net Backbone, and the proposed attentional U-Net – could extract the boundary information of the landslide in the selected experimental scenario.
Figure 11. Extraction results of the three models on the test set. (a) Sentinel-2A images, (b) Ground truth, (c) U-Net, (d) U-Net Backbone, (e) Attention U-Net. The red circles represent the landslides extracted by different methods, showing large differences compared with the ground truth.
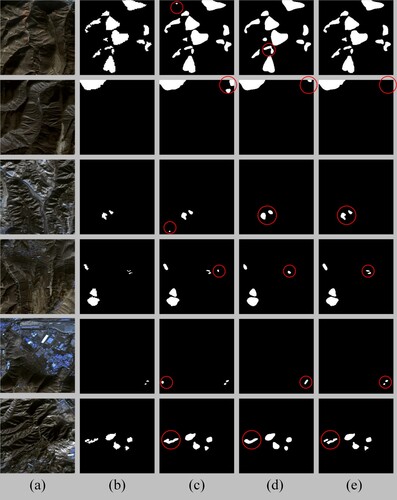
By selecting several typical regions with fine landslide results for the analysis, we found that the U-Net model extracted landslide boundaries more finely. The main reason may be that the U-Net model added the skip connection structure, fused the low-level features and high-level features of the landslide in the image during the landslide extraction process, and supplemented the semantic information of the landslide in the decoding stage; hence, the U-Net model was more refined in landslide boundary segmentation compared with the U-Net Backbone. However, compared with the real values, the U-Net model had a misdetection phenomenon in the extraction of landslide results (c, rows 1–5, red circles), probably because of the lack of attention to the multiple feature channels formed after the fusion of the skip connections during the training of the U-Net model, which affected the model performance and tended to identify small non-landslide targets with small differences from landslide spectral features as landslides when extracting landslides, this caused the phenomenon of landslide false detection, which affected the accuracy of landslide extraction, showing that the U-Net model was still lacking in landslide feature extraction and learning.
Compared with the U-Net model, the U-Net Backbone model extracted rougher landslide boundaries and blurred the landslide boundaries, especially for some fine landslides. The adhesion problem occurred; that is, the model directly ignored the landslide boundaries and surrounding features while identifying adjacent landslides as the same one (d, rows 1, 4, 5, and 6, red circles), resulting in misdetection; hence the overall segmentation results and edge details were not fine enough.
Compared with the U-Net and U-Net Backbone models, the channel attention mechanism U-Net model proposed in the present study extracted results closer to the ground truth (b) in each typical scenario selected (a), and all of them could extract fine landslide boundary information (e). In addition, the analysis revealed that the proposed model extracted the lowest false detection rate of landslides and was especially able to extract small and slender landslides as well (e, rows 2–6, red circles). Because the improved U-Net model had the skip connection structure for fusing low-level and high-level features and an attention module – SE-block for processing the fused feature channels – it could suppress noise, emphasize important channels, focus on learning landslide features, and better distinguish landslide and non-landslide features in images, in turn improving model robustness, enabling finer prediction of landslide contour information, and reducing the false detection rate of landslides in complex geographic environments.
To further quantify the proposed model for the landslide extraction boundary accuracy problem in detail, the current study used probability mapping plots to analyze and generate probability mapping plots for the three models for landslide extraction (). The probability mapping plot was the raw probability (from 0 to 1) of all pixels in the input image classified as landslides. The color bar on the right was a scale measuring the raw probability. Blue indicates low probability and red indicates high probability. The first column is ground truth, where all pixels are labeled as feature pixels (slippery slope) or background pixels (nonslippery slope). The second and fourth columns show the probability mapping plots of the U-Net model, the U-Net Backbone model, and the improved attentional U-Net model for landslide segmentation, respectively.
Figure 12. Probability mapping of three models when extracting landslides. (a) Ground truth, (b) U-Net, (c) U-Net Backbone, (d) Attention U-Net.
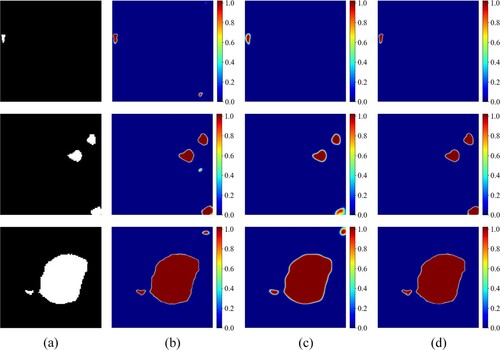
As can be seen, the probability mapping plots of the three models of U-Net, U-Net Backbone, and the attention U-Net for extracting landslides compared with ground truth (a), the proposed channel attention mechanism U-Net model worked the best for classifying pixels in the test images, especially for small landslide identification with finer and more accurate boundaries. Compared with the improved channel attention mechanism U-Net model, the U-Net model showed more misclassification of landslide pixels for small landslides (b); that is, some non-landslide pixels had a higher probability of being identified as landslide pixels, indicating insufficient learning ability for landslide features and weaker model performance. In , the color change representing low probability and high probability was mainly transited at the edge of the landslide. The U-Net Backbone showed greater uncertainty at the edge of the landslide. The color change area at the edge of the landslide in the probability mapping plots was larger than that at the edge of the landslide (the area between blue and red) in the probability mapping plots of the improved attention U-Net (c); that is, the probability that the pixel at the edge of the landslide was determined to be a landslide was lower than that of the improved attention U-Net (d). At the same time, the third row of c also showed a misclassification of non-landslide pixels. This also indicated that the U-Net Backbone model was not sufficiently refined in the extraction of landslide boundaries, especially for small landslides. In summary, through the quantitative analysis of the probability mapping plots, the attention U-Net model proposed in the current paper was able to take into account the characteristics of the landslide and extract fine landslide boundary information, especially for small landslides.
3.2.2. Analysis of landslide extraction results on a large scale
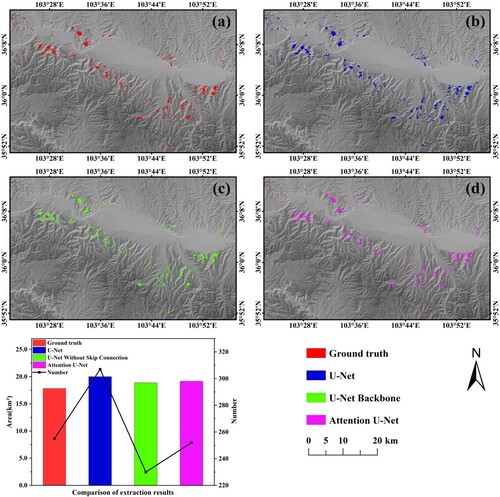
The types of landslides in Lanzhou City are mainly mixed, medium, and small loess landslides and are mainly composed of loess and secondary loess of various genesis; in addition, their spectral and textural characteristics have a high similarity to the surrounding environment, which brings difficulties in extracting landslides. In the present study, based on Sentinel-2A images, three models – trained U-Net, U-Net Backbone, and improved channel attention U-Net – were used to extract landslides in the main urban area of Lanzhou City. The models were then used to verify the overall performance of the model proposed. The extraction results are shown in . From , it can be seen that the improved channel attention U-Net model performed the best and could extract landslide boundary information accurately, especially for small landslides. The extraction result was the closest to the ground truth. Through quantitative statistical calculations, the ground truth had a total of 255 landslides with a total area of 17.83 km2; the U-Net model extracted 307 landslides with a total area of 20.00 km2; the U-Net Backbone model extracted 230 landslides with a total area of 18.88 km2; the improved channel attention U-Net model extracted 252 landslides with a total area of 19.16 km2. Here, the U-Net model extracted the largest number of landslides and the largest total area of landslides. The U-Net Backbone model extracted the fewest landslides and had the smallest landslide area. The number of landslides extracted by the attention U-Net model proposed in the present paper was close to the ground truth. Based on the above analysis, it can be seen that compared with U-Net and improved attention U-Net models, U-Net Backbone had a weaker learning ability for landslide features, thus ignoring some landslides and having a higher missed detection rate. The U-Net model had a higher false detection rate for small landslides, and the improved attention U-Net model had the best landslide extraction results. Combining the visual effect, the improved attention U-Net model had the best extraction effect on landslides among the three models and was the closest to the ground truth. In general, by incorporating SENet, a channel attention mechanism, the improved attention U-Net model could assign different weights to the feature channels generated after fusing low-dimensional features and high-dimensional features of images through the skip connection structure, focusing on the channels with large contributions to landslide feature classification; this helped to effectively improve the recognition of the differences between landslide and non-landslide spectral features and enhance the performance of the network in extracting landslide features, thus improving the accuracy of landslide extraction and reducing the leakage and false detection rates of large-scale landslide extraction.
Figure 13. Landslide extraction results of the three models in the experimental area.
4. Discussion
4.1. Comparison of models
Accurate and rapid landslide identification is crucial for disaster monitoring and emergency rescue work. Therefore, the learning efficiency of deep learning models is critical. For a deep learning model, the complexity of the model has a large impact on the extraction time of landslides. In the present study, four metrics were selected to measure the complexity of the model: the number of model parameters, model size, training time per step, and testing time of the test set () (Yi and Zhang Citation2020).
Table 4. Comparisons of model complexity.
Based on the analysis of the four evaluation indexes of the complexity of the evaluation model, the model complexity of the U-Net network proposed in the current paper was slightly higher than that of the U-Net and U-Net Backbone networks, but there was no significant difference. The attention U-Net model proposed in the present paper used a feature recalibration strategy to obtain the importance of each channel, introduced fewer parameters, and required fewer computing resources (Goel et al. Citation2020; Niu, Zhong, and Yu Citation2021). At the same time, because the improved attention U-Net model incorporated the SENet module, which aided in emphasizing the important channel while suppressing noise (Suzuki and Yamane Citation2020), improving the accuracy of landslide feature information processing, and improving model performance, its landslide extraction result accuracy was better than that of the U-Net and U-Net Backbone models; this led to a reduction in the false detection rate and missed detection rate. Considering model complexity and landslide extraction result accuracy, the complexity of the proposed attention U-Net model was found to be acceptable and can meet the demand for accurate and fast landslide detection for disaster monitoring and emergency response.
4.2. Comparison with previous work
Currently, some scholars have used deep learning methods for landslide identification and extraction, achieving good results (Ghorbanzadeh et al. Citation2019; Lei et al. Citation2019). Bragagnolo et al. (Citation2021) identified and semantically segmented landslide scars in a region of Nepal based on the U-Net model and Landsat satellite images, which proved the feasibility of the U-Net method. However, in the face of a wide range of complex scenarios, the U-Net model still has some shortcomings. Scholars began to improve the U-Net model to extract landslides, obtaining better extraction results. Liu et al. (Citation2020) embedded residual learning units in U-Net and added terrain data to extract landslides, obtaining better results than the original U-Net model. In addition, some scholars have used multisource data to extract landslides. Chen et al. (Citation2022) extracted potential active landslides in the Three Rivers Region of the Qinghai–Tibet Plateau based on improved U-Net (DRs-UNet) combined with InSAR deformation phase images.
Compared with existing studies, the method proposed in the current paper mainly took into account the fact that Sentinel-2A image data in multiple bands will form multiple feature channels after being input into the model. The model performance was improved by focusing on the features that significantly contributed to feature classification. In contrast, the lack of focus on the importance of feature channels in existing studies has led to a high rate of missed and false detection. Therefore, in comparison, the method proposed in the present study can identify landslides quickly and accurately and is an excellent algorithm.
4.3. Application of the model in other scenarios
To further verify the generalizability of the model, 12 bands of Sentinel-2A images from a typical area with extensive landslide distribution in the Bailong River basin were selected for validation. The typical area was about 720 km2, from 104°26′19.06″E to 104°47′37.27″E and from 32°53′13.19″N to 33°4′57.70″N. The number of landslides in the validation area was large, and the landslide samples were based on Google Earth images obtained by visual interpretation to identify 123 landslides. Because the geographic environment of the Bailong River basin was similar to that of Lanzhou City, the model obtained from the training of the Lanzhou City landslide dataset was used as the initial weight, and some of the mutually exclusive landslide samples were selected for fine-tuning the model parameters in the surrounding areas outside the validation area. The landslides in the validation area were extracted using the proposed attention U-Net model; and the extraction results are shown in .
Figure 14. Application of the model in other scenarios.
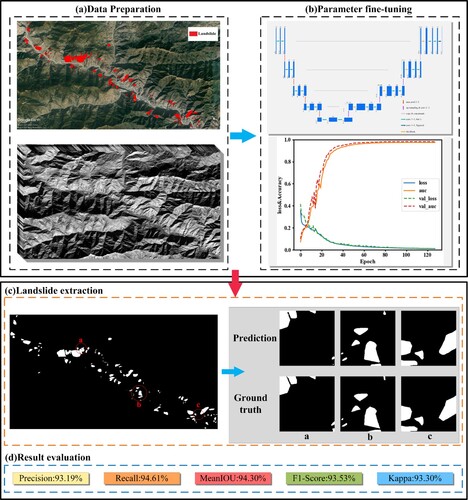
The results show that the proposed attention U-Net method achieved most of the landslide boundary extraction in the validation area. The metrics of landslide extraction results were as follows: F1 93.53%, precision 93.19%, recall 94.61%, MeanIoU 94.30%, and Kappa 93.30%. Hence, the proposed method had a low false detection rate and good evaluation index for landslide extraction, and the visual effect was closer to the ground truth, proving the universality and robustness of the proposed method for landslide extraction.
4.4. Limitations and prospects
The attention U-Net model proposed in the present study is simple in structure and easy to deploy. The model can focus more on the feature channels that contribute to the classification of landslide features while fusing together deep and shallow features to improve the performance of the model and the accuracy of landslide extraction. It can be easily embedded into other classification or detection models to improve the performance of the model and can quickly and accurately extract landslides, reducing the false detection rate and missed detection rate. However, it will overextract the surrounding non-landslide features, resulting in problems such as the overdetection of landslides (). The main reasons for this are summarized into the following three points:
First, the deep learning model requires a large amount of training data (Yi et al. Citation2019). The current paper used a data enhancement method to expand training data, but the data enhancement strategy was insufficient from a spatial perspective (mirroring, rotation) to enhance the data. The representativeness of training samples was not enough to cover all kinds of landslides, making it difficult for the proposed model to fully cope with some complex and rare landslides.
Second, landslides are natural disasters occurring under the action of gravity, so the occurrence of landslides is closely related to topographic factors. The use of optical images alone cannot effectively distinguish landslides from features with characteristics similar to landslides (bare ground, special artificial buildings, etc.); hence, the present study did not include topographic data other than remotely sensed images in the data, leading to a false detection rate in complex environments.
Third, landslides have different spatial scales, and their areas range from a few square meters to several square kilometers(Ghorbanzadeh et al. Citation2019; Lei et al. Citation2019). In the present study, we used Sentinel-2A images with limited spatial resolution, so very small-scale landslides were not clear enough in visual features, making the model ignore some of the detailed information on landslides during training and leading to an increased rate of missed detection.
In future work, we will have different kinds of landslides in multiple scenes to expand the samples and prepare richer data for the model’s learning of landslide features. At the same time, we can consider training new samples from different regions and types through transfer learning (Zhang, Zhang, and Du Citation2016). We will consider inputting DEM and slope data together with optical images into the model for model training and landslide extraction (Liu et al. Citation2020). At the same time, we will consider using more high spatial resolution remote sensing images for landslide extraction.
5. Conclusion
In the present study, an attentional U-Net landslide extraction model combining SENet and U-Net was proposed, and landslides were extracted using 12 bands of Sentinel-2A images. We introduced the channel attention mechanism network SENet after the skip connection part of the U-Net network, which was used to adjust the weights of different feature channels; this allowed model to focus on the feature channels that contribute more to landslide classification, focus on learning landslide features, better distinguish the spectral differences between landslides and non-landslides, and enhance the performance of the network in extracting landslide features. The present study used the same test set to perform landslide extraction experiments on the three models of U-Net, U-Net Backbone, and the proposed attention U-Net. The results showed that, compared with the U-Net and U-Net Backbone models, the proposed attention U-Net model achieved better performance by assigning different weights to different feature channels. The landslide extraction accuracy was higher, the false detection rate and missed detection rate were lower, and the landslide edge extraction was more refined. The quantitative evaluation results showed that the evaluation indexes of the proposed method were generally high, including an F1 value of 87.94%, which was about 2% and 3% higher than the U-Net and U-Net Backbone models, respectively, verifying the effectiveness of the method. In addition, the proposed model showed robustness and universality when applied to other scenarios, which again indicates that the proposed model is reliable and can meet the demand for the rapid acquisition of landslide disaster information.
Data availability statement (DAS)
The data that support the findings of this study are available from the corresponding author upon reasonable request.
Disclosure statement
No potential conflict of interest was reported by the author(s).
Additional information
Funding
References
- Abdollahi, Abolfazl, and Biswajeet Pradhan. 2021. “Integrating Semantic Edges and Segmentation Information for Building Extraction from Aerial Images Using UNet.” Machine Learning with Applications 6: 100194. doi:10.1016/j.mlwa.2021.100194.
- Blaschke, T., B. Feizizadeh, and D. Hölbling. 2014. “Object-Based Image Analysis and Digital Terrain Analysis for Locating Landslides in the Urmia Lake Basin, Iran.” IEEE Journal of Selected Topics in Applied Earth Observations and Remote Sensing 7 (12): 4806–4817. doi:10.1109/JSTARS.2014.2350036.
- Bragagnolo, L., L. R. Rezende, R. V. da Silva, and J. M. V. Grzybowski. 2021. “Convolutional Neural Networks Applied to Semantic Segmentation of Landslide Scars.” CATENA 201: 105189. doi:10.1016/j.catena.2021.105189.
- Chang, Hui, Rao Zhiqiang, Yulin Zhao, and Yichen Li. 2021. “Research on Tunnel Crack Segmentation Algorithm Based on Improved U-Net Network.” Computer Engineering and Applications Journal 57 (22): 215–222. doi:10.3778/j.issn.1002-8331.2007-0223.
- Chen, Tao, John C. Trinder, and Ruiqing Niu. 2017. “Object-Oriented Landslide Mapping Using ZY-3 Satellite Imagery, Random Forest and Mathematical Morphology, for the Three-Gorges Reservoir, China.” Remote Sensing 9 (4): 333. doi:10.3390/rs9040333
- Chen, Ximing, Xin Yao, Zhenkai Zhou, Yang Liu, Chuangchuang Yao, and Kaiyu Ren. 2022. “DRs-UNet: A Deep Semantic Segmentation Network for the Recognition of Active Landslides from InSAR Imagery in the Three Rivers Region of the Qinghai–Tibet Plateau.” Remote Sensing 14 (8): 1848. doi:10.3390/rs14081848
- Cheng, Libo, Jia Li, Ping Duan, and Mingguo Wang. 2021. “A Small Attentional YOLO Model for Landslide Detection from Satellite Remote Sensing Images.” Landslides 18 (8): 2751–2765. doi:10.1007/s10346-021-01694-6.
- Dong, Zhangyu, Sen An, Jin Zhang, Jinqiu Yu, Jinhui Li, and Daoli Xu. 2022. “L-Unet: A Landslide Extraction Model Using Multi-Scale Feature Fusion and Attention Mechanism.” Remote Sensing 14 (11): 2552. doi:10.3390/rs14112552
- Gao, Jinfeng, Yu Chen, Yongming Wei, and Jiannan Li. 2021. “Detection of Specific Building in Remote Sensing Images Using a Novel YOLO-S-CIOU Model. Case: Gas Station Identification.” Sensors 21 (4): 1375. doi:10.3390/s21041375
- Ghorbanzadeh, Omid, Thomas Blaschke, Khalil Gholamnia, Sansar Raj Meena, Dirk Tiede, and Jagannath Aryal. 2019. “Evaluation of Different Machine Learning Methods and Deep-Learning Convolutional Neural Networks for Landslide Detection.” Remote Sensing 11 (2): 196. doi:10.3390/rs11020196
- Ghorbanzadeh, Omid, Khalil Gholamnia, and Pedram Ghamisi. 2022. “The Application of ResU-net and OBIA for Landslide Detection from Multi-Temporal Sentinel-2 Images.” Big Earth Data, 1–26. doi:10.1080/20964471.2022.2031544.
- Goel, A., C. Tung, Y. H. Lu, and G. K. Thiruvathukal. 2020. “A Survey of Methods for Low-Power Deep Learning and Computer Vision.” Paper presented at the 2020 IEEE 6th World Forum on Internet of Things (WF-IoT), June 2–16.
- Guo, Meng-Hao, Tian-Xing Xu, Jiang-Jiang Liu, Zheng-Ning Liu, Peng-Tao Jiang, Tai-Jiang Mu, Song-Hai Zhang, Ralph R. Martin, Ming-Ming Cheng, and Shi-Min Hu. 2022. “Attention Mechanisms in Computer Vision: A Survey.” Computational Visual Media 8 (3): 331–368. doi:10.1007/s41095-022-0271-y.
- Guzzetti, Fausto, Alessandro Cesare Mondini, Mauro Cardinali, Federica Fiorucci, Michele Santangelo, and Kang-Tsung Chang. 2012. “Landslide Inventory Maps: New Tools for an Old Problem.” Earth-Science Reviews 112 (1): 42–66. doi:10.1016/j.earscirev.2012.02.001.
- He, Y., S. Yao, W. Yang, H. Yan, L. Zhang, Z. Wen, Y. Zhang, and T. Liu. 2021. “An Extraction Method for Glacial Lakes Based on Landsat-8 Imagery Using an Improved U-Net Network.” IEEE Journal of Selected Topics in Applied Earth Observations and Remote Sensing 14: 6544–6558. doi:10.1109/JSTARS.2021.3085397.
- Hu, Jie, Li Shen, and Gang Sun. 2018. “Squeeze-and-Excitation Networks.” Paper presented at the Proceedings of the IEEE Conference on Computer Vision and Pattern Recognition.
- Keyport, Ren N., Thomas Oommen, Tapas R. Martha, K. S. Sajinkumar, and John S. Gierke. 2018. “A Comparative Analysis of Pixel- and Object-Based Detection of Landslides from Very High-Resolution Images.” International Journal of Applied Earth Observation and Geoinformation 64: 1–11. doi:10.1016/j.jag.2017.08.015.
- Kingma, Diederik P, and Jimmy Ba. 2014. “Adam: A Method for Stochastic Optimization.” arXiv preprint arXiv:1412.6980.
- Lei, T., Y. Zhang, Z. Lv, S. Li, S. Liu, and A. K. Nandi. 2019. “Landslide Inventory Mapping from Bitemporal Images Using Deep Convolutional Neural Networks.” IEEE Geoscience and Remote Sensing Letters 16 (6): 982–986. doi:10.1109/LGRS.2018.2889307.
- Li, Huajin, Yusen He, Qiang Xu, Jiahao Deng, Weile Li, and Yong Wei. 2022. “Detection and Segmentation of Loess Landslides via Satellite Images: A Two-Phase Framework.” Landslides 19 (3): 673–686. doi:10.1007/s10346-021-01789-0.
- Li, Zhongbin, Wenzhong Shi, Ping Lu, Lin Yan, Qunming Wang, and Zelang Miao. 2016. “Landslide Mapping from Aerial Photographs Using Change Detection-Based Markov Random Field.” Remote Sensing of Environment 187: 76–90. doi:10.1016/j.rse.2016.10.008.
- Li, Zhongbin, Wenzhong Shi, Soe W. Myint, Ping Lu, and Qunming Wang. 2016. “Semi-automated Landslide Inventory Mapping from Bitemporal Aerial Photographs Using Change Detection and Level set Method.” Remote Sensing of Environment 175: 215–230. doi:10.1016/j.rse.2016.01.003.
- Liu, Zhenqing, Yiwen Cao, Yize Wang, and Wei Wang. 2019. “Computer Vision-Based Concrete Crack Detection Using U-net Fully Convolutional Networks.” Automation in Construction 104: 129–139. doi:10.1016/j.autcon.2019.04.005.
- Liu, Peng, Yongming Wei, Qinjun Wang, Yu Chen, and Jingjing Xie. 2020. “Research on Post-Earthquake Landslide Extraction Algorithm Based on Improved U-Net Model.” Remote Sensing 12 (5): 894. doi:10.3390/rs12050894.
- Liu, Ying, and Linzhi Wu. 2016. “Geological Disaster Recognition on Optical Remote Sensing Images Using Deep Learning.” Procedia Computer Science 91: 566–575. doi:10.1016/j.procs.2016.07.144.
- Long, Jonathan, Evan Shelhamer, and Trevor Darrell. 2015. “Fully Convolutional Networks for Semantic Segmentation.” Paper presented at the Proceedings of the IEEE Conference on Computer Vision and Pattern Recognition.
- Martha, Tapas R., Norman Kerle, Cees J. van Westen, Victor Jetten, and K. Vinod Kumar. 2012. “Object-oriented Analysis of Multi-Temporal Panchromatic Images for Creation of Historical Landslide Inventories.” ISPRS Journal of Photogrammetry and Remote Sensing 67: 105–119. doi:10.1016/j.isprsjprs.2011.11.004.
- Mei, H., and J. X. Zhang. 2010. “Types and Distribution of Geological Hazards in Lanzhou City.” South-to-North Water Transfers and Water Science & Technology 8 (4): 53–57. doi:10.3724/SP.J.1201.2010.04053.
- Mohan, Amrita, Amit Kumar Singh, Basant Kumar, and Ramji Dwivedi. 2021. “Review on Remote Sensing Methods for Landslide Detection Using Machine and Deep Learning.” Transactions on Emerging Telecommunications Technologies 32 (7): e3998. doi:10.1002/ett.3998.
- Niu, Zhaoyang, Guoqiang Zhong, and Hui Yu. 2021. “Adaptive Cooperative Dynamic Surface Control of Non-Strict Feedback Multi-Agent Systems with Input Dead-Zones and Actuator Failures.” Neurocomputing 442: 48–63. doi:10.1016/j.neucom.2021.02.039.
- Oktay, Ozan, Jo Schlemper, Loic Le Folgoc, Matthew Lee, Mattias Heinrich, Kazunari Misawa, Kensaku Mori, Steven McDonagh, Nils Y Hammerla, and Bernhard Kainz. 2018. “Attention U-Net: Learning Where to Look for the Pancreas.” arXiv preprint arXiv:1804.03999.
- Pang, Yanwei, Yazhao Li, Jianbing Shen, and Ling Shao. 2019. “Towards Bridging Semantic Gap to Improve Semantic Segmentation.” Paper presented at the Proceedings of the IEEE/CVF International Conference on Computer Vision.
- Prakash, Nikhil, Andrea Manconi, and Simon Loew. 2020. “Mapping Landslides on EO Data: Performance of Deep Learning Models vs. Traditional Machine Learning Models.” Remote Sensing 12 (3): 346. doi:10.3390/rs12030346
- Qi, Wenwen, Mengfei Wei, Wentao Yang, Chong Xu, and Chao Ma. 2020. “Automatic Mapping of Landslides by the ResU-Net.” Remote Sensing 12 (15): 2487. doi:10.3390/rs12152487
- Quader, Niamul, Md Mafijul Islam Bhuiyan, Juwei Lu, Peng Dai, and Wei Li. 2020. “Weight Excitation: Built-in Attention Mechanisms in Convolutional Neural Networks.” Paper presented at the Computer Vision – ECCV 2020, Cham, 2020//.
- Ronneberger, Olaf, Philipp Fischer, and Thomas Brox. 2015. “U-Net: Convolutional Networks for Biomedical Image Segmentation.” Paper presented at the Medical Image Computing and Computer-Assisted Intervention – MICCAI 2015, Cham, 2015//.
- Sarkar, Tanmoy, and Mukunda Mishra. 2018. “Soil Erosion Susceptibility Mapping with the Application of Logistic Regression and Artificial Neural Network.” Journal of Geovisualization and Spatial Analysis 2 (1): 8. doi:10.1007/s41651-018-0015-9.
- Shamsolmoali, P., M. Zareapoor, R. Wang, H. Zhou, and J. Yang. 2019. “A Novel Deep Structure U-Net for Sea-Land Segmentation in Remote Sensing Images.” IEEE Journal of Selected Topics in Applied Earth Observations and Remote Sensing 12 (9): 3219–3232. doi:10.1109/JSTARS.2019.2925841.
- Soares, Lucas P, Helen C. Dias, and Carlos H Grohmann. 2020. “Landslide Segmentation with U-Net: Evaluating Different Sampling Methods and Patch Sizes.” arXiv preprint arXiv:2007.06672.
- Suzuki, Y., and S. Yamane. 2020. “Transfer Learning Model for Image Segmentation by Integrating U-Net ++ and SE Block.” Paper presented at the 2020 IEEE 9th Global Conference on Consumer Electronics (GCCE), October 13–16.
- Thomas, Anjana V., Sunil Saha, Jean Homian Danumah, S. Raveendran, Megha K. Prasad, R. S. Ajin, and Sekhar L. Kuriakose. 2021. “Landslide Susceptibility Zonation of Idukki District Using GIS in the Aftermath of 2018 Kerala Floods and Landslides: A Comparison of AHP and Frequency Ratio Methods.” Journal of Geovisualization and Spatial Analysis 5 (2): 21. doi:10.1007/s41651-021-00090-x.
- Tien Bui, Dieu, Nhat-Duc Hoang, Francisco Martínez-Álvarez, Phuong-Thao Thi Ngo, Pham Viet Hoa, Tien Dat Pham, Pijush Samui, and Romulus Costache. 2020. “A Novel Deep Learning Neural Network Approach for Predicting Flash Flood Susceptibility: A Case Study at a High Frequency Tropical Storm Area.” Science of The Total Environment 701: 134413. doi:10.1016/j.scitotenv.2019.134413.
- Trinh, Thanh, Binh Thanh Luu, Trang Ha Thi Le, Duong Huy Nguyen, Trong Van Tran, Thi Hai Van Nguyen, Khanh Quoc Nguyen, and Lien Thi Nguyen. 2022. “A Comparative Analysis of Weight-Based Machine Learning Methods for Landslide Susceptibility Mapping in Ha Giang Area.” Big Earth Data, 1–30. doi:10.1080/20964471.2022.2043520
- Wandong, Jiang, Xi Jiangbo, Li Zhenhong, Ding Mingtao, Yang Ligong, and Xie Dashuai. 2021. “Landslide Detection and Segmentation Using Mask R-CNN with Simulated Hard Samples.” Geomatics and Information Science of Wuhan University, 1–18. doi:10.13203/j.whugis20200692.
- Wang, Haonan, Peng Cao, Jiaqi Wang, and Osmar R. Zaiane. 2022. “UCTransNet: Rethinking the Skip Connections in U-Net from a Channel-Wise Perspective with Transformer.” Proceedings of the AAAI Conference on Artificial Intelligence 36 (3): 2441–2449. doi:10.1609/aaai.v36i3.20144.
- Wang, Haojie, Limin Zhang, Kesheng Yin, Hongyu Luo, and Jinhui Li. 2021. “Landslide Identification Using Machine Learning.” Geoscience Frontiers 12 (1): 351–364. doi:10.1016/j.gsf.2020.02.012.
- Xiao, Xiao, Fan Yang, and Amir Sadovnik. 2021. “MSDU-Net: A Multi-Scale Dilated U-Net for Blur Detection.” Sensors 21 (5): 1873. doi:10.3390/s21051873
- Xu, Chong, F. C. Dai, Jian Chen, X. B. Tu, Ling Xu, Wei Chao Li, W. Tian, Y. B. Cao, and X. Yao. 2009. “Identification and Analysis of Secondary Geological Hazards Triggered by a Magnitude 8.0 Wenchuan Earthquake.” Journal of Remote Sensing 13 (04): 754–762. doi:10.11834/jrs.20090416.
- Yang, Xiao. 2020. “An Overview of the Attention Mechanisms in Computer Vision.” Journal of Physics: Conference Series 1693 (1): 012173. doi:10.1088/1742-6596/1693/1/012173.
- Yang, W., M. Wang, and P. Shi. 2013. “Using MODIS NDVI Time Series to Identify Geographic Patterns of Landslides in Vegetated Regions.” IEEE Geoscience and Remote Sensing Letters 10 (4): 707–710. doi:10.1109/LGRS.2012.2219576.
- Yi, Y., and W. Zhang. 2020. “A New Deep-Learning-Based Approach for Earthquake-Triggered Landslide Detection from Single-Temporal RapidEye Satellite Imagery.” IEEE Journal of Selected Topics in Applied Earth Observations and Remote Sensing 13: 6166–6176. doi:10.1109/JSTARS.2020.3028855.
- Yi, Yaning, Zhijie Zhang, Wanchang Zhang, Chuanrong Zhang, Weidong Li, and Tian Zhao. 2019. “Semantic Segmentation of Urban Buildings from VHR Remote Sensing Imagery Using a Deep Convolutional Neural Network.” Remote Sensing 11 (15): 1774. doi:10.3390/rs11151774
- Zhang, Pengfei, Chong Xu, Siyuan Ma, Xiaoyi Shao, Yingying Tian, and Boyu Wen. 2020. “Automatic Extraction of Seismic Landslides in Large Areas with Complex Environments Based on Deep Learning: An Example of the 2018 Iburi Earthquake, Japan.” Remote Sensing 12 (23): 3992. doi:10.3390/rs12233992
- Zhang, L., L. Zhang, and B. Du. 2016. “Deep Learning for Remote Sensing Data: A Technical Tutorial on the State of the Art.” IEEE Geoscience and Remote Sensing Magazine 4 (2): 22–40. doi:10.1109/MGRS.2016.2540798.
- Zhao, W., A. Li, X. Nan, Z. Zhang, and G. Lei. 2017. “Postearthquake Landslides Mapping from Landsat-8 Data for the 2015 Nepal Earthquake Using a Pixel-Based Change Detection Method.” IEEE Journal of Selected Topics in Applied Earth Observations and Remote Sensing 10 (5): 1758–1768. doi:10.1109/JSTARS.2017.2661802.
- Zhu, Li, Lianghao Huang, Linyu Fan, Jinsong Huang, Faming Huang, Jiawu Chen, Zihe Zhang, and Yuhao Wang. 2020. “Landslide Susceptibility Prediction Modeling Based on Remote Sensing and a Novel Deep Learning Algorithm of a Cascade-Parallel Recurrent Neural Network.” Sensors 20 (6): 1576. doi:10.3390/s20061576