
 ?Mathematical formulae have been encoded as MathML and are displayed in this HTML version using MathJax in order to improve their display. Uncheck the box to turn MathJax off. This feature requires Javascript. Click on a formula to zoom.
ABSTRACT
Under the pressure of SDG15.3.1 compliance, it is imperative to solve the land salinization degradation problem in the Yellow River Basin as China’s granary. From the view of geographical scale, six zoning units were divided in the Yellow River Basin with ‘climate-meteorology-geomorphology’ as the main controlling factor, and a salinization inversion model was constructed for each zoning unit. Appropriate surface parameters were selected to construct a three-dimensional feature space according to the individual geographical zones. Based on the cloud data processing capability of the Google Earth Engine platform, a feature space inversion process was applied for automatic inversion of salinization. Salinization distribution maps of the Yellow River Basin in 2015 and 2020 were obtained at 30 m resolution by classifying the salinization inversion result. The distribution and spatiotemporal variation of salinization as well as the causes of salinization were analyzed. Reasonable prevention and control suggestions were subsequently proposed. This study could also be scaled up to larger and more complex geographical regions.
1. Introduction
Soil salinization is a common form of land degradation, and mainly refers to the accumulation of salt on the soil surface. Soil salinization leads to crop reduction and even death, which seriously restricts agricultural development and soil conservation. In the Sustainable Development Goals (SDGs) promulgated by the United Nations in 2016, SDG15.3.1 aims to reduce the proportion of degraded land over the total area. Soil salinization, which has become one of the major environmental and socioeconomic problems globally and is expected to intensify with climate change, has placed pressure on the SDG15.3.1 goals. According to current research, salinization occurs in various geographical regions worldwide. Argentina and other regions of South America have distributed salinization because the rock calcium layer changes the flow pattern of soil water (Milione et al. Citation2020). Australian agricultural soils predominantly contain sodium, accumulating salt with seasonal fluctuations, and exhibit various subsoil limitations, such as alkalinity, acidity, sodium, and toxic ions. Different types of salinization and widespread sodium salt affect approximately 30% of Australia’s land area (Rengasamy Citation2006). Soil salinization is serious in the marginal areas of Central and Eastern Europe, mainly because of a decrease in groundwater. The salinization in northern and central Europe is partially caused by soil loss from floods and flash floods (Falloon and Betts Citation2009). The main reasons for salinization in Greece are increased temperature and evaporation combined with decreased groundwater recharge. Under brackish water irrigation, salinization is aggravated by an increase in evapotranspiration (Daliakopoulos et al. Citation2016). Sea level rise and ground subsidence in the Netherlands have caused a sudden increase in shallow groundwater and surface water, aggravating salinization (Oude Essink Citation2001). The increased frequency of extremely high rainfall events in Italy combined with extremely dry conditions has caused increased evapotranspiration, resulting in the upward movement of highly saline groundwater and increased salinity in aquifers during the cold season (Colombani, Mastrocicco, and Giambastiani Citation2015). In Africa, salinization mainly occurs in parts of western South Africa, where water evaporates quickly because of the local arid environment and the subsequent salt accumulation worsens salinization (Du Preez and Van Huyssteen Citation2020). Projections based on salinization models indicate that dryland areas of South America, southern and western Australia, Mexico, the southwestern United States, and South Africa are future hotspots for salinization, whereas soil salinity will decrease in the arid areas of northwestern United States, the Horn of Africa, Eastern Europe, Turkmenistan, and western Kazakhstan (Hassani, Azapagic, and Shokri Citation2021).
Currently, salinization research methods can be divided into four categories. In the first method, the measurement of the electrical conductivity (EC) of soil samples is combined with software analysis to determine the salt distribution in an area. Amezketa (Citation2006) assessed, predicted, and mapped soil salinity using handheld electromagnetic sensors and ESAP software. Lizarraga (Citation2007) used the same method to analyze salt distribution in northern Spain and concluded that salinization resulted in a 32.9% yield loss. Wang and Jia (Citation2012) combined multi-sensor remote sensing data with field investigations to analyze the soil salinization process in China’s semi-arid regions during 1979–2009 and reported an increase in the salinized soil area of 0.28% per year from 1979 to 2009. Berkal et al. (Citation2014) built a multiple regression model using conductivity and salinization degree features to monitor the extent of salinization in the Saharan oasis. Ganjegunte, Sheng, and Clark (Citation2014) combined EC and electromagnetic induction to determine the salt index of cotton fields in Texas, USA. The second type is a semi-automated method, similar to supervised classification. He, Tashpolat, and Ding (Citation2006) extracted the distribution of salinization in Xinjiang using a decision tree classification. Elnaggar and Noller (Citation2009) used the decision tree classification method to classify salinization in the arid area of Oregon with an accuracy rate of up to 99%. Nurmemet et al. (Citation2015) proposed a decision tree scheme integrating multisource optical and polarization synthetic aperture radar (SAR) data, which improved the estimation and monitoring accuracy of soil salinization. Guo et al. (Citation2018) extracted salinization data in the Hetao area of Inner Mongolia using supervised classification. Feng, Ding, and Wei (Citation2019) extracted salinization information on the Weiku Oasis in Xinjiang by combining supervised classification with visual interpretation. By combining textural and spectral features and setting classification rules, Huang et al. (Citation2022) classified saline soils in the reclamation area of the Yellow River Delta. The third research method involves machine learning, deep learning, and other methods, with random forest (RF) and BP neural networks used as the main models. Wu et al. (Citation2018) combined Landsat 5 and ALOS L-band radar data to extract salinization information for the Mussaib region of central Mesopotamia using the RF regression (RFR) algorithm. Li et al. (Citation2021) combined GF-2 high-resolution data with an RF model to invert salinization in coastal areas of China. Kabiraj et al. (Citation2022) extracted salinization information using RFR models based on Landsat 8 and Sentinel-2 data and both datasets achieved sound results. In the fourth method, remote sensing images are used to extract relevant components and establish a feature space to invert salinization. Ha (Citation2009) discovered two key indicators for remote sensing monitoring of salinized soil based on spectral decomposition technology: soil spectral characteristics and biophysical characteristics of halophytic vegetation in saline areas. Simultaneously, researchers proposed a two-dimensional feature space – fraction spectral response index, which was effective in regional-scale salinized soil monitoring and evaluation in arid areas. In subsequent studies, Wang et al. used the salinization characteristics of different arid areas and constructed different feature space models for remote sensing inversion of soil salinization, with reasonable results (Wang, Ding, and Wu Citation2010; Fei Citation2011; Ding, Yao, and Wang Citation2014; Li et al. Citation2015; Zhang et al. Citation2016). Fan, Zhang, and Liu (Citation2016) applied the feature space method to invert soil salinization in a sub-humid region. Zhang (Citation2016) and Bian et al. (Citation2021) introduced different parameters to improve the inversion accuracy of soil salinization in sub-humid areas. Lu et al. (Citation2020) built the Modified Salinization Detection Index model based on two-dimensional characteristic space theory, and analyzed the spatiotemporal distribution of salinization in the Inner Mongolia irrigation area of the Yellow River Basin since 2000. Bian et al. (Citation2020) used the feature space method to complete the inversion of salinization in the Kenli area of the Yellow River Delta with an accuracy of 83%. Liu et al. (Citation2021) used different characteristic space models for the inversion of arid and sub-humid areas and compared their effects in different geographical regions. Muhetaer et al. (Citation2022) combined SAR data with the feature space method to monitor salinization in the Keriya Oasis. In conclusion, feature space models can be used for the remote sensing inversion of salinization on a large scale.
Salinization monitoring on a large spatiotemporal scale requires greater support from Earth observational data. However, large-scale remote sensing monitoring involves highly complicated data downloading and processing, large data volumes, inconvenient storage, and heavy workload. Using Google’s computing infrastructure and available open remote sensing image data, the Google Earth Engine (GEE) has accumulated a repository of online remote sensing satellite image data for greater more than 40 years, enabling researchers to monitor and analyze real-time changes in the Earth’s surface. The GEE cloud platform has millions of computer servers worldwide and can simultaneously process and analyze trillions of images. Its powerful cloud computing capability provides a convenient technical platform for processing and analyzing large-scale remote sensing satellite image data (Pei et al. Citation2018). Several researchers have combined GEE’s powerful computing capabilities with remote sensing research to improve image processing efficiency (Azzari and David Citation2017; Zhang et al. Citation2019; Liu et al. Citation2018; Meng et al. Citation2021; Hamud, Shafri, and Shaharum Citation2021).
Under pressure for SDG15.3.1 compliance, soil salinization monitoring in China is hampered by technological gaps. First, monitoring is extremely localized without large-scale coverage. Second, a large amount of data lacks support from cloud platforms. In this context, this study combined the GEE data platform and feature space method to monitor the spatial distribution of salinized soil in the Yellow River Basin through zone modeling. The GEE platform was used to invoke and process remote sensing image data to solve the complicated problem of managing large-scale salinization data. This research not only elucidates the spatiotemporal variations in salinization in the Yellow River Basin but also provides suggestions for salinization prevention and control to combat land degradation for compliance with SDG15.3.1.
2. Materials
2.1 Study area
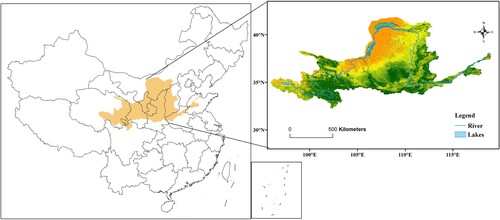
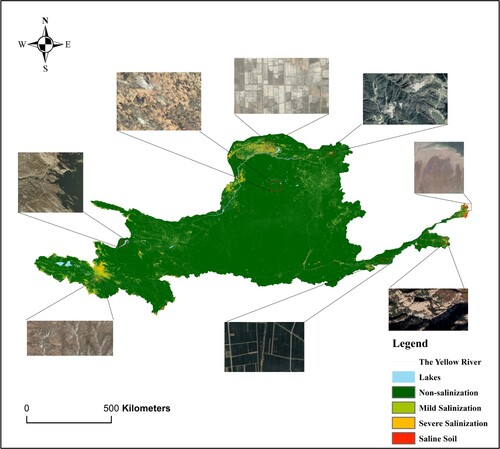
The Yellow River, the mother river of China, originates from the Bayankala Mountains in Qinghai Province, flows through nine provinces and regions (Qinghai, Sichuan, Gansu, Ningxia, Inner Mongolia, Shaanxi, Shanxi, Henan, and Shandong), and finally empties into the Bohai Sea along the northeast coast of China adjacent to Shandong Province. The Yellow River Basin, which has high and low terrain in the east and west, respectively, is divided into three parts: namely, the upper, middle, and lower reaches, according to China’s topography. The upper reaches of the region belong to the Tibetan Plateau, stretching from the source of the Yellow River Bayanjara Mountains to Guide County, which has several mountains and grasslands, with the main ecological problems being grassland and wetland degradation, and soil salinization. The middle reaches belong to the Loess Plateau, from Guide County to Mengjin County and contain several mountains, plateaus, and valleys, with uneven landform and swift water flow. Farming and animal husbandry are mixed in this region. Soil erosion is the primary ecological problem in this area. The lower reaches belong to the North China Plain, the region is flat, and the main ecological problem is soil salinization ().
Figure 1. Study area.
2.2 Datasets
In this study, Landsat8_OLI (Operational Land Imager) time series data of the Yellow River Basin for 2015 and 2020 were used at 30 m spatial resolution, with a preference for April data in both years. The data used for accuracy verification included field-measured data samples and GEE sample points. Attributes of the measured data collected in 2015 (15 samples) and 2020 (40 samples), included the longitude, latitude, EC, salt content, and pH value at the sampling point. Based on the high-resolution image of GEE, 100 sample points were selected according to the texture features of salinization.
2.3 Subareas of the study area
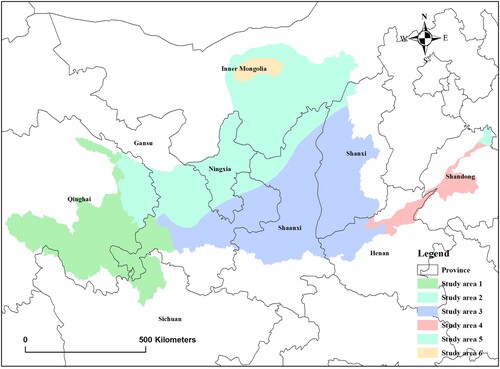
The Yellow River Basin was further classified into zones considering the complex geographical features of the region. The study area was divided into six parts with ‘climate-meteorology-geomorphology’ as the main controlling factor, as exhibited in . The Qinghai-Tibet Plateau, located in the upper reaches of the Yellow River Basin, was designated as sub area 1. It has a plateau alpine climate with long winters and short summers, less precipitation, and perennial snow in the western mountainous area. The Loess Plateau, which contains multiple alpine canyons and is located in the middle reaches of the Yellow River Basin, was classified into sub areas 2 and 3. Sub area 2 contains a few desert areas with a temperate continental climate, and sub area 3 has a temperate monsoon climate. The North China Plain, located in the lower reaches of the Yellow River Basin, was classified as sub area 4. Sub areas 5 and 6 are typical plain areas. While sub area 5 comprised the Yellow River Delta, a typical subhumid area susceptible to salinization in coastal region, sub area 6 represented the Hetao region of Inner Mongolia, a typical salinization area in an arid region.
Figure 2. Subareas of the study area.
3. Methods
3.1 Selection of inversion parameters
The main influencing indices considered for constructing the inversion model of spatial salt distribution included the land surface albedo index (Albedo), vegetation cover index (NDVI), soil adjusted vegetation index (MSAVI), SI, iron oxide content (Fe2O3), and humidity index (WI).
Albedo. This refers to the ability of objects on the surface of the earth to reflect solar radiation. Surface albedo varies greatly with different spectral characteristics. Changes in the salinization level caused changes in the ground texture and differences in surface reflectance. Liang (Citation2001) gave the formula and coefficients for Albedo parameter using Landsat TM sensors. The formula is as follows:
(1)
(1) Where B, R, NIR, SR1, and SR2 correspond to the reflectance values of the blue, red, near-infrared, short-infrared 1, and short-infrared 2 bands, respectively, of the Landsat8 OLI multispectral image.
SI. Khan and Sato (Citation2001) proved through experiments that the SI composed of blue and red bands of Landsat ETM + data could better reflect the degree of soil salinization. This index plays an important role in soil salinization measurement. The formula is as follows:
(2)
(2) Where B, R correspond to the reflectance values of the blue and red bands, respectively, of the Landsat8 OLI multispectral image.
NDVI. This index reflects the vegetation coverage status. Different levels of salinization lead to different vegetation growth patterns on the surface, with corresponding changes in the NDVI value. The formula is as follows:
(3)
(3) Where NIR and R correspond to the reflectance values of the near-infrared and red bands, respectively, of the Landsat8 OLI multispectral image.
MSAVI. This index can correct the influence of bare soil on the vegetation in NDVI and can replace it to measure soil salinization in areas with greater amount of cultivated land. The formula is as follows (Qi et al. Citation1994):
(4)
(4) Where NIR and R correspond to the reflectance values of the near-infrared and red bands, respectively, of the Landsat8 OLI multispectral image.
Fe2O3. The salinization process not only affects environmental factors such as vegetation, soil moisture, climate, and topography, but also causes changes in soil chemistry. Therefore, Fe2O3 was selected as an index for evaluating salinization. The formula is as follows:
(5)
(5) Where NIR and R correspond to the reflectance values of the near-infrared and red bands, respectively, of the Landsat8 OLI multispectral image.
WI. Salt rises to the land surface with water, and remains on it after evaporation, resulting in soil salinization; therefore, the higher the wetness level, the higher the salinization. The formula is as follows (Crist Citation1985):
(6)
(6) Where B, R, G, NIR, SR1, and SR2 correspond to the reflectance values of the blue, red, green, near-infrared, short infrared 1, and short infrared 2 bands, respectively, of the Landsat8 OLI multispectral images.
3.2 Construction of feature space
3.2.1 Principle of three-dimensional feature space
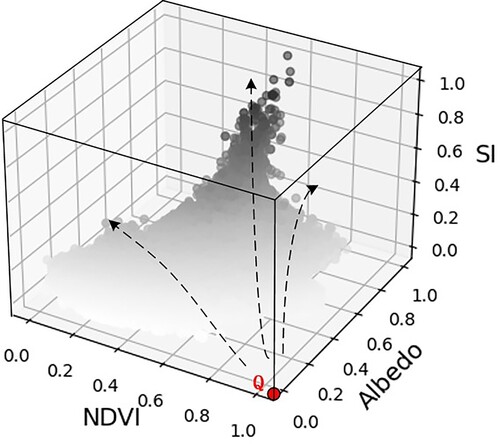
The NDVI, Albedo, and SI pixel information for the study area were selected to construct a three-dimensional feature space. The feature space function was obtained based on the pixel trend. The variation trends in the pixels are presented in . Considering point Q (1,0,0), as the point with the highest NDVI index, lowest SI index, and lowest Albedo (thus representing the lowest salinization degree), the closer the other pixels to point Q, the lower the degree of salinization. In contrast, the farther the other pixels from point Q, the higher the degree of salinization. Based on this principle, a three-dimensional feature space function was constructed using the following formula:
(7)
(7) Where L represents the degree of salinization, and Albedo, SI, and NDVI represent the land surface albedo, salt content, and vegetation coverage indices, respectively.
Figure 3. Principle diagram of the feature space.
3.2.2 Construction of the feature space model by region
Different feature parameters were selected to construct a three-dimensional feature space based on the zonal features of the study area.
Because the presence of several snowy mountains in sub area 1 may affect the surface reflectance values, parameters other than Albedo were selected. The SI, WI, and NDVI were selected as the parameters to construct the feature space for this area. Point A (0,0,1) represents the lowest degree of salinization. The closer the pixels to point A, the lower the degree of salinization; otherwise, the higher the degree of salinization. The following formula was used.
(8)
(8) Where L represents the degree of salinization, and SI, WI, and NDVI represent the salinity, humidity, and vegetation coverage indices, respectively.
Sub area 2 contains a few desert areas. Desert areas appear highly illuminated in the satellite image, which greatly affects the surface reflectance and humidity indices; therefore, the WI and Albedo indices were excluded here. The SI, NDVI, and Fe2O3 parameters were selected to construct the feature space, and point B (0,1,0) was selected to represent the lowest the degree of salinization. The closer the other pixels to point B, the lower the degree of salinization; otherwise, the higher the degree of salinization. The formula is as follows:
(9)
(9) Where L represents the degree of salinization, and SI, Fe2O3, and NDVI represent the salt, iron oxide, and vegetation coverage indices, respectively.
As sub area 3 was comprised of trees and arable land, NDVI and Albedo were suitable surface parameters. Albedo, SI, and NDVI were selected as parameters to construct the feature space. Point C (0,0,1) was selected to represent the lowest salinization content. The closer the pixels to point C, the lower the degree of salinization; otherwise, the higher the degree of salinization. The formula is as follows:
(10)
(10) Where L is the degree of salinization, and SI, Albedo, and NDVI are the salinity, land surface albedo, and vegetation coverage indices, respectively.
Because of the greater amount of cultivated lands in sub area 4, MSAVI was suitable for monitoring salinization in this area. Therefore, SI, Albedo, and MSAVI were selected as the parameters for constructing the feature space in this area. Point D (0,0,1) was selected as the point with the lowest degree of salinization. The closer the other pixels to point D, the lower the degree of salinization; otherwise, the higher the degree of salinization. The formula is as follows:
Where L represents the degree of salinization, and SI, Albedo, and MSAVI represent the salinity, surface albedo, and soil-adjusted vegetation indices, respectively.
As sub area 5 was a typical subhumid area affected by air humidity, SI, Albedo, and WI were selected as the parameters to construct the feature space. Point E (0,0,0) was selected to represent the lowest salinization content. The closer the other pixels to point E, the lower the degree of salinization; otherwise, the higher the degree of salinization. The formula is as follows:
(11)
(11) Where L represents the salinization degree, and SI, Albedo, and WI represent the salinity, surface albedo, and humidity indices, respectively.
Sub area 6 was located in Hetao region of Inner Mongolia, with abundant arable land and dry climate. SI, Albedo, and MSAVI were selected as the parameters to construct the feature space for this area. Point F (0,0,1) was selected as representative lowest salinization degree point. The closer the other pixels to point F, the lower the degree of salinization; otherwise, the higher the degree of salinization. The following equation was used:
(12)
(12) Where L represents the degree of salinization, and SI, Albedo, and MSAVI are the salinity, surface albedo, and soil-adjusted vegetation indices, respectively.
3.3 Classification of salinization level
Areas with a greater proportion of cultivated land in each of the six study areas were selected as the experimental areas, and their salinization maps were obtained under supervised classification according to the degree of salinization of the cultivated land. The test areas were divided into four categories: non-salinization, mild salinization, severe salinization, and saline soil (). Crops in non-salinized soil had satisfactory growth conditions, and appeared as dark green spots on remote sensing images. In areas with mild salinization, crop growth was slightly inhibited, and approximately 1/5–1/2 of the crops exhibited a lack of seedlings, appearing as light green spots on the remote sensing images. Agricultural growth was severely inhibited in severely salinized areas, with more than half of the seedlings missing in the crops, appearing as lighter spots in the images. Generally, a remote sensing image appears dark green, accompanied by white spots. However, in saline soil areas with scant crop growth, a large number of light spots appear as large white areas in the images (Lu et al. Citation2011).
Table 1. Cultivated land classification.
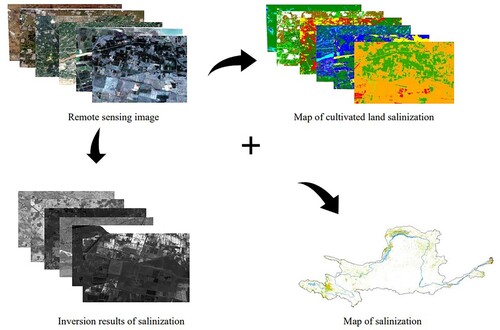
According to the classification standard in , cultivated land classifications were obtained by means of supervised classification. The feature space method was used to invert the remote sensing image to get the inversion results of the feature space. The cultivated land classification and inversion results of the feature space were superimposed to obtain the classification values, which were used as a reference to obtain the salinization grade distribution map of the study area ().
Figure 4. Classification process map.
4. Results
4.1 Analysis of overall results
The salinization distribution map of the Yellow River Basin for 2015 is shown in (a). Fifteen measured points and 100 GEE sample points from 2015 were used to verify the salinization distribution map and its accuracy, respectively. The accuracy of the measured and GEE sample points was 80% and 72%, respectively, with an overall accuracy of 73%. According to the salinization spatial distribution map in 2015, saline soil was mainly distributed in the Yellow River Delta (sub area 5) and Hetao region of Inner Mongolia (sub area 6). Severe salinization is mainly observed in the Guoluo Tibetan Autonomous Region in the upper reaches of the Yellow River (sub area 1), Hetao region of Inner Mongolia (sub area 6), part of Ningxia (sub area 2), Tai ‘an City of Shandong Province (sub area 4), Yellow River Delta (sub area 5), and other areas. Mildly salinized soil is mainly distributed in parts of Henan Province, Gansu Province, and Luliang and Taiyuan Cities of Shanxi Province (sub area 3 and sub area4). According to statistical analysis, salinization accounted for 9.42% of the study area in 2015, of which mild salinization accounted for the largest proportion (58831.02 km2; 7.40% of the total area). Severe salinization was observed in 11845.52 km2 area, accounting for 1.49% of the total. Saline soil covers 42,13.51 km2, accounting for approximately 0.53% of the total area.
Figure 5. (a) Yellow River Basin salinization distribution map in 2015; (b) Yellow River Basin salinization distribution map in 2020.
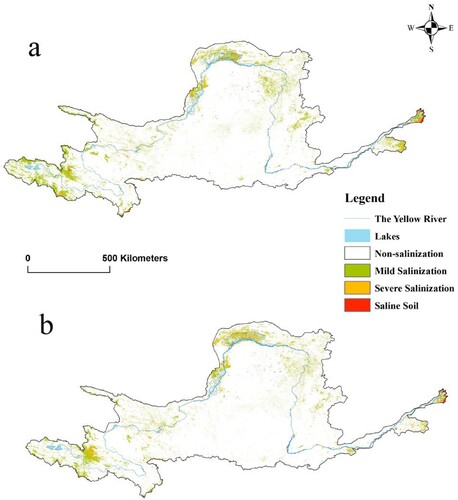
The salinization distribution map of the Yellow River Basin for 2020 is shown in (b). The accuracy of the salinization distribution map was verified using 40 measurement points and 100 GEE sample points for 2020. The accuracy of the measured and GEE sample points was 77.50% and 70%, respectively, with an overall accuracy of 72.14%. According to the spatial salinization distribution map in 2020, saline soil was mainly distributed in the Yellow River delta (sub area 5) and Hetao region of Inner Mongolia (sub area 6). Severe salinization was mainly distributed in the Guoluo Tibetan Autonomous Region in the upper reaches of the Yellow River (sub area 1), Hetao region of Inner Mongolia (sub area 6), part of Ningxia (sub area 1), Tai’an City of Shandong Province (sub area 4), Yellow River Delta (sub area 5). Mild salinization was mainly observed in parts of Henan (sub area 3)、 Gansu Province (sub area 2) and Luliang and Taiyuan Cities of Shanxi Province (sub area 3). According to statistical analysis, the salinization accounted for 8.14% of the total study area in 2020, of which mild salinization accounted for the largest proportion (45633.05 km2; 5.74% of the total area). Severe salinization had the next highest contribution, covering 14548.50 km2 (1.83% of the total area). Saline soil covered an area of 4372.45 km2, accounting for approximately 0.55% of the total area.
4.2 Distribution characteristics of salinization
The analysis of the main ground features in the salinization distribution areas revealed the following: (1) Soil around lakes is easily salinized. Several small lakes are present in the Mu Us Sandy Land and Kubuchi Desert (sub area 2), and a certain amount of salinized soils can be observed around these lakes. Similarly, salinized soil was observed near lakes in other areas, such as the saltwater lake in Qinghai Province and Longyangxia Reservoir in Ningxia (sub area 1), and Wuliangsuhai in Inner Mongolia ‘Hetao Region’ (sub area 6), as shown in . (2) Salinization has a higher distribution in hydrogeological complex areas, such as wetlands. The Hetao area of Inner Mongolia (sub area 6) and the Yellow River Delta (sub area 5) are affected by salinization, and most of them are salinized. For example, severe salinization occurs in the Urat Zhongqi area of Bayannaoer City, Inner Mongolia Autonomous Region (sub area 6), as well as in the Kenli and Hekou Districts of Dongying City, Shandong Province (sub area 5), especially in areas bordering the Bohai Sea, as shown in . (3) Salinization can occur in mountainous regions. Because of their transformation into terraced farmland using artificial open tillage, a few mountainous areas, such as those in Gansu Province (sub area 3), may be salinized owing to excessive exploitation. The other part of the mountain near the ridge, such as the Inner Mongolia Bayannaoer City Urat back banner (sub area 6), also appeared to be salinized, as shown in .
Figure 6. Detailed map of salinization distribution.
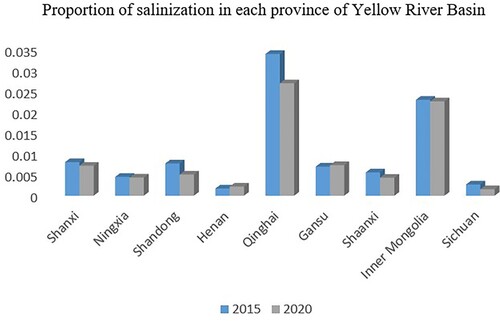
4.3 Proportion of salinization in each province of the Yellow River basin
In 2015, the proportion of salinization in the Yellow River Basin was 9.40%. As shown in , the three provinces with the largest proportion of salinization areas are Qinghai, Inner Mongolia, and Shanxi. Qinghai Province had 3.39% land area with salinized soil, covering an area of 26,950.52 km2. Inner Mongolia was placed second, with 18046.47 km2 salinized area (2.27%). Shanxi was ranked third with 6,360.12 km2 salinized area (0.80% of the total Yellow River Basin). By 2020, 8.13% of the Yellow River Basin was salinized. As presented in , the three provinces with the largest salinization areas are Qinghai, Inner Mongolia, and Gansu. Qinghai Province accounted for the maximum salinization area in the Yellow River Basin (2.69%), with an area of 21385.5 km2; Inner Mongolia followed with 2.26%, covering 17,967.23 km2; and Gansu Province ranked third (0.73%), with an area of 5,803.59 km2. An in-depth analysis of the data revealed that although Qinghai and Gansu Provinces have relatively large salinization areas, most of them are mildly salinized, with weak salinization. Severely salinized and saline-alkali soils are mainly distributed in Inner Mongolia and Shandong.
Figure 7. Proportion of salinization in each province of the Yellow River Basin (the proportion of salinization soil in each province of the Yellow River Basin in the total the Yellow River Basin).
5. Discussion
5.1 Analysis of salinization change
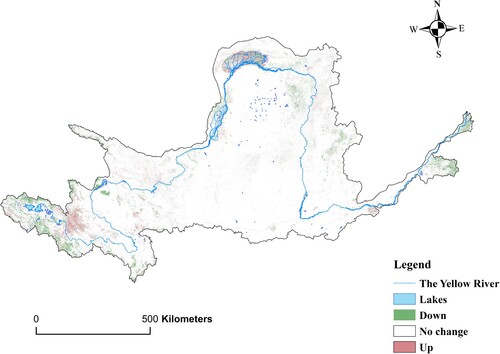
The spatial distribution maps of salinization in the Yellow River Basin in 2015 and 2020 were compared and analyzed to obtain the salinization degree change map, as illustrated in . The salinization degree change map combined with the statistical data of salinization in 2015 and 2020 revealed that: (1) the overall salinization area exhibited a clearly decreasing trend, and in the upstream areas (sub area 1), namely Qinghai and Sichuan Provinces, this trend decreased significantly. The degree of salinization in the Loess Plateau of the middle reaches and the lower reaches of the Yellow River Basin (sub area 2 and sub area 3) also presented a decreasing trend, with decreasing salinization mainly present in Shanxi, Shaanxi, Henan, and Shandong provinces. The southern and central regions of Qinghai Province along with the northern region of Ningxia displayed a decreased degree of salinization. (2) The degree of salinization presented a partially increasing trend in few areas, such as, Maduo County and Maqin County of Qinghai Province (sub area 1), the Hetao area of Inner Mongolia (sub area 6), and the area near Pinglu County of Yuncheng City in Shanxi Province (sub area 3). The areas under Maduo and Maqin Counties (sub area 1) are Sanjiangyuan Conservation Areas, which have a complex hydrological environment and several brackish lakes. In addition, the area has more complex types of landforms, including low mountains, hills, beaches, and valleys. The complex hydrological environment and geomorphological typologies may have led to increased salinization in this area. In addition, the area is a relatively developed animal husbandry area, which may also lead to worsening of local salinization. As illustrated in , the Hetao area of Inner Mongolia (sub area 6) has a complex water system and is located near the desert. It has a dry climate and high evaporation, which may be the reason for the aggravation in salinization. A few wetlands are located near Pinglu County, Yuncheng City, Shanxi Province (sub area 3). No clear salinization trend was observed in the following areas: the salinization degree in certain mountainous areas along the border of Qinghai and Gansu Provinces exhibited a slight increasing trend; a few areas on the right side of the Yellow River in the border regions of Inner Mongolia and Shanxi Province also displayed a slightly increasing salinization trend. A slight increase in salinization was also observed in the southwest of Gansu Province. (3) Geomorphological analysis of the areas with increasing salinization degree, revealed greater amount of salinization in wetlands, hills, mountains, valleys, and other areas. Analysis of the hydrological conditions of areas with increasing salinization, revealed that areas with greater water flow, more lakes, and complicated hydrological conditions are highly susceptible to increased salinization. By analyzing the climatic conditions of increasing salinization areas, it was found that areas with arid and extremely cold climates are prone to increased salinization.
Figure 8. Salinization degree change map.
5.2 Analysis of reasons for salinization
5.2.1 Salinization caused by human factors
Unreasonable land irrigation, fertilization, and overuse of cultivated land can lead to soil salinization (Zhao, Xia, and Zou Citation2022). For example, certain areas of Henan Province (sub area 2) exhibited a slightly increasing salinization trend. Henan Province is a large agricultural province, and the increase in salinization may be caused by unreasonable land management. A few areas in Gansu Province (sub area 2) also have mild salinization, which can be attributed to the excessive reclamation of mountainous areas and unreasonable irrigation method (Yang et al. Citation2014). Taiyuan City and Luliang City of Shanxi Province and other areas with cultivated land also experienced salinization.
5.2.2 Salinization caused by natural factors
Salinization controlled by topographic and geomorphic factors (Zhao, Xia, and Zou Citation2022): Topographic and geomorphic factors can affect surface water and groundwater runoff, thereby affecting soil salinization. For example, salinization in a few mountainous areas such as Gansu Province (sub area 2), part of Shaanxi Province (sub area 3), and part of Shandong Province (sub area 4) may be caused by such factors. Owing to differences in topography and landform, the salt in the upper soil and strata is dissolved in the surface water and groundwater runoff. The coupled effect of evaporation and concentration increased the overall solubility. Therefore, the degree of soil salinization gradually intensifies with topography, from high to low and from upstream to downstream (Lai et al. Citation2014).
Salinization controlled by climatic and topographic factors (Zhao, Xia, and Zou Citation2022): Salinization of the Yellow River Delta (sub area 5) in coastal areas, which is at a serious stage, is mainly attributed to its special geographical location and local climate conditions. Shandong Provincial Department of Agriculture and Rural Affairs (Citation2022) issued the report ‘Shandong Province Saline-alkali Land Ecological Fishery Development Plan (2022-2030)’, which also showed that the Yellow River Delta area of salinization was extensive. The Yellow River Delta (sub area 5) is a modern salinized soil owing to the influx seawater and chloride salts from the Bohai Sea. The land is subjected to frequent inundation and lateral invasion by seawater after its formation. Coastal salinized soil with high salinity is formed under the action of strong evaporation and salt accumulation. Severe mineralization, high salt content, and shallow water coupled with the local dry climate and rapid water evaporation leads to highly sever salinization (Liu et al. Citation2021).
Salinization controlled by climatic factors: This type of salinization mainly occurs in arid areas with lakes. For example, in certain areas of the Guoluo Tibetan Autonomous Prefecture in the upper reaches of the Yellow River (sub area 1), erratic local water flow and the frozen soil leading to the formation of numerous brackish lakes, which results in soil salinization (Zhang et al. Citation2018). In the Hetao region of Inner Mongolia (sub area 6), the arid climate environment and unreasonable hydrogeological conditions led to an increase in surface evaporation and subsequent transport of salt to the surface, which has worsened salinization in Hetao region (Liu et al. Citation2012). Zhang and Liu (Citation2022) also concluded that arid weather had caused extensive salinization in Hetao region of Inner Mongolia and proposed improvement strategies. Influenced by arid climate, highly mineralized geology, and an unreasonable hydrological environment, the Qingtongxia irrigated area of Ningxia and its adjacent areas have also experienced severe salinization.
5.3 Suggestions for the prevention of salinization
In areas with over-exploited cultivated land, the implementation of a policy to return farmland to forest and grazing land to grassland is suggested. For example, by comparing the salinization status of the Yellow River Basin in 2015 and 2020, it was found that the degree of salinization of the Loess Plateau exhibited an overall decreasing trend from 2015 to 2020, which was related to the policy of returning farmland to forests and grasslands. Since its implemented in 1999, vegetation coverage has increased by approximately 28%, with decreased soil and water loss. Irrational water resource utilization and land reclamation have decreased (Chen et al. Citation2015), with a corresponding significant decrease in salinization in the Loess Plateau region. However, in a few areas of Gansu (sub area 2) and Henan (sub area 3), especially in mountainous areas, excessive reclamation of forests, conversion of wasteland into terraced fields, and unreasonable irrigation methods may have led to increased salinization. The extent of salinization in Sichuan Province in the upper reaches of the Yellow River (sub area 1) has decreased significantly, which may be related to the agricultural protection policy announced by the province in 2015 to implement key projects, such as grassland ecological protection, returning grazing land to grassland, and returning farmland to forests (Bai Citation2015).
In salinized cultivated areas, owing to climate, hydrology, and other natural factors, the development of agricultural demonstration fields and the cultivation of saline-resistant rice varieties is suggested. For example, in 2013, ‘Bohai Granary’ cultivated saline-resistant rice in the agricultural high-tech industrial demonstration zone of the Yellow River Delta (sub area 5). In addition to improving crop yield, rice roots improved soil composition and reduced salinization levels. The Yellow River Delta (sub area 5) was also significantly less salinized. Simultaneously, measures were taken to build rational irrigation channels and establish agricultural demonstration bases in the Hetao region of Inner Mongolia (sub area 6) in 2020.
For salinization caused by topographic differences, adjusting the water transport mechanism is suggested. Under the Yellow River Protection Law of the People’s Republic of China, measures have been promulgated to actively develop and popularize water networking, basin twinning, and other technologies to solve problems, such as insufficient access to basin information, untimely information processing, and extensive management measures, and to greatly improve the level of refined basin management (Wang and Zhao Citation2022). The inclusion of water use in mountainous areas in the water resource management mechanism of the Yellow River Basin is suggested.
6. Conclusions
Soil salinization is an urgent ecological problem in the Yellow River Basin. Based on the GEE data platform, this study used the feature space method and geographical zoning approach to monitor the spatial distribution of saline soil in the Yellow River Basin in 2015 and 2020, with an accuracy of almost 70%, which can provide support for large-scale salinization studies. First, the Yellow River Basin was divided into six parts by taking ‘climate-meteorology-landform’ as the main control factor. Models for inversing the degree of salinization (L) were constructed after individually selecting suitable surface parameters for each of the six parts. Inversion maps were obtained by selecting the best model. Second, a supervised classification method was used to superimpose the cultivated land distribution map with the inversion map to obtain the reference classification value for the study area. Finally, the measured and GEE sample points were used to verify the accuracy of the distribution map. Analysis revealed that: (1) in 2015 and 2020, salinization was concentrated in the Yellow River Delta (sub area 5) and Hetao region of Inner Mongolia (sub area 6); areas with mild salinization were mainly distributed in the middle and lower reaches of the Yellow River and part of Shanxi Province (sub area 3 and sub area 4); and severe salinization was mainly observed over Qinghai and Ningxia Provinces in sub area 2, and part of Sichuan Province (sub area 1). (2) The salinization area showed a downward trend overall, but the degree of salinization increased in some areas (Qinghai and Sichuan Provinces in sub area 1). The degree of salinization in the Loess Plateau in the middle reaches (sub area 2 and sub area 3), and Yellow River Delta (sub area 5) in the lower reaches displayed a clearly decreasing trend. Certain areas, such as the Sanjiangyuan Conservation region in sub area 1 and Hetao region of Inner Mongolia (sub area 6), have experienced a slight increase in salinization. (3) Salinization can be classified based on whether it is caused by human or natural factors after analyzing the distribution areas, local climate, and topography. Human factors mainly refer to unreasonable land irrigation, fertilization, and overuse of cultivated land. Natural factors include landforms, climate, and hydrogeology. Based on a comparative analysis of salinization areas in the Yellow River Basin from 2015 to 2020, measures were suggested in combination with policies. This study can also be scaled up to include larger and more complex geographical regions.
Acknowledgements
We give appreciations to the United States Geological Survey (USGS) for providing Landsat-8 OLI data.
Disclosure statement
No potential conflict of interest was reported by the authors.
Additional information
Funding
References
- Amezketa, E. 2006. “An Integrated Methodology for Assessing Soil Salinization, a Pre-condition for Land Desertification.” Journal of Arid Environments 67 (4): 594–606. doi:10.1016/j.jaridenv.2006.03.010.
- Azzari, G., and L. David. 2017. “Landsat-Based Classification in the Cloud: An Opportunity for a Paradigm Shift in Land Cover Monitoring.” Remote Sensing of Environment 202: 64–74. doi:10.1016/j.rse.2017.05.025.
- Bai, W. P. 2015. “Sichuan Province Has Focused on Five Aspects to Promote the Accelerated Development of Agriculture and Animal Husbandry in Ethnic Minority Areas [In Chinese.].” The People’s Government of Sichuan Province, August 20. https://www.sc.gov.cn/10462/10464/10465/10574/2015/8/20/10349408.shtml.
- Berkal, I., C. Walter, D. Michot, and K. Djili. 2014. “Seasonal Monitoring of Soil Salinity by Electromagnetic Conductivity in Irrigated Sandy Soils from a Saharan Oasis.” Soil Research 52 (8): 769–780. doi:10.1071/SR13305.
- Bian, L. L., J. L. Wang, B. Guo, K. Cheng, and H. S. Wei. 2020. “Remote Sensing Extraction of Soil Salinity in Yellow River Delta Kenli County Based on Feature Space.” Remote Sensing Technology and Application 35 (1): 211–218. doi:10.11873/j.issn.1004-0323.2020.1.0211.
- Bian, L. L., J. Wang, J. Liu, and B. Han. 2021. “Spatiotemporal Changes of Soil Salinization in the Yellow River Delta of China from 2015 to 2019.” Sustainability 13 (2): 822. doi:10.3390/su13020822.
- Chen, Y., K. Wang, Y. Lin, W. Shi, Y. Song, and X. He. 2015. “Balancing Green and Grain Trade.” Nature Geoscience 8 (10): 739–741. doi:10.1038/ngeo2544.
- Colombani, N., M. Mastrocicco, and B. M. S. Giambastiani. 2015. “Predicting salinization trends in a lowland coastal aquifer: Comacchio [In Italy].” Water Resources Management 29 (2): 603–618. doi:10.1007/s11269-014-0795-8.
- Crist, E. 1985. “A TM Tasseled Cap Equivalent Transformation for Reflectance Factor Data.” Remote Sensing of Environment 17 (3): 301–306. doi:10.1016/0034-4257(85)90102-6.
- Daliakopoulos, I. N., P. Pappa, M. G. Grillakis, E. A. Varouchakis, and I. K. Tsanis. 2016. “Model ling soil salinity in greenhouse cultivations under a changing climate with SALTMED: model modification and application in Timpaki.” Soil Science 181 (6): 241–251. doi:10.1097/SS.0000000000000161.
- Ding J. L., Y. Yao, and F. Wang. 2014. “Detecting Soil Salinization in Arid Regions Using Spectral Feature Space Derived from Remote Sensing Data [In Chinese].” Acta Ecologica Sinica 34 (16): 4620–4631.
- Du Preez, C. C., and C. W. Van Huyssteen. 2020. “Threats to Soil and Water Resources in South Africa.” Environmental Research 183: 109015. doi:10.1016/j.envres.2019.109015.
- Elnaggar, A. A., and J. S. Noller. 2009. “Application of Remote-Sensing Data and Decision-Tree Analysis to Mapping Salt-Affected Soils Over Large Area.” Remote Sensing 2 (1): 151–165. doi:10.3390/rs2010151.
- Falloon, P., and R. Betts. 2009. “Climate Impacts on European Agriculture and Water Management in the Context of Adaptation and Mitigation—the Importance of an Integrated Approach.” Science of the Total Environment 408 (23): 5667–5687. doi:10.1016/j.scitotenv.2009.05.002.
- Fan, Y. G., W. K. Zhang, and J. Y. Liu. 2016. “Remote Sensing Monitoring Model of Soil Salinization in the Yellow River Delta Zone Based on Vegetation Index—Salt Index Feature Space [In Chinese].” Shandong Agricultural Sciences 48 (5): 137–141. doi:10.14083/j.issn.1001-4942.2016.05.035.
- Fei, Zhang. 2011. “Study on the Spectral Characteristics of Salinized Soil with Ground Objects in the Typical Oasis of Arid Area.” Ph D Diss., Xinjiang University.
- Feng, J., J. L. Ding, and W. Y. Wei. 2019. “Soil Salinization Monitoring Based on Radar Data [In Chinese.].” Remote Sensing for Land and Resources 31 (1): 195–203. doi:10.6046/gtzyyg.2019.01.26.
- Ganjegunte, G. K., Z. Sheng, and J. A. Clark. 2014. “Soil Salinity and Sodicity Appraisal by Electromagnetic Induction in Soils Irrigated to Grow Cotton.” Land Degradation & Development 25 (3): 228–235. doi:10.1002/ldr.1162.
- Guo, S., B. Ruan, H. Chen, X. Guan, S. Wang, N. Xu, and Y. Li. 2018. “Characterizing the Spatiotemporal Evolution of Soil Salinization in Hetao Irrigation District (China) Using a Remote Sensing Approach.” International Journal of Remote Sensing 39 (20): 6805–6825. doi:10.1080/01431161.2018.1466076.
- Ha, X.P. 2009. “Remote Sensing-Based Synthesis Index Model for Monitoring of Soil Salinization in Arid Are.” PhD Diss., Xinjiang University.
- Hamud, A. M., H. Z. M. Shafri, and N. S. N. Shaharum. 2021. “Monitoring Urban Expansion And Land Use/Land Cover Changes In Banadir, Somalia Using Google Earth Engine (GEE).” IOP Conference Series: Earth and Environmental Science 767 (1): 012041. doi:10.1088/1755-1315/767/1/012041.
- Hassani, A., A. Azapagic, and N. Shokri. 2021. “Global Predictions of Primary Soil Salinization Under Changing Climate in the 21st Century.” Nature Communications 12 (1): 1–17. doi:10.1038/s41467-021-26907-3.
- He, Q. S., T. Tashpolat, and J. L. Ding. 2006. “The Extraction of Saline Soil Information in Arid Area Based on Decision Tree Algorithm: A Case Study in the Delta Oasis of Weigan and Kuqa Rivers [In Chinese].” Resources Science 2006 (06): 134–140. doi:10.3321/j.issn:1007-7588.2006.06.020.
- Huang, J., G. X. Zhao, X. Xi, K. Cui, and P. Gao. 2022. “Extraction of Soil Salinization Information by Combining Spectral and Texture Data in the Yellow River Delta: A Case Study in Kenli District, Shandong Province [In Chinese].” Journal of Agricultural Resources and Environment 39 (3): 594–601. doi:10.13254/j.jare.2021.0025.
- Kabiraj, S., M. Jayanthi, S. Vijayakumar, and M. Duraisamy. 2022. “Comparative Assessment of Satellite Images Spectral Characteristics in Identifying the Different Levels of Soil Salinization Using Machine Learning Techniques in Google Earth Engine.” Earth Science Informatics 15 (4): 2275–2288. doi:10.1007/s12145-022-00866-9.
- Khan, N. M., and Y. Sato. 2001. “Environmental Land Degradation Assessment in Semi-Arid Indus Basin Area Using IRS-1B LISS-II Data.” IEEE 2001 International Geoscience and Remote Sensing Symposium 5: 2100–2102. doi:10.1109/igarss.2001.977916.
- Lai, N., X. G. Li, T. Asiyemu, and T. Gulikezai. 2014. “Dynamic Changes of the Salt-Affected Soil in the Oasis of the Lower Reaches of Kaidu River in the Recent 50 Year [In Chinese].” Remote Sensing Information 29 (3): 35–43. doi:10.3969/j.issn.1000-3177.2014.03.007.
- Li, Y. H., J. L. Ding, Y. M. Sun, G. Wang, and L. Wang. 2015. “Remote Sensing Monitoring Models of Soil Salinization Based on the Three Dimensional Feature Space of MSAVI-WI-SI [In Chinese].” Research of Soil and Water Conservation 22 (4): 113–117 +121. doi:10.1016/J.CATENA.2021.105304.
- Li, Y., C. Wang, A. Wright, H. Liu, H. Zhang, and Y. Zong. 2021. “Combination of GF-2 High Spatial Resolution Imagery and Land Surface Factors for Predicting Soil Salinity of Muddy Coasts.” Catena 202: 105304. doi:10.1016/j.catena.2021.105304.
- Liang, S. L. 2001. “Narrowband to broadband conversions of land surface albedo I: Algorithms.” Remote Sensing of Environment 76 (2): 213–238. doi:10.1016/S0034-4257(00)00205-4.
- Liu, X., G. Hu, Y. Chen, X. Li, X. Xu, S. Y. Li, F. S. Pei, and S. J. Wang. 2018. “High-Resolution Multi-Temporal Mapping of Global Urban Land Using Landsat Images Based on the Google Earth Engine Platform.” Remote Sensing of Environment 209: 227–239. doi:10.1016/j.rse.2018.02.055.
- Liu, B. W., M. S. Zhang, L. S. Chen, and J. L. Hou. 2012. “Causes of Soil Salinization in Hetao Irrigation Area of Inner Mongolia.” Western Resources 2012 (3): 172–173. doi:10.13522/j.cnki.ggps.20180221.
- Liu, J., L. Zhang, T. Dong, J. L. Wang, Y. M. Fan, H. Wu, Q. L. Geng, Q. J. Yang, and Z. Zhang. 2021. “The Applicability of Remote Sensing Models of Soil Salinization Based on Feature Space.” Sustainability 13 (24): 13711. doi:10.3390/su132413711.
- Lizarraga, E. A. 2007. “Soil Salinity Assessment Using Directed Soil Sampling from a Geophysical Survey with Electromagnetic Technology: A Case Study.” Spanish Journal of Agricultural Research 5 (1): 91–101. doi:10.5424/sjar/2007051-225.
- Lu, L., M. Qiao, S. B. Zhou, and J. J. Yan. 2011. “Analysis on Characteristics and Diver Forces of Soil Salinization in Weigan River Basin [In Chinese].” Research of Agricultural Modernization 32 (3): 357–361. doi:10.3969/j.issn.1000-0275.2011.03.024.
- Lu, J., X. J. Zhang, P. S. Ye, H. Wu, and T. Wang. 2020. “Remote Sensing Monitoring of Salinization in Hetao Irrigation District Based on SI-MSAVI Feature Space [In Chinese].” Remote Sensing for Land and Resources 32 (1): 169–175. doi:10.6046/gtzyyg.2020.01.23.
- Meng, X., X. Gao, S. Li, S. Y. Li, and J. Q. Lei. 2021. “Monitoring Desertification in Mongolia Based on Landsat Images and Google Earth Engine from 1990 to 2020.” Ecological Indicators 129: 107908. doi:10.1016/j.ecolind.2021.107908.
- Milione, G. M., C. R. Mujica, D. D. Daguer, S. A. Bea, M. E. Fernández, and J. E. Gyenge. 2020. “Influence of Soil Texture, Climate and Vegetation Cover on Secondary Soil Salinization in Pampas Plains, South America.” Cerne 2020 (26): 212–221. doi:10.1590/01047760202026022700.
- Muhetaer, N., I. Nurmemet, A. Abulaiti, S. Xiao, and J. Zhao. 2022. “A Quantifying Approach to Soil Salinity Based on a Radar Feature Space Model Using Alos Palsar-2 Data.” Remote Sensing 14 (2): 363. doi:10.3390/rs14020363.
- Nurmemet, I., A. Ghulam, T. Tiyip, R. Elkadiri, J. L. Ding, M. Maimaitiyiming, A. Abliz, et al. 2015. “Monitoring Soil Salinization in Keriya River Basin, Northwestern China Using Passive Reflective and Active Microwave Remote Sensing Data.” Remote Sensing 7 (7): 8803–8829. doi:10.3390/rs70708803.
- Oude Essink, G. H. P. 2001. “Salt Water Intrusion in a Three-Dimensional Groundwater System in the Netherlands: A Numerical Study.” Transport in Porous Media 43 (1): 137–158. doi:10.1023/A:1010625913251.
- Pei, J., Z. Niu, L. Wang, N. Huang, and J. H. Cao. 2018. “Monitoring to Variations of Vegetation Cover Using Long-Term Time Series Remote Sensing Data on the Google Earth Engine Cloud Platform [In Chinese].” Carsologica Sinica 37 (4): 608–616. doi: 10.11932/karst20180415.
- Qi, J., A. Chehbouni, A. R. Huete, Y. H. Kerr, and S. Sorooshian. 1994. “A Modified Soil Adjusted Vegetation Index.” Remote Sensing of Environment 48 (2): 119–126. doi:10.1016/0034-4257(94)90134-1.
- Rengasamy, P. 2006. “World Salinization with Emphasis on Australia.” Journal of Experimental Botany 57 (5): 1017–1023. doi:10.1093/jxb/erj108.
- Shandong Provincial Department of Agriculture and Rural Affairs. 2022. Shandong Province Saline-Alkali Land Ecological Fishery Development Plan (2022–2030) [In Chinese].” shandong.gov.cn, December 26. http://www.shandong.gov.cn/art/2022/12/26/art_307620_10330852.html?xxgkhide=1.
- Wang, F., J. L. Ding, and M. C. Wu. 2010. “Remote Sensing Monitoring Models of Soil Salinization Based on NDVI-SI Feature Space [In Chinese].” Transactions of the CSAE 26 (8): 168–173. doi:10.3969/j.issn.1002-6819.2010.08.029.
- Wang, H., and G. Jia. 2012. “Satellite-Based Monitoring of Decadal Soil Salinization and Climate Effects in a Semi-Arid Region of China.” Advances in Atmospheric Sciences 29 (5): 1089–1099. doi:10.1007/s00376-012-1150-8.
- Wang, J., and X. Y. Zhao. 2022. “China Has Promulgated the Yellow River Protection Law to Protect the Mother River [In Chinese].” people.com.cn, October 8. http://politics.people.com.cn/n1/2022/1030/c1001-32554915.html.
- Wu, W. C., C. Zucca, A. S. Muhaimeed, W. M. AI-Shafie, A. M. F. AI-Quraishi, V. Nangia, M. Q. Zhu, and G. P. Liu. 2018. “Soil Salinity Prediction and Mapping by Machine Learning Regression in Central Mesopotamia, Iraq.” Land Degradation & Development 29 (11): 4005–4014. doi:10.1002/ldr.3148.
- Yang, S. C., H. C. Pang, C. B. Wang, Y. Y. Li, L. Huo, and W. L. Jiang. 2014. “Characterization of Soil Salinization Based on Canonical Correspondence Analysis Method in Gansu Yellow River Irrigation District of Northwest China [In Chinese.].” Scientia Agricultura Sinica 47 (01): 100–110. doi:10.3864/j.issn.0578-1752.2014.01.011.
- Zhang, W. K. 2016. “Remote Sensing Monitoring Models of Soil Salinization in the Yellow River Delta Based on Feature Space.” Ph D Diss., China University of Petroleum (East China).
- Zhang, X. D., and Z. Liu. 2022. “Use Scientific and Technological Means to “Irrigate” New Hope on Saline-Alkali Land [In Chinese].” people.com.cn, February 23. http://nm.people.com.cn/n2/2022/0223/c196690-35145413.html.
- Zhang, X., L. G. Liu, X. D. Chen, S. Xie, and Y. Gao. 2019. “Fine Land-Cover Mapping in China Using Landsat Datacube and an Operational SPECLib-Based Approach.” Remote Sensing 11 (9): 1056. doi:10.3390/rs11091056.
- Zhang, Z. X., Y. T. Song, H. Z. Zhang, X. J. Li, and B. B. Niu. 2021. “Spatiotemporal Dynamics of Soil Salinity in the Yellow River Delta Under the Impacts of Hydrology and Climate [In Chinese].” Chinese Journal of Applied Ecology 32 (4): 1393–1405. doi:10.13287/j.1001-9332.202104.012.
- Zhang, T. Y., L. Wang, P. L. Zeng, T. Wang, Y. H. Geng, and H. Wang. 2016. “Soil Salinization in the Irrigated Area of the Manas River Basin Based on MSAVI-SI Feature Space [In Chinese].” Arid Zone Research 33 (3): 499–505. doi:10.13866/j.azr.2016.03.07.
- Zhang, Z. Z., J. X. Zhang, J. S. Huang, T. Zhang, D. Tang, K. N. He, and R. J. Li. 2018. “Efficacy of a Drainage System in Remediating Saline-Alkali Soils in the Alpine Region of Qinghai Province.” Journal of Irrigation and Drainage 37 (12): 78–85. doi:10.13522/j.cnki.ggps.2017.0582.
- Zhao, Q. Y., Y. Xia, and B. D. Zou. 2022. “Cause Damage and Recovery of Soil Salinization [In Chinese].” Agriculture and Technology 42 (11): 115–119. doi:10.19754/j.nyyjs.20220615030.