
 ?Mathematical formulae have been encoded as MathML and are displayed in this HTML version using MathJax in order to improve their display. Uncheck the box to turn MathJax off. This feature requires Javascript. Click on a formula to zoom.
ABSTRACT
Grassland is the second largest terrestrial ecosystem and a fundamental land resource for human survival and development. Although grassland degradation is a recognized and crucial ecological problem, there is no consensus on the area, scope, and degree of its global degradation trends, making the implementation of Sustainable Development Goals (SDG) 15.3 for achieving a land degradation-neutral world uncertain. This study quantitatively explored global grassland degradation trends from 2000 to 2020 by coupling vegetation growth and its response to climate change. Furthermore, the driving factors behind these trends were analyzed, especially in hotspots. Results show that the improvement in global grassland has been remarkable since 2000, with a 1.92 times larger area than degrading grassland, amounting to 372.47 × 10⁴ and 193.57 × 10⁴ km2, respectively. Africa and Asia lead in global grassland degradation and improvement, respectively. Globally, the combined effects of climate change and human activities are the main driving factors for grassland degradation and improvement, accounting for 84.72 and 87.76%, respectively. Notably, human activities played a crucial role in reversing the trend of grassland degradation in some hotspots. Finally, this study provides an essential scientific reference and support for realizing SDG 15.3 on global and regional scales.
1. Introduction
Grassland is the second largest terrestrial ecosystem, covering more than 40% of the global land area (Suttie, Reynolds, and Batello Citation2005). Grassland ecosystems are an essential livestock base and have various non-physical service functions, such as supporting biodiversity, regulating climate, and combating soil erosion (Mannetje Citation2007; Zhao, Liu, and Wu Citation2020). Notably, grassland is a crucial part of the global carbon pool and plays a vital role in the carbon cycle (Scurlock and Hall Citation1998; Ni Citation2002; Goldstein et al. Citation2020). Thus, grassland degradation not only leads to the deterioration of the ecological environment but also makes grassland animal husbandry more vulnerable and unstable (Bengtsson et al. Citation2019). Most countries, especially developing and least-developed countries, face serious grassland degradation challenges (Ivits and Cherlet Citation2013; Giuliani et al. Citation2020). The 17 Sustainable Development Goals (SDG) adopted by the United Nations (UN) in 2015 are an essential part of the 2030 agenda and aim to call for global action (UN Citation2015). To curb and reverse the current trend of land degradation, Goal 15.3 has as one of its main objectives a land degradation-neutral (LDN) world. Unfortunately, grassland degradation has become a significant threat to the achievement of this goal. Even more importantly, it is closely associated with no poverty (Goal 1), zero hunger (Goal 2), good health and well-being (Goal 3), and climate action (Goal 13) (O’Mara Citation2012; Markos, Sims, and Giuliani Citation2023). Grassland is the last barrier against desertification, and its unfavorable succession can dramatically increase the land degradation risk. Especially in recent decades, the risk of expanding the extent and degree of grassland degradation due to the frequency of extreme weather events caused by global climate change and the continuing increase in human activity intensity rose further (Meehl et al. Citation2000; Unger and Jongen Citation2015; Christian et al. Citation2021).
Several attempts have been made to assess global land degradation since the 1990s (Oldeman, Hakkeling, and Sombroek Citation1990; Bai et al. Citation2008; Scholes et al. Citation2018), and in recent years, an increasing number of scholars have carried out work related to degradation monitoring to respond to and support SDG15.3 (Tarantino, Adamo, and Blonda Citation2020; Xoxo et al. Citation2022). However, there is no target evaluation of grassland degradation, even though over 40% of the global grassland has been degraded due to particular ecological conditions and utilization (Gang et al. Citation2014; Gibbs and Salmon Citation2015). To date, the lack of consensus on scientific and comprehensive knowledge of the location, area, degree, and trends of grassland degradation has become an essential obstacle to curbing and reversing global degradation trends (Bardgett et al. Citation2021). Therefore, it is an essential and urgent mission to establish a standardized method to meet the demands of different interest groups for degradation control, which is moreover significant for sustainable grassland development (Reynolds et al. Citation2007; Sommer et al. Citation2011; Bardgett et al. Citation2021). This can provide reliable data support to formulate long-term sustainable development policies and results in assessment, help explain inter-annual variability in grassland ecosystems, and scientifically respond to global climate change (Poussin et al. Citation2021). In particular, with less than 10 years to achieve SDG 15.3, this is considered a critical first step.
Land cover and land cover change, land productivity, and carbon stocks have been widely applied to grassland degradation assessments as sub-indicators proposed by the UN for monitoring land degradation processes (Markos, Sims, and Giuliani Citation2023). The development of earth observation technology provides the opportunity for dynamic assessment of the range and state of grassland using the above indicators and improves the inefficiency in global observation and regional comparison arising due to the diversity and variation in grassland types, patterns, and levels of use, as well as degradation causes (Hill Citation2013; Schimel et al. Citation2015; Stavros et al. Citation2017). Although the land cover, land cover change, and carbon stocks are equally effective in evaluating land degradation (Tong et al. Citation2004; Baldi, Pablo Guerschman, and Paruelo Citation2006; Andrade et al. Citation2015), the productivity change has an irreplaceable advantage. Vegetation growth status changes are the most sensitive and direct response to land degradation, and productivity changes are their most notable manifestation. In rapidly providing long-time series and large-scale spatial information, the monitoring accuracy is higher for productivity indicators, and the monitoring results have less uncertainty. More importantly, productivity changes can explain the process of grassland degradation. Grassland productivity trends usually display the net effect of changes in ecosystem functioning (Cowie et al. Citation2018). A sustained decline in productivity often characterizes grassland degradation; conversely, a sustained increase is an essential expression of grassland improvement. Certainly, there are limitations in the productivity change in land degradation assessment related to the biomass trend cycles and coarse input data, but this is not insurmountable (Prince Citation2019). In this regard, remote sensing-based methods have been successfully employed to evaluate the process of grassland degradation. Time series change trends in vegetation indices, such as the normalized difference vegetation index (NDVI), enhanced vegetation index (EVI), and net primary production (NPP), can characterize grassland degradation evolution (Wiesmair et al. Citation2016; Zhou et al. Citation2017; Li, Yang, and Zhang Citation2021). The effectiveness of such indicators and change detection algorithms has been well established and demonstrated in various regional studies.
Most studies on grassland degradation are relatively fragmented in terms of research scope and subject. Previously published remote sensing-based degradation detection methods are limited to regional surveys, and the global applicability and sensitivity of these methods remain to be discussed. Furthermore, a single indicator often provides limited information and hardly reflects the full complexity of grassland degradation (Symeonakis et al. Citation2016; Gilbey et al. Citation2019; Cui and Li Citation2022). For example, only using NDVI or the indicators derived from it to evaluate degradation is highly susceptible to the influence of soil background values, making it complicated to accurately represent the actual situation (Yeganeh et al. Citation2014). Regarding the vegetation index, there has been no consensus on choice indicators and validity representing the decline in grassland productivity at different scales to date. A key issue is that the consistency and transferability of large-scale common indicators are crucial to quantitative monitoring and global evaluation of grassland degradation to avoid confusion when interpreting the results. For SDG 15.3.1, NPP has been defined as a measure of land productivity and trends used to evaluate land degradation progress. The main advantage is a clear physical meaning compared to other indices, and spatio-temporal changes can reflect the variations in vegetation production potential or capacity of grassland ecosystems in different periods (Running et al. Citation2004).
Although grassland degradation essentially involves the deterioration of the entire grassland ecosystem, vegetation change is one of the most critical degradation indicators (Tong et al. Citation2004). Long-term vegetation trends are more representative and better describe variations in grassland conditions than single-period or short-term data. However, grassland is highly vulnerable to climate change, especially precipitation and temperature, leading to highly variable grassland productivity between growth cycles and in the course of years (Foley et al. Citation2000; Gang et al. Citation2014). As a result, we often encounter productivity fluctuations in assessing grassland degradation dynamics. It is necessary to clarify whether these fluctuations involve genuine degradation or a normal response of vegetation growth to precipitation and temperature disturbances. Regrettably, relatively few studies have taken into account of the metrics of fluctuating phenomena, and researchers have yet to distinguish the impacts of climate change. In addition, it should be noted that the evaluation of grassland degradation often requires a benchmark. The absolute benchmark is difficult to achieve in the natural environment and may lead to under- or over-estimation of the degradation (Zheng et al. Citation2022).
Based on the latest Global LAnd Surface Satellite (GLASS)-NPP long-term series (2000–2020) as a proxy of grassland productivity, we analyzed the vegetation variation rules using the Sen + Mann Kendall (Sen + MK) trend detection method. This study assesses the effect of climate change on grassland productivity using moisture index (MI) response relationships. We aim to disentangle the phenomenon of productivity fluctuations that are confused with grassland degradation and explore global patterns of grassland degradation trends. Then, combined with grassland degradation and improvement characteristics, we use the NPP change rate to classify the global degradation trends into two categories and eight levels to assess the degree of grassland degradation and improvement. Furthermore, we quantify and distinguish driving factors between human activities and climate change to provide a complete understanding of the grassland degradation process. Our study provides data support for land degradation and control efforts, while contributing to SDG 15.3.
2. Data and methods
2.1. Data and processing
2.1.1. NPP data
The GLASS-NPP data from 2000–2020 were provided by Yuan et al. (Citation2010) and Zheng et al. (Citation2020). The data is derived from GLASS- gross primary production (GPP) combined with the respiration index based on the eddy covariance – light use efficiency (EC-LUE) model (www.glass.umd.edu/Download.html). The estimation process fully considers the influence of atmospheric CO2 concentration, solar radiation, temperature, atmospheric moisture deficit, and other factors on the estimation accuracy of NPP. The spatial resolution is 500 m, with an overall accuracy of approximately 75.6% (Xia et al. Citation2019).
2.1.2. Meteorological data
The ERA5 reanalysis dataset from European Center for Medium-Range Weather Forecasts (ECMWF, https://cds.climate.copernicus.eu/) provides the hourly temperature and precipitation data, with a period of 2000–2020 and a spatial resolution of 0.1°. To achieve the same spatial resolution, we resampled all data using the nearest neighbor method to 500 m and synthesized the monthly mean temperature and annual precipitation data.
2.1.3. Landcover data
Landcover data were obtained from the European Space Agency (ESA) Climate Change Initiative Land Cover (CCI-LC) maps (http://maps.elie.ucl.ac.be/CCI/viewer/). The CCI-LC project delivered consistent global LC maps at 300-m spatial resolution on an annual basis since 1992. We used the landcover data in 2015 and resampled it to 500-m spatial resolution by the nearest neighbor method to extract the grassland categories.
2.2. Climate characterization indicators
MI is an objective reflection of regional comprehensive hydrothermal conditions and a standard climatic division indicator. We used it to represent the wetness and determine the scope of climate regions, which is the ratio of annual precipitation (P) to annual mean potential evapotranspiration (PE):
(1)
(1) PE is the interaction between water and energy flows, estimated by the modified Thornthwaite method recommended by the United Nations Convention to Combat Desertification (UNCCD), based on monthly average temperatures as the core (Thornthwaite Citation1948; Willmott et al. Citation1985; Sun et al. Citation2015). The algorithm assumes that there are 30 days in a month and 12 h of sunshine per day, then divides the temperature into three segments: when the temperature is between 0 and 26.5 °C, the estimate of PE is closely related to temperature, heat, and latitude; when the temperature exceeds 26.5 °C, PE is a function of temperature alone; when the temperature is less than 0 °C, PE is zero. According to the classification standard recommended by UNCCD (UNCCD Citation2017), there are five types of climate regions: the hyper-arid region, arid region, semi-arid region, dry sub-humid region, and semi-humid and humid region (). shows the classification of global climate regions.
Figure 1. Distributions of Global Climate Regions.
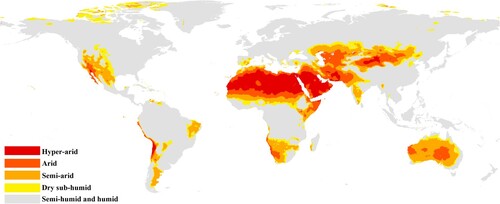
Table 1. Climatic regionalization indicators of desertification.
2.3. Identification method of global grassland degradation trends and degree
Grassland degradation is broadly defined as a decline in grassland condition, more specifically, a multifactorial-caused process that drives a persistent decline in grassland productivity (Bardgett et al. Citation2021). The identification process of grassland degradation and improvement consists of two steps. The first is the long-time series of grassland productivity trends quantitatively assessed based on NPP. Therefore, we used the Sen + MK statistical test method to analyze the variations in productivity. Compared with traditional parametric tests, the major advantage of the Sen + MK method is that this non-parametric statistical test method does not require samples to follow a specific distribution and is not disturbed by outliers (Gilbert Citation1987). It is more suitable to objectively characterize the overall trend for the long-time series in all distribution types. To assess for statistical significance of the trend and reduce the probability of grassland degradation and improvement being missed throughout the identification process, all tests were considered at a chosen level of significance α = 0.1. For the results involving significant downward changes, we define them as expanding and aggravating grassland degradation; conversely, the significant increase part demonstrates improvement and restoration of grassland. For the insignificant trends, degradation or improvement may still be found after excluding the influence of climatic factors. Subsequently, we accessed Pearson's correlation coefficient between the grassland productivity proxy and MI, and then investigated its putative response relationships with changes in climatic conditions to make a further judgment (Gao et al. Citation2016). If the significant changes in grassland productivity are a normal response to climate, it is considered that the grassland is in a relatively stable state over the period. Otherwise, there is observed degradation and improvement.
Based on the 10-year average rate of change in the NPP, we performed a pixel-by-pixel assessment of the global grassland degradation and improvement rate and divided the changing trend into two categories and eight levels ().
Table 2. Grading standard for assessment of global grassland degradation trends.
2.4. Driving factors analysis of global grassland degradation trends
We use an integrated analysis method based on multiple and partial regression to recognize the driving factors of grassland degradation and improvement. Here, we divided the factors into combined effects, climate change, and human activities. Combined effects refer to the fact that climate change and human activities jointly influence grassland degradation and improvement processes. In contrast, climate change and human activities represent the single effects of two factors in the process of grassland variation, respectively. At the pixel level, MI quantitatively expresses the effect of climate change, and the partial correlation coefficient between NPP and time represents human activities (Sun et al. Citation2017). Although the correlation between MI and time can interfere with the judgment of the overall significance of multiple regression, Del Barrio et al. (Citation2010) solved this problem. The statistic Fs is calculated as follows:
(2)
(2) where R2NPP_1, 2 is the coefficient of determination of the multiple regression equation between NPP and the two dependent variables of time (t) and MI, rNPP_2 is the smaller correlation coefficient in the simple correlation analysis between the two independent variables and NPP, and n is the number of samples.
The partial correlation coefficient r12.3 of NPP with MI and time (t) is given as:
(3)
(3) where r12, r23, and r13 represent the correlation coefficients between the variables Y and X1, Y and X2, and X1 and X2, respectively.
The test statistic t is calculated as follows:
(4)
(4) where n is the number of samples, and k is the number of controllable variables.
At a chosen significance level α = 0.1, both statistical tests of the multiple regression are significant, indicating that the change of grassland degradation is affected by combined effects. In addition, if the results of the partial correlation test were significant, the trends are influenced by climate change or human activities alone.
3. Results and analysis
3.1. Spatial distribution of global grassland degradation and improvement
depicts global grassland degradation and improvement dynamics and spatial distribution from 2000 to 2020. The world's 193.57 × 10⁴ km2 of grassland has been undergoing a degrading process since 2000. The top three degraded continents are Africa (39.35%), Asia (19.58%), and South America (18.65%), followed by Oceania (9.34%), North America (8.41%), and Europe (4.66%) (). It is apparent from the figure that grassland degradation occurs primarily in tropical savanna regions, mainly in Africa, South America, and Oceania. Among these, eastern and southern Africa, Madagascar, and areas around the Congo Basin are the most concentrated regions of savanna degradation. Later, savanna degradation was also additionally pronounced in the Llanos grassland of northern South America, the Cerrado Reserve in the central-eastern Brazilian Plateau, and the middle Andes, and finally also in western Australia in Oceania. No significant degradation in temperate grassland was found compared with the tropical savanna. The Veldt steppe in southern Africa and the Black Sea-Kazakhstan sub-region of the Eurasian steppe is the more representative temperate steppe degradation region worldwide. Other famous grasslands are in a stable state of sporadic degradation, such as the Pampas and the Eurasian steppe in South Asia. In addition, degradation is evident in the high-latitude tundra areas of northern Hudson Bay in North America.
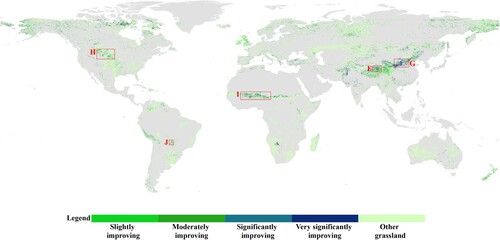
Figure 2. Distribution of global grassland degrading and improving areas from 2000–2020.
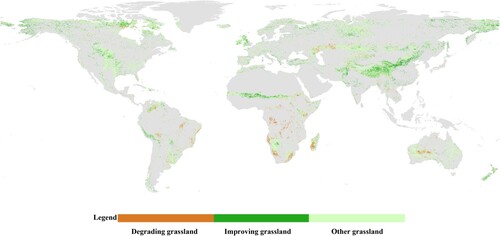
Figure 3. Degrading and improving areas of global grassland in different continents.
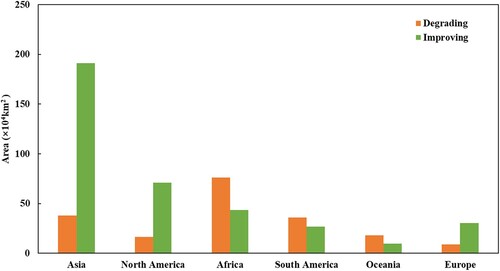
Since 2000, 372.47 × 10⁴ km2 of grassland has shown improvement, which amounts to 1.92 times the area of degraded grassland. Notably, Asia leads the global grassland improvement, accounting for more than half (51.34%) of the total global improvement area, followed by North America (19.05%), Africa (11.7%), Europe (8.11%), South America (7.22%), and Oceania (2.57%). Spatially, compared with the tropical savanna, the improvement of temperate grassland is more attractive. In particular, nearly 60% of improvement occurs in the Eurasian steppes, especially in the Central Asian steppe sub-region, the Qinghai-Tibet Plateau steppe sub-region, and South Asia, where improved grassland is concentrated and contiguous. Similarly, the improvement in the Americas is best represented by the Prairies in North America and the Central Andean Puna Ecoregion in South America. In contrast, the temperate grassland of Oceania is relatively stable, with only parts of New Zealand in an improvement process. Surprisingly, the Sahel, particularly in west Africa, represents a highlight of savanna improvement as well as in southern Africa, near the Kalahari Basin in Namibia. Likewise, savanna improvement is concentrated on the Llanos grassland and the northern La Plata plains in South America. In addition, grassland improvement is also relatively evident in the high latitudes of eastern Siberia, the tundra above 60° N, and parts of northern Europe.
Among the different climatic regions, grassland degradation is most significant in the semi-humid and humid regions, which account for more than 60% of the total area of grassland degradation (). Approximately 10% of grassland within the global desertification potential extent is in a continuous degrading process, covering 74.26 × 10⁴ km2, with more than half in semi-arid regions, and 23.41 and 20.27% in arid and dry sub-humid regions, respectively. Similarly, grassland improvement is widespread in semi-humid and humid regions, where 21.18% of grassland is an improving process, a proportion nearly twice as high as that of degraded grassland (). Nearly 15% of the grassland in the global desertification potential extent is in an improved state, covering 114.45 × 10⁴ km2, with 40.92% in the semi-arid regions and a similar area in the arid and dry sub-humid regions.
Table 3. Statistics on the global grassland degrading areas in different climatic regions across continents (104km2).
Table 4. Statistics on the global grassland improving areas in different climatic regions across continents (104km2).
3.2. Degree of global grassland degradation and improvement
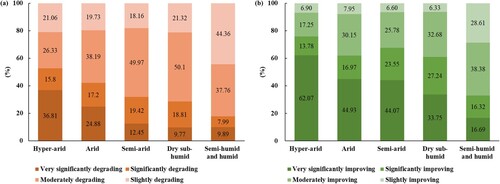
In this section, we graded the identified global grassland degradation and improvement using the classification criteria in Section 2.3. and show the results of spatial distribution on different degrees. Degraded grassland is predominantly moderately and slightly degraded, accounting for over 75% of the total degraded grassland area. Very significant and significant degrading of areas occurred in 11.81 and 12.14% of the cases, respectively. In comparison, the proportion of four degrees in improved grassland is relatively balanced. The most considerable is moderately improving, accounting for 35.49% of the total improved area. It is followed by very significantly, slightly, and significantly improving processes, with 24.35, 21.92, and 18.24% proportions, respectively. By the construct, the variation intensity is higher in the improving than in degrading grassland.
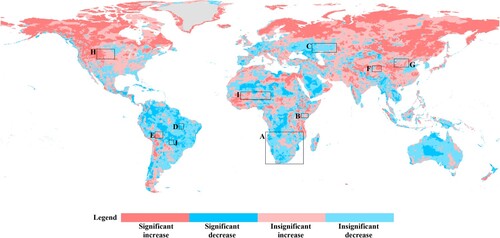
Figure 4. Distribution of global grassland degrading areas in different degrees from 2000–2020 and hotspots locations: Southern Africa (region A); East African Plateau (region B); Northern Caspian Sea in Asia (region C); Eastern Brazilian plateau (region D); Northern Bolivia (region E).
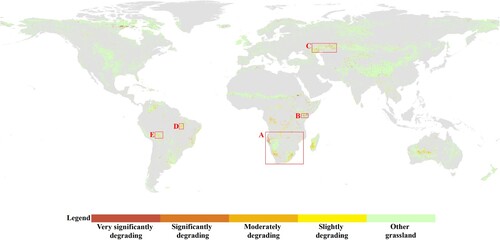
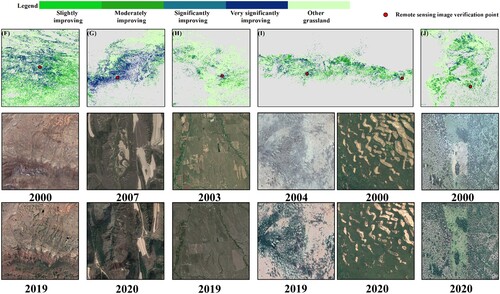
Figure 5. Distribution of global grassland improving areas in different degrees from 2000–2020 and hotspots locations: Qinghai-Tibet Plateau in China (region F); Loess Plateau (region G); Central North America (region H); Western Sahel in Africa (region I); Northern La Plata (region J).
In terms of these phenomena, we analyze global and regional characteristics in greater detail in the degree from a continental perspective, as there is no clear spatial pattern across the globe. provides statistics on the area of each continent with different degrees of grassland degradation and improvement. and show the different degrees of degradation and improvement of global grassland in different hotspots, respectively, and comparative remote sensing images of random points in different periods. Accordingly, Asia exhibits the most extensive grassland area and the most apparent improvement. Since 2000, 5.21% of grassland has been degrading, and 26.31% is improving. Nearly half of the improving processes are slight and moderate. Notably, this accounts for 59.01 and 55.14% of the world's very significantly and significantly improving grassland areas. The Central Asian steppe sub-region, especially the Loess Plateau and surrounding areas, and the Inner Mongolia Plateau are mainly very significant and significant improving processes. The Qinghai-Tibet Plateau steppe sub-region exhibits a mosaic distribution of different degrees; the improvement of the eastern part is predominantly slight and moderate, while the center is very significant and significant. Furthermore, the Afghanistan–Pakistan border exhibits a very significant and significant improving grassland, and the Siberian Plateau exhibits slightly and moderately improving processes in the mosaic pattern. Turning to the degraded degree, slightly or moderately degrading grassland accounts for more than 60%, followed by very significantly degrading accounts at 22.93%. The Black Sea-Kazakhstan sub-region of the Eurasian steppe, especially in the grazing steppe located in the northern part of the Caspian Sea, is severely degraded.
Figure 6. Global grassland degrading (a) and improving (b) to different degrees on each continent.
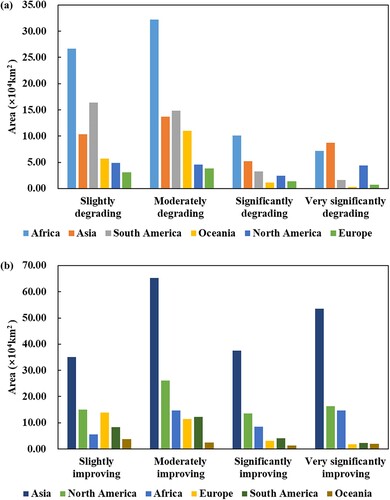
Figure 7. Global grassland degrading in different degrees across hotspots and remote sensing comparative images of random points in different periods.
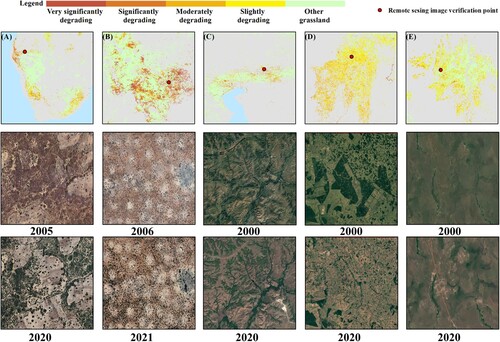
Figure 8. Global grassland improving in different degrees across hotspots and remote sensing comparative images of random points in different periods.
Africa has the most representative tropical savanna, and its degradation ranks first in the world, with 21.48% of grassland continuously degrading and 12.29% improving. The order of the four different degradation degrees is very significant (9.40%), significant (12.26%), moderate (42.3%), and slight (35.04%). Remarkably, eastern Africa, especially in Kenya and Sudan, is dominated by very significant and significant degrading. Similar occurrences are also found in southwestern Angola and northwestern Namibia in southern Africa. In addition, Madagascar, areas around the Congo Basin, and the Veldt steppe are moderately and slightly degrading. The most extensive areas of improving grassland are moderate (33.8%), then very significant and significant, accounting for 53.33%, and slight accounting for 12.87%. In the Sahel, grassland improvement shows an even distribution pattern across different degrees, particularly relative concentrations of very significant and significant improving processes in west Africa. Similarly, these have led the improvement of grassland Namibia.
The Americas (North and South America) hold nearly 30% of the world's grassland resources. North America has a very high level of modernization in grassland management. It has 4.36 times more improving grassland than degrading, at 17.97% and 4.12%, respectively. Moderately improving grassland (36.78%) accounts for the highest proportion, with the remaining three degrees accounting for approximately 20%. The Prairie grassland is dominated by slightly and moderately improving processes in the south, with a mosaic pattern in the center and some areas of very significant and significant improvements in contiguous patches. In South America, there is little difference between the areas with grassland degradation (17.64%) and improvement (13.15%). Grassland in South America is slightly (45.39%) and moderately (41.12%) degrading, and the degree of improvement follows the same trends of 30.73% and 45.6%, respectively. The different degrees of trends are evenly distributed across several essential grasslands. Moreover, the degraded grassland area in Oceania is nearly twice as large as the improved area, but the degree of both trends is less severe. European grassland improved remarkably (19.64%), mainly slightly and moderately, with 10.75% subjected to non-severe and scattered degradation.
In different climatic regions, the proportion of very significantly and significantly degrading areas in hyper-arid, arid, semi-arid, dry sub-humid, semi-humid and humid regions to the total grassland area in each region was 52.62, 42.08, 31.87, 28.58, and 17.88%, respectively. These regions’ very significant and significant improving processes proportions were 75.85, 61.9, 67.62, 60.99, and 33.01%, respectively. The most striking observation to emerge from the data comparison was that the greater the deterioration of the supply of hydrothermal resources, the more sensitive the grassland condition, and the higher the high-intensity degradation rate. One possible implication is that these findings must be cautiously approached, because the world is still at risk of land degradation, especially in the extent of potential global desertification. shows the statistics for the different climatic regions.
Figure 9. Global grassland degrading (a) and improving (b) proportion to different degrees in different climatic regions.
3.3. Driving factors of global grassland degradation and improvement
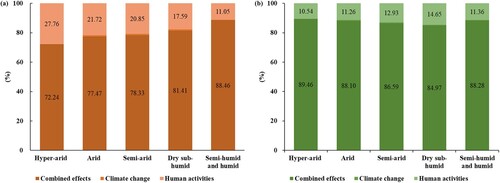
We explored the driving factors of global grassland degradation () and improvement (). The analysis of the complete and partial correlations between NPP, MI, and time shows that the combined effects of climate change and human activities lead to the most grassland-degrading processes (); the proportion is as high as 84.72%. Followingly, 14.65% of human activities drive grassland degradation. The combined effects of improving processes are similar to degrading, inducing 87.76% of the global grassland improvement area. The human activities affected resulted in 11.83%. Climate change affects less than 1% of the areas, whether grassland degradation or improvement.
Figure 10. Distribution of global grassland degrading driving factors.
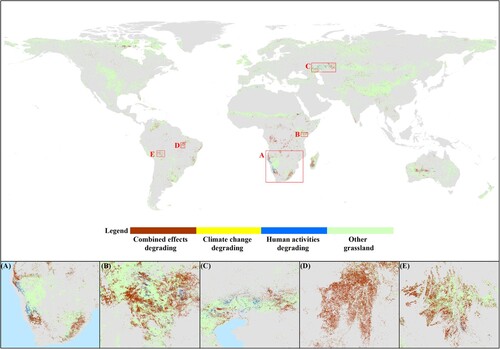
Figure 11. Distribution of global grassland improving driving factors.
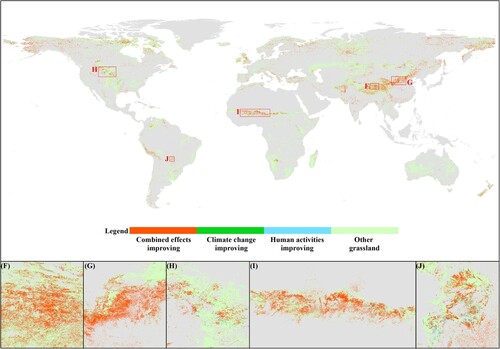
Table 5. Statistics on the global grassland degrading and improving driving factors areas and proportion.
The same spatial distribution pattern of driving factors has been observed in the representative regions mentioned earlier regarding grassland degradation and improvement. The combined effects hold absolute dominance, with human activities and climatic change scattered among them, and the three factors forming a mosaic. Notably, in the northern Caspian Sea and Namibia, particularly in those regions of moderate and significant degrading processes, there are few global concentrations of human activities driven degradation. Furthermore, we did not observe a significant correlation between the degree of trends in grassland degradation and the driving factors.
For different climate regions, the combined effects have the highest proportion of degradation or improvement, followed by human activities and climate change. As wetting conditions improve in different climatic regions, degradation due to single human activities gradually decreases, and the proportion of improvement generally increases. As far as degradation is concerned, a probable explanation is that these variations result from the environment being progressively less resistant to disturbance. Low levels of disturbance resistance often accompany fragile ecologies, and minor human activities can severely affect grassland degradation. In contrast, reversing the crisis of grassland degradation requires more intense anthropogenic measures. shows the proportion of the three factors driving degradation and improvement within different climate regions.
Figure 12. Global grassland degrading (a) and improving (b) proportion of driving factors in different climatic regions.
3.4. Further analysis of the driving factors of grassland degradation and improvement in hotspots
The previous section analyzed causes of grassland degradation and improvement globally and argued that combined effects dominate the change in grassland degradation. This section discusses the hotspots’ different response pattern characteristics.
Before explaining these response patterns, it is necessary to conduct a Sen + MK trend analysis of global MI from 2000 to 2020 (), as it will assist us in evaluating the dry and wet trends in the climate of grassland degradation and improvement regions to explain the reasons for the changes in grassland status. In general, a sustained increase in MI indicates a trend of humidification of the regional climate; conversely, a sustained decrease is a symptom of the aridification of the climate. The correlation between the trend in MI and grassland degradation trends is intriguing. In most degrading regions, MI consistently exhibits a decreasing trend (e.g. regions A, C, D), albeit there are a few regions with an increasing trend (e.g. regions B and E). Similarly, the phenomenon was observed in improving areas. Here, the trends to be a clear upward in MI (e.g. regions F, G, H, and I), and again there are exceptional cases (region J). Although the upward or downward trend in MI is insignificant in some areas, these imperceptible changes are still noteworthy.
Figure 13. Distribution of global grassland degrading and improving MI trends in hotspots.
To observe the response patterns of NPP and precipitation, and show the average NPP and precipitation values from 2000–2020 for each hotspot of grassland degradation and improvement, respectively. The response relationships between these two indicators may be divided into three main types. In the first, the trend of NPP and precipitation is the same, and the fluctuation of NPP was mainly controlled by precipitation. Regions A and C are good illustrations of this model. Despite interannual changes in rainfall, NPP and precipitation both exhibit a decreasing trend. As of 2018, region A’s NPP decline rate is approximately 16%. It then grew with the apparent increase in precipitation. In region C, the climate is relatively dry, with an average annual precipitation of only about 280 mm. Since 2000, the precipitation has generally shown a trend of first decreasing and then increasing, especially after 2014, when it has risen significantly. NPP also showed a trend of decrease followed by increase during the same period. Similarly, regions F and H are other examples of what the first model means, where NPP and precipitation show an increasing trend. In region F, the annual average NPP is only 74.19 g C/m2. Since 2000, the phenomenal growth of NPP can be observed in (a), from 59.9–94.82 g C/m2, increased by 58.29%. Although with some fluctuations, precipitation has increased yearly, especially sharply after 2015. The change in NPP is consistent with precipitation over the same period. Likewise, the two indicators in region H fluctuate widely, showing an insignificant upward trend. The average annual NPP was 303.28 g C/m2 at the highest and only 195.09 g C/m2 at the lowest. Precipitation ranged from 708 to 273 mm.
Figure 14. Precipitation and NPP variations in degrading grassland hotspots.
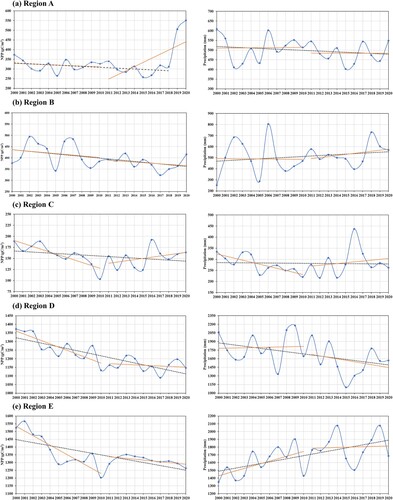
Figure 15. Precipitation and NPP variations in improving grassland hotspots.
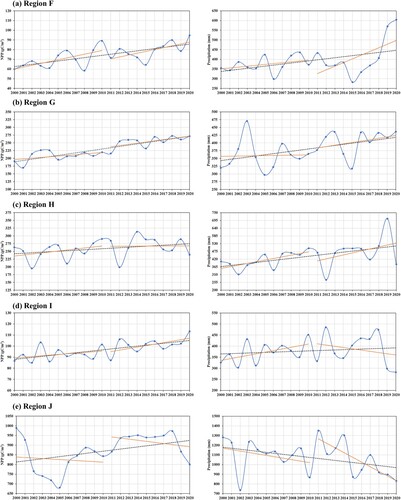
In the second model, the overall trends of NPP and precipitation are consistent, but the segmental interannual variability or the degree of variation is not identical. For example, in region D, NPP decreased by 16.41%. The precipitation is rich, but fluctuates and shows an apparent downward trend. With the change in precipitation, NPP likewise showed a fluctuating state. Interestingly, the precipitation increased yearly after 2015, while the NPP did not precisely follow. This result is somewhat counterintuitive. Likewise, NPP has continued to rise by nearly 30% in the region I. Precipitation is also fluctuating, with smaller increases. Surprisingly, the precipitation decreased significantly after 2018, but NPP increased yearly. Additionally, region G is a relatively unique illustration of the second model. The rise of NPP is pronounced, from 190.94–271.92 g C/m2, an increase of nearly 43%. However, compared to the NPP, precipitation rises are minor. Significantly, the precipitation decreased severely in 2014, and the change in grassland NPP was not evident.
In the third model, the trends in NPP and precipitation are precisely opposite. Region B illustrates this point clearly. Here, the precipitation fluctuates wildly, with its highest at 800 mm and only about 250 mm at the lowest, while generally showing an upward trend. However, the NPP continued to decline in the same period by about 10%. Especially after 2010, the NPP did not increase with the growth in precipitation, still showing a downward trend. Region E is another good illustration. The precipitation increases significantly, from the initial 1349 mm to the highest 2077 mm. However, grassland NPP continued to decline by about 17%. Especially before 2010, we found dramatic differences in the trend between NPP and precipitation, while the precipitation increased yearly, but NPP declined at a great rate. This unusual phenomenon also occurred in the grassland improvement in region J. Although the precipitation fluctuated substantially, it generally exhibited a downward trend, especially after 2015, and the precipitation level was significantly lower than before. Nevertheless, the NPP rose to a high point after 2012 and stabilized at around 950 g C/m2. It was insignificantly affected by precipitation fluctuations.
4. Discussion
4.1. Mapping global grassland degradation and improvement
In the background of SDG 15.3, accurate measurement and monitoring of grassland degradation trends are essential for achieving LDN. Here, we map the status of grassland degradation and the dynamics of degrading and improving processes globally and over a long time series. Our study directly utilizes grassland productivity and couples the change with the climate indicator to eliminate the vegetation’s usual response to the hydrothermal conditions variation. This is building on a similar approach to detect grassland degradation using changes in land productivity proposed by the UN, which helped us complete a quantitative assessment of global grassland degradation trends. It is necessary to emphasize the importance of indicator selection to support the SDG 15.3 land degradation assessment, particularly the biomass of unique ecosystems in grassland (Ali et al. Citation2016; Tiscornia, Jaurena, and Baethgen Citation2019). There are certain problems with only using the NPP to estimate the status of grassland degradation and improvement (Vogt et al. Citation2011; Higginbottom and Symeonakis Citation2014). In this study, an integrated assessment approach is closely related to vegetation growth, reflecting that the response to climate variation reveals a broader perspective of grassland degradation and can complement the disadvantages. Compared to most previous studies, our combined grassland productivity and climate change to determine grassland degradation takes into account the limitations of using a single indicator, and makes some contribution to the elimination of climate impact. Additionally, the two indicators are relatively few within the complex framework of the integrated land degradation assessment, but can explain the truth. They verified the global uniformity of the multiple indicator comprehensive model and satisfied the global and regional comparability of the SDG 15.3 evaluation.
Most studies on grassland degradation have treated insignificant trends in grassland productivity as usual interannual fluctuations, ignoring their impact on judgments of long-term trends in grassland degradation (Li, Yang, and Zhang Citation2021). The parts with significant variations are determined as the category of grassland degradation according to the definition. In contrast, for the insignificant variations, only considering the significance will be affected by precipitation fluctuations and individual data errors of time series. Consequently, it is highly probable that a misinterpretation occurs in accurately identifying global grassland degradation trends. This study used the correlation between the vegetation productivity proxy and MI as an auxiliary judgment to distinguish whether the fluctuations are caused by the land change or a normal response to climate. Even more importantly, we explain the state of grassland degradation in the insignificantly changing part and provide a more reasonable description of the dynamics of grassland degradation.
Our selected indicators and methodology may still have specific limitations in some cases. Climate change is an essential factor affecting vegetation growth variation. The response caused by a normal physiological reaction of grassland under environmental variation, especially precipitation, may mislead the degradation evaluation process. The relationship between vegetation growth and climate change is more complex than we witnessed. The significant correlation is only a simplified expression of the relationship that does not rule out the influence of other factors (Parton et al. Citation1995; Craine et al. Citation2012; Chen et al. Citation2019). Therefore, another possible area of future research would be to focus more on the expression of response relationship. In addition, the time series we study are relatively short, such that the patterns of change at different periods are not captured. With a more extended sample, caution must be applied, as the findings might alternate periods of degradation and improvement over longer time lengths. The exact process is accompanied by changes in land productivity and perhaps even frequent vegetation succession (Verdoodt and Van Ranst Citation2006). Long-term studies such as these do not necessarily show subtle changes over time. Hence, time windows could be a central factor affecting trend estimates, and capturing such transient processes is challenging. Finally, the complex processes of grassland degradation and improvement due to land cover type conversion will be considered in the future.
4.2. Irregular processes of global grassland degradation driven by climate change and human activities
Our statistics show that the combined effects of climate change and human activities play a dominant role in grassland degradation and improvement processes; then human activities drive variation, whereas climate change accounts for less than 1%. Although global climate change, especially changes in temperature and precipitation, has led to varying degrees of increase and decrease in MI at the global level, such changes are not significant enough to show a fluctuating trend overall. Therefore, it is reasonable to explain that the proportion of regions individually affected by climate change is tiny. Three types of response relationships between grassland productivity and precipitation summarized in hotspots may support the hypothesis that the mechanisms contributing to different factors in grassland degradation trends are incredibly complex (Zhou et al. Citation2017). The emergence of mosaic patterns displays the interaction of climate change and human activities in the degradation and improvement of grassland. Even though there is no clear pattern of climate change and human activities that influence grassland degradation trends at the global scale, they often play different and crucial roles at the regional scale (Li, Yang, and Zhang Citation2021). The widespread decline in MI on degrading grassland shows a trend towards aridification of the regional climate. This adverse change will make grassland ecosystems vulnerable and significantly increase the risk of grassland degradation (Xu, Wang, and Zhang Citation2016). In contrast, humidification tends towards an improvement in grassland conditions. Southern Africa and the eastern Brazilian Plateau, where year-round high temperatures and distinct wet and dry seasons are typical examples, exhibit widespread warming and changes in precipitation patterns dominating large-scale grassland degradation across them (Hoffmann and Jackson Citation2000). Similarly, rising precipitation has driven the improving processes in the Qinghai-Tibetan Plateau hinterland, and these patterns have been observed in the Prairie and Sahel (Hickler et al. Citation2005; Qian, Fu, and Pan Citation2010).
Human activities and other factors were also found to play a crucial role in grassland degradation and improvement when the regional climate is relatively stable. For example, the northern Caspian Sea, which is dry and rainy all year round, represents one of the few areas of human activities-driven (27.94%) steppe degradations. The relatively stable precipitation since 2000 suggests that the degrading process occurring there has little connection with climate change. As a globally crucial food-producing area, the observed exacerbation in grassland degradation could be attributed to human activities such as expanding agricultural land and irrational land management (Foley Citation2005; Chen et al. Citation2019). Another example is the Loess Plateau, one of the most severely eroded and ecologically fragile areas worldwide, but with a remarkable improvement process in grassland since 2000 (Zhao et al. Citation2013). The increase in precipitation during the study period is arguably negligible compared to the improvement in vegetation productivity. Therefore, it can be presumed that the apparent improvement of grassland is likely related to human activities. The Chinese ecological restoration programs, such as the return of pasture to grassland and the return of grain plots to forestry, have produced noteworthy results in the region and profoundly impacted the structure and function of grassland ecosystems (Akiyama and Kawamura Citation2007; Liu et al. Citation2008). At the same time, relevant laws and policies have progressed in protecting healthy grassland and restoring degraded grassland. These results further confirm the suspicions that human activities played a crucial role in the grassland-improving process. In addition, we found areas (regions B, E, and J) with grassland degradation trends opposite to wet and dry climate changes or precipitation trends that were equally representative. These unusual variations could also demonstrate the importance of human activities in changing the condition of grassland vegetation. This could even reverse the trend of grassland degradation or improvement.
4.3. Implications in grassland degradation trends studies and future opportunities
Our approach is pixel-based, allowing aggregation at different study scales. Additionally, such indicators and methods show the potential for quantitatively identifying large-scale grassland degradation features on a global scale. The current study found that the area of grassland in the improving process is considerably larger than degrading grassland, which indicates a noticeable improvement trend and is highly encouraging. Despite these promising results, questions remain. Grassland degrading and improving processes occur globally in parallel, meaning the land degradation crisis still exists. In general, there is some inconsistency in detail portrayed between different scales of grassland degradation trends, but similar spatial patterns can be observed. While comparing grassland degradation in different countries and regions, analyzing hotspots has helped us identify priorities for addressing this grassland degradation crisis. Therefore, in future work, we recommend degradation hotspots as a focus for the governance of grassland degradation, as well as summary of the experiences of grassland improvement hotspots to better serve the demands of degraded grassland control.
From grassland degradation to SDG 15.3, future research will need to test such methods and assessment systems in different contexts. Although our approach may still be challenging in numerous ways, we hope that it will provide a novel perspective for future research to curb grassland degradation and improve grassland conditions. With the development of remote sensing technology and the in-depth study of grassland degradation, future investigations might use more indicators reflecting the characteristics and ecological service functions of different study regions in the evaluation system. This way, different data users and policymakers can accurately assess the regional grassland degradation status and provide more robust scientific and technological support for realizing SDG 15.3. Finally, from an application point of view, it must be extended to different ecosystems globally rather than just grassland. This study allows for better integration of land degradation into global environmental change monitoring for ecosystem service and global carbon cycle assessments, providing a holistic perspective of the management of land degradation in response to SDG 15.3.
5. Conclusion
Grassland degradation and improvement processes occur in parallel in different regions worldwide, showing a noticeable improvement trend with the total area of improved grassland being 1.92 times larger than that of degraded grassland. From a different perspective, the semi-humid and humid regions are ranked first in terms of two trends accompanied by the slightest degree. Africa and Asia lead in the global grassland degradation and improvement, respectively. Nevertheless, the global land degradation crisis remains a serious challenge to the achievement of LDN.
The combined effects of climate change and human activities play a dominant role in grassland degradation and improvement processes, accounting for 84.72 and 87.76%, respectively. Although the impact of human activities as an external driving factor is not remarkable globally, it has played a crucial role in some regions and even reversed the grassland degradation trend. Practical policy guidance combined with active and scientific governance actions can increase vegetation cover and improve degraded grassland on a large scale. However, extensive cultivation and unreasonable land management practices increase the risk of aggravating grassland degradation during the same period.
A key policy priority must be to plan for the long-term care of grassland degradation hotspots. This information can be used to develop targeted interventions to improve degraded grassland. Moreover, more successful experiences of grassland degradation management from a specific improvement area must be made available to further address the land degradation crisis.
Finally, despite its limitations, this study is an essential step towards documenting grassland degradation at the global and regional scales and contributes to our understanding of the response of grassland degradation trends to climate change for the overall global advancement of SDG 15.3 towards achieving a land degradation-neutral world.
Disclosure statement
No potential conflict of interest was reported by the author(s).
Data availability statement
The data that support the findings of this study are available from the corresponding author, [Bin Sun], upon reasonable request.
Additional information
Funding
References
- Akiyama, Tsuyoshi, and Kensuke Kawamura. 2007. “Grassland Degradation in China: Methods of Monitoring, Management and Restoration.” Grassland Science 53 (1): 1–17. doi:10.1111/j.1744-697X.2007.00073.x.
- Ali, Iftikhar, Fiona Cawkwell, Edward Dwyer, Brian Barrett, and Stuart Green. 2016. “Satellite Remote Sensing of Grasslands: From Observation to Management.” Journal of Plant Ecology 9 (6): 649–671. doi:10.1093/jpe/rtw005.
- Andrade, Bianca O., Christiane Koch, Ilsi I. Boldrini, Eduardo Vélez-Martin, Heinrich Hasenack, Julia-Maria Hermann, Johannes Kollmann, Valério D. Pillar, and Gerhard E. Overbeck. 2015. “Grassland Degradation and Restoration: A Conceptual Framework of Stages and Thresholds Illustrated by Southern Brazilian Grasslands.” Natureza & Conservação 13 (2): 95–104. doi:10.1016/j.ncon.2015.08.002.
- Bai, Z. G., D. L. Dent, L. Olsson, and M. E. Schaepman. 2008. “Proxy Global Assessment of Land Degradation.” Soil Use and Management 24 (3): 223–234. doi:10.1111/j.1475-2743.2008.00169.x.
- Baldi, Germán, Juan Pablo Guerschman, and José María Paruelo. 2006. “Characterizing Fragmentation in Temperate South America Grasslands.” Agriculture, Ecosystems & Environment 116 (3-4): 197–208. doi:10.1016/j.agee.2006.02.009.
- Bardgett, Richard D., James M. Bullock, Sandra Lavorel, Peter Manning, Urs Schaffner, Nicholas Ostle, Mathilde Chomel, et al. 2021. “Combatting Global Grassland Degradation.” Nature Reviews Earth & Environment 2 (10): 720–735. doi:10.1038/s43017-021-00207-2.
- Bengtsson, J., J. M. Bullock, B. Egoh, C. Everson, T. Everson, T. O’Connor, P. J. O’Farrell, H. G. Smith, and Regina Lindborg. 2019. “Grasslands-more Important for Ecosystem Services Than you Might Think.” Ecosphere (washington, D C) 10 (2): e02582. doi:10.1002/ecs2.2582.
- Chen, Tao, Anming Bao, Guli Jiapaer, Hao Guo, Guoxiong Zheng, Liangliang Jiang, Cun Chang, and Latipa Tuerhanjiang. 2019. “Disentangling the Relative Impacts of Climate Change and Human Activities on Arid and Semiarid Grasslands in Central Asia During 1982–2015.” Science of the Total Environment 653: 1311–1325. doi:10.1016/j.scitotenv.2018.11.058.
- Christian, Jordan I, Jeffrey B Basara, Eric D Hunt, Jason A Otkin, Jason C Furtado, Vimal Mishra, Xiangming Xiao, and Robb M Randall. 2021. “Anomalous Collapses of Nares Strait ice Arches Leads to Enhanced Export of Arctic sea ice.” Nature Communications 12 (1): 1–11. doi:10.1038/s41467-020-20314-w.
- Cowie, Annette L, Barron J Orr, Victor M Castillo Sanchez, Pamela Chasek, Neville D Crossman, Alexander Erlewein, Geertrui Louwagie, Martine Maron, Graciela I Metternicht, and Sara Minelli. 2018. “Land in Balance: The Scientific Conceptual Framework for Land Degradation Neutrality.” Environmental Science & Policy 79: 25–35. doi:10.1016/j.envsci.2017.10.011.
- Craine, Joseph M, Jesse B Nippert, Andrew J Elmore, Adam M Skibbe, Stacy L Hutchinson, and Nathaniel A Brunsell. 2012. “Timing of Climate Variability and Grassland Productivity.” Proceedings of the National Academy of Sciences 109 (9): 3401–3405. doi:10.1073/pnas.1118438109.
- Cui, Yuran, and Xiaosong Li. 2022. “A new Global Land Productivity Dynamic Product Based on the Consistency of Various Vegetation Biophysical Indicators.” Big Earth Data 6 (1): 36–53. doi:10.1080/20964471.2021.2018789.
- Del Barrio, Gabriel, Juan Puigdefabregas, Maria E Sanjuan, Marion Stellmes, and Alberto Ruiz. 2010. “Assessment and Monitoring of Land Condition in the Iberian Peninsula, 1989–2000.” Remote Sensing of Environment 114 (8): 1817–1832. doi:10.1016/j.rse.2010.03.009.
- Foley, A. J. 2005. “Global Consequences of Land Use.” Science 309 (5734): 570–574. doi:10.1126/science.1111772.
- Foley, Jonathan A, Samuel Levis, Marcos Heil Costa, Wolfgang Cramer, and David Pollard. 2000. “Incorporating Dynamic Vegetation Cover Within Global Climate Models.” Ecological Applications 10 (6): 1620–1632. doi:10.1890/1051-0761(2000)010[1620:IDVCWG]2.0.CO;2.
- Gang, Chengcheng, Wei Zhou, Yizhao Chen, Zhaoqi Wang, Zhengguo Sun, Jianlong Li, Jiaguo Qi, and Inakwu Odeh. 2014. “Quantitative Assessment of the Contributions of Climate Change and Human Activities on Global Grassland Degradation.” Environmental Earth Sciences 72 (11): 4273–4282. doi:10.1007/s12665-014-3322-6.
- Gao, Zhihai, Bin Sun, Zengyuan Li, Gabriel Del Barrio, and Xiaosong Li. 2016. “Desertification Monitoring and Assessment: A New Remote Sensing Method.” Paper presented at the 2016 IEEE international geoscience and remote sensing symposium (IGARSS).
- Gibbs, H. K., and J. M. Salmon. 2015. “Mapping the World’s Degraded Lands.” Applied Geography 57: 12–21. doi:10.1016/j.apgeog.2014.11.024.
- Gilbert, Richard O. 1987. Statistical Methods for Environmental Pollution Monitoring. United States: John Wiley & Sons.
- Gilbey, Ben, Jonathan Davies, Graciela Metternicht, and Chris Magero. 2019. “Taking Land Degradation Neutrality from Concept to Practice: Early Reflections on LDN Target Setting and Planning.” Environmental Science & Policy 100: 230–237. doi:10.1016/j.envsci.2019.04.007.
- Giuliani, Gregory, Bruno Chatenoux, Antonio Benvenuti, Pierre Lacroix, Mattia Santoro, and Paolo Mazzetti. 2020. “Monitoring Land Degradation at National Level Using Satellite Earth Observation Time-Series Data to Support SDG15 – Exploring the Potential of Data Cube.” Big Earth Data 4 (1): 3–22. doi:10.1080/20964471.2020.1711633.
- Goldstein, Allie, Will R. Turner, Seth A. Spawn, Kristina J. Anderson-Teixeira, Susan Cook-Patton, Joseph Fargione, Holly K. Gibbs, et al. 2020. “Protecting Irrecoverable Carbon in Earth’s Ecosystems.” Nature Climate Change 10 (4): 287–295. doi:10.1038/s41558-020-0738-8.
- Hickler, Thomas, Lars Eklundh, Jonathan W Seaquist, Benjamin Smith, Jonas Ardö, Lennart Olsson, Martin T Sykes, and Martin Sjöström. 2005. “Precipitation Controls Sahel Greening Trend.” Geophysical Research Letters 32 (21), doi:10.1029/2005GL024370.
- Higginbottom, Thomas, and Elias Symeonakis. 2014. “Assessing Land Degradation and Desertification Using Vegetation Index Data: Current Frameworks and Future Directions.” Remote Sensing 6 (10): 9552–9575. doi:10.3390/rs6109552.
- Hill, Michael J. 2013. “Vegetation Index Suites as Indicators of Vegetation State in Grassland and Savanna: An Analysis with Simulated SENTINEL 2 Data for a North American Transect.” Remote Sensing of Environment 137: 94–111. doi:10.1016/j.rse.2013.06.004.
- Hoffmann, William A, and Robert B Jackson. 2000. “Vegetation–Climate Feedbacks in the Conversion of Tropical Savanna to Grassland.” Journal of Climate 13 (9): 1593–1602. doi:10.1175/1520-0442(2000)013 < 1593:VCFITC>2.0.CO;2.
- Ivits, E., and M. Cherlet. 2013. “Land-Productivity Dynamics: Towards Integrated Assessment of Land Degradation at Global Scales.” Jt. Res. Cent. Eur. Comm 10: 59315. doi:10.2788/59315.
- Li, Hao, Xiaohui Yang, and Kebin Zhang. 2021. “Understanding Global Land Degradation Processes Interacted with Complex Biophysics and Socioeconomics from the Perspective of the Normalized Difference Vegetation Index (1982–2015).” Global and Planetary Change 198, doi:10.1016/j.gloplacha.2021.103431.
- Liu, Jianguo, Shuxin Li, Zhiyun Ouyang, Christine Tam, and Xiaodong Chen. 2008. “Ecological and Socioeconomic Effects of China’s Policies for Ecosystem Services.” Proceedings of the National Academy of Sciences 105 (28): 9477–9482. doi:10.1073/pnas.0706436105.
- Mannetje, L. T. 2007. “The Role of Grasslands and Forests as Carbon Stores.” Tropical Grasslands 41: 50–54. https://www.tropicalgrasslands.info/public/journals/4/Historic/Tropical%20Grasslands%20Journal%20archive/PDFs/Vol_41_2007/Vol_41_01_2007_pp50_54.pdf.
- Markos, Andrea, Neil Sims, and Gregory Giuliani. 2023. “Beyond the SDG 15.3.1 Good Practice Guidance 1.0 Using the Google Earth Engine Platform: Developing a Self-Adjusting Algorithm to Detect Significant Changes in Water Use Efficiency and Net Primary Production.” Big Earth Data:1-22. doi:10.1080/20964471.2022.2076375.
- Meehl, Gerald A, Francis Zwiers, Jenni Evans, Thomas Knutson, Linda Mearns, and Peter Whetton. 2000. “Trends in Extreme Weather and Climate Events: Issues Related to Modeling Extremes in Projections of Future Climate Change.” Bulletin of the American Meteorological Society 81 (3): 427–436. doi:10.1175/1520-0477(2000)081<0427:TIEWAC>2.3.CO;2.
- Ni, Jian. 2002. “Carbon Storage in Grasslands of China.” Journal of Arid Environments 50 (2): 205–218. doi:10.1006/jare.2001.0902.
- Oldeman, L. R., R. T. A. Hakkeling, and W. G. Sombroek. 1990. World Map of the Status of Human-Induced Soil Degradation: An Explanatory Note. Wageningen: International Soil Reference and Information Centre.
- O’Mara, F. P. 2012. “The Role of Grasslands in Food Security and Climate Change.” Annals of Botany 110 (6): 1263–1270. doi:10.1093/aob/mcs209.
- Parton, W. J., J. M. O. Scurlock, D. S. Ojima, D. S. Schimel, D. O. Hall, and Scopegram Group Members. 1995. “Impact of Climate Change on Grassland Production and Soil Carbon Worldwide.” Global Change Biology 1 (1): 13–22. doi:10.1111/j.1365-2486.1995.tb00002.x.
- Poussin, Charlotte, Alexandrine Massot, Christian Ginzler, Dominique Weber, Bruno Chatenoux, Pierre Lacroix, Thomas Piller, Liliane Nguyen, and Gregory Giuliani. 2021. “Drying Conditions in Switzerland – Indication from a 35-Year Landsat Time-Series Analysis of Vegetation Water Content Estimates to Support SDGs.” Big Earth Data 5 (4): 445–475. doi:10.1080/20964471.2021.1974681.
- Prince, Stephen D. 2019. “Challenges for Remote Sensing of the Sustainable Development Goal SDG 15.3.1 Productivity Indicator.” Remote Sensing of Environment, doi:10.1016/j.rse.2019.111428.
- Qian, Shuan, Yang Fu, and FeiFei Pan. 2010. “Climate Change Tendency and Grassland Vegetation Response During the Growth Season in Three-River Source Region.” Science China Earth Sciences 53 (10): 1506–1512. doi:10.1007/s11430-010-4064-2.
- Reynolds, J. F., D. M. Smith, E. F. Lambin, B. L. Turner, M. Mortimore, S. P. Batterbury, T. E. Downing, et al. 2007. “Global Desertification: Building a Science for Dryland Development.” Science 316 (5826): 847–851. doi:10.1126/science.1131634.
- Running, Steven W, Ramakrishna R Nemani, Faith Ann Heinsch, Maosheng Zhao, Matt Reeves, and Hirofumi Hashimoto. 2004. “A Continuous Satellite-Derived Measure of Global Terrestrial Primary Production.” Bioscience 54 (6): 547–560. doi:10.1641/0006-3568(2004)054[0547:ACSMOG]2.0.CO;2.
- Schimel, D., R. Pavlick, J. B. Fisher, G. P. Asner, S. Saatchi, P. Townsend, C. Miller, C. Frankenberg, K. Hibbard, and P. Cox. 2015. “Observing Terrestrial Ecosystems and the Carbon Cycle from Space.” Global Change Biology 21 (5): 1762–1776. doi:10.1111/gcb.12822.
- Scholes, Robert, Luca Montanarella, Anastasia Brainich, Nichole Barger, Ben Ten Brink, Matthew Cantele, Barend Erasmus, Judith Fisher, Toby Gardner, and Timothy G Holland. 2018. “Summary for policymakers of the assessment report on land degradation and restoration of the Intergovernmental Science-Policy Platform on Biodiversity and Ecosystem Services.” https://www.ipbes.net/system/tdf/spm_3bi_ldr_digital.pdf?file=1&type=node&id=28335.
- Scurlock, J. M. O., and D. O. Hall. 1998. “The Global Carbon Sink: A Grassland Perspective.” Global Change Biology 4 (2): 229–233. doi:10.1046/j.1365-2486.1998.00151.x.
- Sommer, Stefan, Claudio Zucca, Andrew Grainger, Michael Cherlet, Robert Zougmore, Youba Sokona, Joachim Hill, Raniero Della Peruta, Julia Roehrig, and Guosheng Wang. 2011. “Application of Indicator Systems for Monitoring and Assessment of Desertification from National to Global Scales.” Land Degradation & Development 22 (2): 184–197. doi:10.1002/ldr.1084.
- Stavros, E. N., D. Schimel, R. Pavlick, S. Serbin, A. Swann, L. Duncanson, J. B. Fisher, et al. 2017. “ISS Observations Offer Insights Into Plant Function.” Nature Ecology & Evolution 1 (7): 194. doi:10.1038/s41559-017-0194.
- Sun, Bin, Zhihai Gao, Zengyuan Li, Hongyan Wang, Xiaosong Li, Bengyu Wang, and Junjun Wu. 2015. “Dynamic and dry/wet Variation of Climate in the Potential Extent of Desertification in China During 1981–2010.” Environmental Earth Sciences 73 (7): 3717–3729. doi:10.1007/s12665-014-3659-x.
- Sun, Bin, Zengyuan Li, Zhihai Gao, Zhong Guo, Bengyu Wang, Xiaolong Hu, and Lina Bai. 2017. “Grassland Degradation and Restoration Monitoring and Driving Forces Analysis Based on Long Time-Series Remote Sensing Data in Xilin Gol League.” Acta Ecologica Sinica 37 (4): 219–228. doi:10.1016/j.chnaes.2017.02.009.
- Suttie, James M, Stephen G Reynolds, and Caterina Batello. 2005. Grasslands of the World. Rome: Food & Agriculture Org.
- Symeonakis, Elias, Nikolaos Karathanasis, Sotirios Koukoulas, and George Panagopoulos. 2016. “Monitoring Sensitivity to Land Degradation and Desertification with the Environmentally Sensitive Area Index: The Case of Lesvos Island.” Land Degradation & Development 27 (6): 1562–1573. doi:10.1002/ldr.2285.
- Tarantino, Cristina, Maria Adamo, and Palma Blonda. 2020. “Long-term Change Monitoring of Natural Grasslands Ecosystem in Support of SDG 15.3.” 1. Paper Presented at the EGU General Assembly Conference Abstracts.
- Thornthwaite, C. W. 1948. “An Approach Toward a Rational Classification of Climate.” Soil Science 66: 77–94. doi:10.1097/00010694-194807000-00007.
- Tiscornia, Guadalupe, Martín Jaurena, and Walter Baethgen. 2019. “Drivers, Process, and Consequences of Native Grassland Degradation: Insights from a Literature Review and a Survey in Río de la Plata Grasslands.” Agronomy 9 (5): 239. doi:10.3390/agronomy9050239.
- Tong, C., J. Wu, S. Yong, J. Yang, and W. Yong. 2004. “A Landscape-Scale Assessment of Steppe Degradation in the Xilin River Basin, Inner Mongolia, China.” Journal of Arid Environments 59 (1): 133–149. doi:10.1016/j.jaridenv.2004.01.004.
- UN. 2015. “Transforming our world: the 2030 Agenda for Sustainable Development.” https://wedocs.unep.org/bitstream/handle/20.500.11822/9824/-Transforming_our_world_the_2030_Agenda_for_Sustainable_Development-2015TransformingOurWorld_2015.pdf.pdf?sequence=3&%3BisAllowed=.
- UNCCD. 2017. “United Nations Convention to Combat Desertification–Global Land Outlook.” United Nations Convention to Combat Desertification Secretariat. https://www.unccd.int/resources/global-land-outlook/glo1.
- Unger, Stephan, and Marjan Jongen. 2015. “Progress in Botany.” Progress in Botany:347-93, doi:10.1007/978-3-319-08807-5_14.
- Verdoodt, Ann, and Eric Van Ranst. 2006. “Environmental Assessment Tools for Multi-Scale Land Resources Information SystemsA Case Study of Rwanda.” Agriculture, Ecosystems & Environment 114 (2-4): 170–184. doi:10.1016/j.agee.2005.10.006.
- Vogt, J. V., U. Safriel, G. Von Maltitz, Y. Sokona, R. Zougmore, G. Bastin, and J. Hill. 2011. “Monitoring and Assessment of Land Degradation and Desertification: Towards new Conceptual and Integrated Approaches.” Land Degradation & Development 22 (2): 150–165. doi:10.1002/ldr.1075.
- Wiesmair, Martin, Hannes Feilhauer, Anja Magiera, Annette Otte, and Rainer Waldhardt. 2016. “Estimating Vegetation Cover from High-Resolution Satellite Data to Assess Grassland Degradation in the Georgian Caucasus.” Mountain Research and Development 36 (1): 56–65. doi:10.1659/MRD-JOURNAL-D-15-00064.1.
- Willmott, Cort J, Steven G Ackleson, Robert E Davis, Johannes J Feddema, Katherine M Klink, David R Legates, James O’Donnell, and Clinton M Rowe. 1985. “Statistics for the Evaluation and Comparison of Models.” Journal of Geophysical Research 90 (C5): 8995–9005. doi:10.1029/JC090iC05p08995.
- Xia, Jiangzhou, Wenping Yuan, Sebastian Lienert, Fortunat Joos, Philippe Ciais, Nicolas Viovy, Ying-ping Wang, Xufeng Wang, Haicheng Zhang, and Yang Chen. 2019. “Global Patterns in Net Primary Production Allocation Regulated by Environmental Conditions and Forest Stand age: A Model-Data Comparison.” Journal of Geophysical Research: Biogeosciences 124 (7): 2039–2059. doi:10.1029/2018JG004777.
- Xoxo, Sinetemba, Sukhmani Mantel, Alta De Vos, Bawinile Mahlaba, David Le Maître, and Jane Tanner. 2022. “Towards SDG 15.3: The Biome Context as the Appropriate Degradation Monitoring Dimension.” Environmental Science & Policy 136: 400–412. doi:10.1016/j.envsci.2022.07.008.
- Xu, Hao-jie, Xin-ping Wang, and Xiao-xiao Zhang. 2016. “Decreased Vegetation Growth in Response to Summer Drought in Central Asia from 2000 to 2012.” International Journal of Applied Earth Observation and Geoinformation 52: 390–402. doi:10.1016/j.jag.2016.07.010.
- Yeganeh, Hassan, Seyed Jamale Khajedein, Fazel Amiri, and Abdul Rashid B. Mohamed Shariff. 2014. “Monitoring Rangeland Ground Cover Vegetation Using Multitemporal MODIS Data.” Arabian Journal of Geosciences 7 (1): 287–298. doi:10.1007/s12517-012-0733-0.
- Yuan, Wenping, Shuguang Liu, Guirui Yu, Jean-Marc Bonnefond, Jiquan Chen, Ken Davis, Ankur R Desai, Allen H Goldstein, Damiano Gianelle, and Federica Rossi. 2010. “Global Estimates of Evapotranspiration and Gross Primary Production Based on MODIS and Global Meteorology Data.” Remote Sensing of Environment 114 (7): 1416–1431. doi:10.1016/j.rse.2010.01.022.
- Zhao, Yuanyuan, Zhifeng Liu, and Jianguo Wu. 2020. “Grassland Ecosystem Services: A Systematic Review of Research Advances and Future Directions.” Landscape Ecology 35 (4): 793–814. doi:10.1007/s10980-020-00980-3.
- Zhao, Guangju, Xingmin Mu, Zhongming Wen, F. Wang, and P. Gao. 2013. “Soil erosion, conservation, and eco-environment changes in the Loess Plateau of China.” Land Degradation & Development 24 (5): 499–510. doi:10.1002/ldr.2246.
- Zheng, Yi, Ruoque Shen, Yawen Wang, Xiangqian Li, Shuguang Liu, Shunlin Liang, Jing M. Chen, Weimin Ju, Li Zhang, and Wenping Yuan. 2020. “Improved Estimate of Global Gross Primary Production for Reproducing its Long-Term Variation, 1982–2017.” Earth System Science Data 12 (4): 2725–2746. doi:10.5194/essd-12-2725-2020.
- Zheng, Liping, Liangjun Zhao, Bo Xiao, Liang Tan, Fengling Zheng, A. Siya, and Man Like. 2022. “Overview of Grassland Degradation Research Based on Remote Sensing Monitoring.” Open Journal of Applied Sciences 12 (04): 614–630. doi:10.4236/ojapps.2022.124042.
- Zhou, Wei, Han Yang, Lu Huang, Chun Chen, Xiaosong Lin, Zhongjun Hu, and Jianlong Li. 2017. “Grassland Degradation Remote Sensing Monitoring and Driving Factors Quantitative Assessment in China from 1982 to 2010.” Ecological Indicators 83:303-313. doi:10.1016/j.ecolind.2017.08.019.