
ABSTRACT
Building extraction from remote sensing data is an important topic in urban studies and the deep learning methods have an increasing role due to their minimal requirements in training data to reach outstanding performance. We aimed to investigate the original U-Net architecture’s efficiency in building segmentation with different number of training images and the role of data augmentation based on multisource remote sensing data with varying spatial and spectral resolutions (WorldView-2 [WV2], WorldView-3 [WV3] images and an aerial orthophoto [ORTHO]). When the trainings and predictions were conducted on the same image, U-Net provided good results with very few training images (validation accuracies: 94-97%; 192 images). Combining the ORTHO’s and WV2’s training data for prediction on WV3 provided poor results with low F1-score (0.184). However, the inclusion of only 48 WV3 training images significantly improved the F1-score (0.693), thus, most buildings were correctly identified. Accordingly, using only independent reference data (other than the target image) is not enough to train an accurate model. In our case, the reference from WW2 and ORTHO images did not provide an acceptable basis to train a good model, but a minimal number of training images from the targeted WV3 improved the accuracy (F1-score: 69%).
1. Introduction
Growing urbanization significantly changed the natural environment in recent decades (Ahmed et al. Citation2020; Uttara, Bhuvandas, and Aggarwal Citation2012). According to the 2018 Revision of World Urbanization Prospects produced by the United Nations, more than half (55%) of the world’s population lives in urban areas, and this proportion is expected to reach 68% by 2050 (UN Report Citation2019). In addition, global population growth and the emergence of megacities (cities with more than 10 million inhabitants) exert increasing pressure on Earth’s ecosystems (Ao et al. Citation2016; Koop and Leeuwen Citation2017; Li et al. Citation2019). Changes on this scale are generating a number of economic, social and environmental challenges in an increasing number of countries (Beaverstock, Smith, and Taylor Citation1999; Riffat, Powell, and Aydin Citation2016; Taubenbock et al. Citation2009). Addressing these issues has become a top priority in many cities and, as a result, sustainability and sustainable urbanization have become a key principle of urban development strategies (Kadhim, Mourshed, and Bray Citation2016; Roy Citation2009; Shen et al. Citation2012). Although urban regions are highly complex, advances of remote sensing have made a wide range of applications available to help urban planners overcome difficult challenges, such as monitoring climate change or the extent of the built environment (Avtar et al. Citation2020; Breunig et al. Citation2009; Griffiths et al. Citation2010; Maktav et al. Citation2005; Miller and Small Citation2003; Oșlobanu and Alexe Citation2021; Wellmann et al. Citation2020).
One of the most common applications of urban remote sensing is the object detection. Both government agencies and the private sector have an increasing need for accurate and reliable spatial data (Eslami and Mohammadzadeh Citation2016; Rose et al. Citation2015). The purpose of urban object detection can vary widely depending on the quality of the data: very high-resolution images or video feeds provided by UAS or traffic cameras can be used e.g. to distinguish different means of transportation (cars, buses, bikes etc.) (Leung et al. Citation2019; Peppa et al. Citation2018; Zhou et al. Citation2017), while datasets with coarser resolution – most commonly airborne or satellite imagery – are used to map entire cities for different purposes: to detect buildings, road networks or vegetated areas (Fischer et al. Citation1998; Gavankar and Ghosh Citation2018; Rottensteiner et al. Citation2014; Ao et al. Citation2016). Accordingly, object detection, such as finding buildings, needs very high spatial resolution, preferably <2 m where the edges and the texture can be visualized.
Many factors make automatic building extraction a complex task. Urban surfaces are highly heterogeneous with many different materials in close proximity to each other, so the contrast between buildings and other objects will be relatively low (Jaynes, Riseman, and Hanson Citation2003; Xu et al. Citation2018). Moreover, buildings in a given area are usually very diverse regarding shapes, roofing materials, condition and age of roofs etc. In addition, shadows cast by different objects can mislead the segmentation algorithms and bias the result (Han et al. Citation2022; Jung, Lee, and Lee Citation2022; Schlosser et al. Citation2020; You et al. Citation2018). Thus, traditional pixel-based classification techniques usually have thematic accuracy issues or require large amount of training data. Reference data is not always available in city level and the data collection is time-consuming and needs relevant field work.
Deep learning (DL) is an increasingly popular method in fundamental remote sensing applications. The increase in the quality and quantity of available data has led to the development of DL approaches that extract complex features more effectively than traditional ones, resulting in higher accuracies (He et al. Citation2018; Ma et al. Citation2019; Yuan et al. Citation2020; Zhang, Zhang, and Du Citation2016). The significant and continuous increase in computing power has made it possible to develop state-of-the-art techniques, such as convolutional neural networks (CNNs). In the field of remote sensing, CNNs have been successfully applied to many tasks, e.g. change detection (Mou, Bruzzone, and Zhu Citation2019; Wang et al. Citation2019), semantic segmentation (Kampffmeyer, Salberg, and Jenssen Citation2016; Panboonyuen et al. Citation2019; Yuan, Shi, and Gu Citation2021), and image enhancement (Hoque et al. Citation2019; Hu et al. Citation2021). Accordingly, numerous new CNN architectures are emerging. AlexNet was introduced by Krizhevsky, Sutskever, and Hinton (Citation2017), which ensured the processing of huge amounts of data relatively quickly utilizing the computer’s graphics processing unit (GPU). Another very significant milestone was the proposal of the fully convolutional networks (FCN) by Long, Shelhamer, and Darrell Citation2015. In order to label every pixel, the FCN architecture uses an encoder/decoder structure, and because it does not contain any fully connected layers, images of any size can be selected as input. Based on FCN, Ronneberger, Fischer, and Brox (Citation2015) proposed the U-Net. One of the key differences between the two architectures is that U-Net implements skip connections in its structure to achieve better results. Furthermore, U-Net has been modified in a way that precise segmentation can be achieved with fewer training data (Bardis et al. Citation2020).
Deep neural networks are prone to overfit the model (Antoniou, Storkey, and Edwards Citation2017; Srivastava et al. Citation2014) due to several factors, but the most common source of error is in the training data. If the amount of data available is insufficient, not representative enough, or too noisy, the model aims to reach the best fit to the training data learning the characteristics only the inputs but generalizes poorly to test data previously unseen by the model (Brownlee Citation2018; Rice, Wong, and Kolter Citation2020; Ying Citation2019). Novel deep convolutional neural networks rely heavily on big data. However, given the limited reference data available in many application areas, it is necessary to expand the data to avoid overfitting. The earliest and most straightforward example of data augmentation is based on simple image transformations, creating duplicates of the original images using traditional methods such as: flipping, rotating, cropping, shifting etc. (Shorten and Khoshgoftaar Citation2019; Perez and Wang Citation2017). Another, increasingly popular augmentation techniques are GANs (Generative Adversarial Networks) (Goodfellow et al. Citation2020) creating synthetic copies of existing training images, while retaining their main characteristics (Antoniou, Storkey, and Edwards Citation2017; Chlap et al. Citation2021).
Although deep learning has emerged as a powerful tool in many application areas, the performance of these models relies heavily on large amounts of annotated training data (Yang et al. Citation2022). In certain domains (such as remote sensing), this data is often limited or difficult to obtain as high-quality annotation requires qualified experts. Moreover, the same object can vary widely across different images depending on the sensor, the time of acquisition, and the angle of the imaging (Jia et al. Citation2021; Sun et al. Citation2021). To address this issue, researchers have proposed various approaches in the field of few-shot learning (FSL), which aims to assist models to quickly adapt to new tasks while minimizing the need for substantial training data (Dong and Xing Citation2018; Sun et al. Citation2019; Wang et al. Citation2020b). One approach to FSL is transfer learning (Weiss, Khoshgoftaar, and Wang Citation2016), which involves using a pre-trained model in a source domain to get an improved prediction on a target domain, i.e. transferring the knowledge to the target domain where labeled data may be scarce (Song et al. Citation2022), hence transfer learning has been widely utilized in the field of remote sensing (Thepade and Dindorkar Citation2022; Thirumaladevi, Veera Swamy, and Sailaja Citation2023; Zhang, Liu, and Shi Citation2020). We also employed transfer learning to enhance the accuracy of predictions on the target domain with limited annotated available data. Another increasingly popular approach to solve FSL related problems is meta-learning, which is also referred to as ‘learning to learn’, as it aims to learn new tasks more quickly and effectively (Hospedales et al. Citation2022; Huisman, van Rijn, and Plaat Citation2021). Meta-learning has shown promising results in improving the efficiency of deep learning models and reducing the amount of data required for training (Cha et al. Citation2023; Gella et al. Citation2023; Tseng et al. Citation2021).
Building segmentation using different deep learning networks is a widely researched area, with the primary goal of previous studies is most commonly to develop novel model variants, thereby increasing the accuracy (He, Fang, and Plaza Citation2020; Wang et al. Citation2020a; Wang and Miao Citation2022). In addition, other researchers have often used existing, large datasets in their work e.g. the WHU (Ji, Wei, and Lu Citation2019) and Inria (Maggiori et al. Citation2017) datasets (Bischke et al. Citation2017; Wang and Miao Citation2022; Yu et al. Citation2022), thus few samples learning utilizing multisource remote sensing data – with varying spatial and spectral resolutions – is often overlooked.
The aim of this study was to investigate how effectively the original U-Net network can be applied to segment buildings in densely built-up urban areas with a limited number of training images, under different circumstances: (i) when different regions of the same imagery were used for training and prediction; (ii) prediction using data from multiple sensors of different spectral and spatial resolutions, but without training data from the given image; (iii) incorporating additional data of the predicted imagery for the modeling.
2. Methods
2.1. Study area
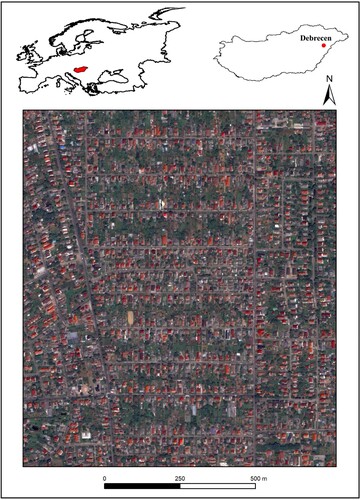
Study area was an urban environment in Debrecen, Hungary’s second largest city with a population of around 200,000 (). We have designated a smaller area in the northeastern part of the city where reference data were collected. The development of the selected area started in the 1970s and consists mainly of detached houses with roofing materials predominantly made of one of three materials: tile, asphalt or asbestos (older ones), but the newer ones have almost exclusively tile roofing.
Figure 1. Location of the study area in Debrecen, Hungary, highlighting the WorldView-2 (WV2), WorldView-3 (WV3) and orthophoto (ORTHO) reference datasets, as well as the test data of the WorldView-3 image (background image: WorldView-2).
2.2. Datasets
Three different remote sensing data types were studied: a WorldView-2 (WV2) and a WorldView-3 (WV3) satellite image, and an aerial orthophoto (ORTHO). The WV2 image was acquired on 24.07.2016 consisting of 8 spectral bands and the spatial resolution was 2 m. Since the imagery also included a 350 nm wide panchromatic band with a resolution of 0.5 m, we applied the Gran-Schmidt pan-sharpening method to increase the spatial resolution of the multispectral bands. The WV3 image was captured on 16.09.2019. Although the WV3 image has additional bands (SWIR, CAVIS) compared to the WV2, we had access only to the panchromatic and VNIR bands. While these bands had similar spectral properties to the WV2, the spatial resolution of the panchromatic band was better for the WV3 (0.3 m). The aerial orthophoto used in this study was provided by Lechner Knowledge Center (Hungarian institution for architecture, land registry and GIS) acquired in 2011 with an Ultracam X digital aerial camera system with 4 bands (blue, green, red and NIR), and a spatial resolution of 0.4 m (). Although three years have elapsed between the dates of the three images, the development of the area was active in the 1970s, and there was no significant development or change in land-use in recent years.
Table 1. Spectral and spatial properties of the input datasets.
The reference dataset (training and validation) for all images was based on field observation (located with GPS with attribute data) followed by visual interpretation of the given images. In case of orthophoto and the WV2 image, all houses were vectorized within an area of 2 km2, while for the WV3 this was 0.3 km2. The difference between the two areas is because for WV3 we were interested to see how the model performs with less training data. Reference data was split into training and validation in 80:20 ratio. Validation accuracy and loss were measured across each epoch during the modeling. In addition to the reference data, a test area of 0.3 square kilometers was selected from the WV3 image. The houses in the area were vectorized similarly to the training data; the resulting database consisted of 600 buildings. The classified images produced by the modeling were evaluated using this new test dataset through confusion matrices. Model performances were compared with the precision (positive predictive value) and recall (true positive rate) obtained from the confusion matrix. F1-score was also determined as the harmonic mean of precision and recall.
2.3. U-Net based image segmentation
The U-Net architecture consists of two main paths: (i) encoder or contraction path and the (ii) decoder or expanding path. (i) The encoder section consists of convolutional and max pooling layers when the model captures the main features and context of the images, but, at the same time, loses information about their location. (ii) During the contraction phase, the size of the images is reduced while the number of dimensions (bands) is increased. Since our goal is to classify all pixels of the original image as a result of the semantic segmentation, it is necessary to extract information about the localization as well as to restore the original image size. This is achieved by the decoder path of the U-Net, which uses transposed convolution for up-sampling (Abdollahi, Pradhan, and Alamri Citation2020; Du et al. Citation2020; Fan et al. Citation2022; Ronneberger, Fischer, and Brox Citation2015; Yan et al. Citation2022).
2.4. Data augmentation
Manual collection of the training data is a very time-consuming task; in our case, more than 3000 buildings were vectorized across the images. Although U-Net is known to provide good results even with limited data, data augmentation was a necessary step to get better thematic accuracy, as it provided sufficient data for the model training. We used traditional data augmentation methods: the original images were flipped horizontally and vertically, and rotated 90, 180 and 270 degrees. Thus, beside the original image, we obtained 5 additional images due to the augmentation.
2.5. Implementation details and model evaluation
Models were trained for a maximum of 50 epochs. We implemented an early stopping mechanism, which stopped the training process when the model performance did not improve in 15 epochs. For all models, we chose an initial learning rate of 0.001 and used the Adam method (Kingma and Ba Citation2014) as the optimization algorithm with a batch size of 20.
512 × 512 pixel images were applied for the training process. In total, 40 images were used for the WV2 and the aerial orthophoto, and 10 for the WV3. Combining the two different data sources (aerial and satellite imagery) caused problems in the modeling process as the spectral resolution of the data is different (4 and 8 channels respectively). In order to generate models using the training data from the two sources together, the 4 bands (blue, green, red, near-infrared) closest to the spectral range of the aerial orthophoto were selected from the 8 bands of the WV images.
Implementation was conducted in Python using TensorFlow (Abadi et al. Citation2016). All training experiments were run on a Nvidia RTX 3090 with 24GB of VRAM. ( and )
Figure 2. The modeling workflow with the abbreviated names of the models. First and last tags of the labels: 2 = WorldView-2; 3 = WorldView-3; O = Orthophoto. Second tag = Number of training image used for the prediction (before augmentation).
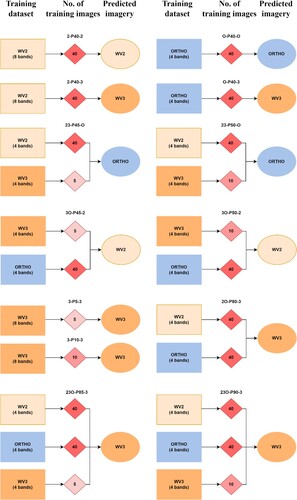
Table 2. Number of training and validation images per model (first and last tags of the labels: 2 = WorldView-2; 3 = WorldView-3; O = Orthophoto. Second tag = Number of training image used for the prediction before augmentation).
3. Results
3.1 Assessing the accuracy of models when predicting on the same imagery
Both the WV2 and the ORTHO ensured similarly good results when the predictions were performed on the same image in a different area (e.g. the WV2 training data was used to predict a separate region of the WV2 image), with validation accuracies above 94% and 97%, respectively (a,b). In both cases the learning curve showed that after a few epochs the validation accuracies were changing with the training accuracy without exceeding it during the learning phase, so overfitting cannot be observed for these models.
Figure 3. Learning curves in the case where the training dataset and the predicted imagery are the same. – a) 2-P40-2; b) O-P40-O; c) 3-P5-3; d) 3-P10-3. First and last tags of the labels: 2 = WorldView-2; 3 = WorldView-3; O = Orthophoto. Second tag = Number of training image used for the prediction (before augmentation).
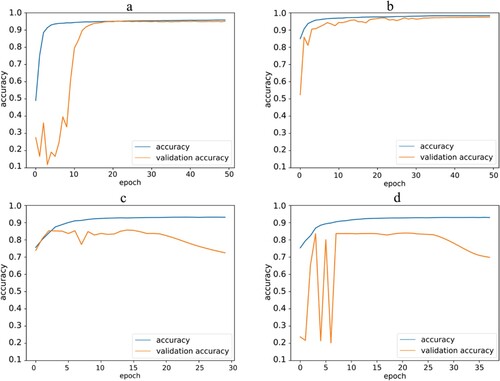
In the case of the WV3, (c,d) the learning curves of the models for both the 5 and 10 image training instances showed overfitting after a few epochs due to insufficient training data and, thus, the early stopping mechanism stopped the training process before the full 50 epochs. The segmentation results of the four models (.) were consistent with the tendencies of the learning curves.
Figure 4. Segmentation results when the training dataset and the predicted image were the same. – a) 2-P40-2; b) O-P40-O; c) 3-P5-3; d) 3-P10-3. First and last tags of the labels: 2 = WorldView-2; 3 = WorldView-3; O = Orthophoto. Second tag = Number of training image used for the prediction (before augmentation).
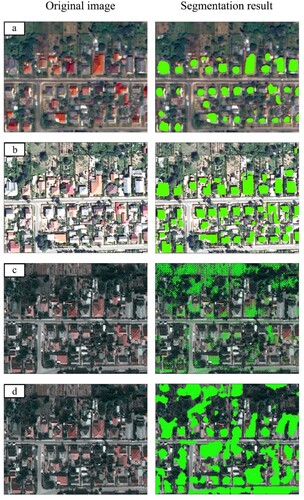
When validation accuracy was high and the model did not overfit (WV2, ORTHO; a,b), segmentation was also successful: almost all buildings were identified, with only a few misclassified pixels. Buildings that were incorrectly identified as background (false negative results) were almost exclusively smaller outbuildings (garages, tool sheds etc.).
We obtained poor segmentation results with the two models of the WV3 image (3-P5-3; 3-P10-3). When only 24 WV3 training images were used for the modeling process (c), the segmentation did not result in contiguous areas and most of the buildings were omitted. Although the modeling with 48 training images already showed some of the individual buildings as contiguous patches (.d), the segmentation was still poor, subject to many errors: much of the bare soil and roads were incorrectly segmented as buildings.
3.2 Accuracies when ORTHO was trained with WV2 and WV3 images
Prediction on the ORTHO with WV2 and WV3 training images resulted in poor results (). The class level metrics showed that although the precision values were relatively high (0.62 and 0.66), the corresponding recall values were only 0.05 and 0.09, resulting in low F1-scores (0.095 and 0.154, respectively).
Table 3. Prediction results of the ORTHO trained with the WV2 and WV3 (first and last tags of the labels: 2 = WorldView-2; 3 = WorldView-3; O = Orthophoto. Second tag = Number of training image used for the prediction before augmentation).
3.3 Accuracies when WV2 was trained with WV3 and ORTHO images
For both model combinations segmentation of the WV2 image based on the WV3 and ORTHO resulted in F1-scores above 0.5 (). Including 10 WV3 training images (3O-P50-2) instead of 5 (3O-P45-2), the precision value decreased slightly, but the increase in recall was almost 0.1, thus, modeling with more images resulted in a higher F1-score.
Table 4. Prediction results of the WV2 trained with the WV3 and ORTHO (first and last tags of the labels: 2 = WorldView-2; 3 = WorldView-3; O = Orthophoto. Second tag = Number of training image used for the prediction before augmentation).
3.4 Accuracies when WV3 was trained with WV2 and ORTHO images
In each case when only the WV2 and ORTHO images were used to train the models (and the WV3 dataset was excluded from training), only low F1-scores were obtained ().
Table 5. Prediction results of the WV3 trained with the WV2 and ORTHO (first and last tags of the labels: 2 = WorldView-2; 3 = WorldView-3; O = Orthophoto. Second tag = Number of training image used for the prediction before augmentation).
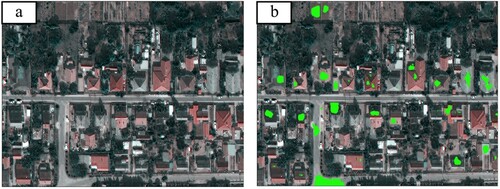
The highest F1-score of the three models was obtained by combining the training images of the WV2 and the orthophoto (2O-P80-3), but even here the F1-score was very low (0.184) and the segmentation result was also inappropriate: the model completely omitted several houses, while others were only partially segmented, and it also misclassified roads and bare soil areas as buildings (). While the precision of model 2O-P80-3 was relatively high (close to 0.7), the corresponding recall was only 0.0011, suggesting that the model missed many actual buildings in the image (i.e. the number of false negatives is high).
Figure 6. Segmentation result based on the combined training data of the WorldView-2 and the orthophoto (2O-P80-3). – a) original image; b) segmentation result; first and last tags of the label: 2 = WorldView-2; 3 = WorldView-3; O = Orthophoto. Second tag = Number of training image used for the prediction (before augmentation).
3.5 Accuracies when WV3 was trained with WV3, WV2 and ORTHO images
We obtained considerably higher F1-scores in the cases where training images of the WV3 image were included in the model building process (). Although WV3 solely as training images (3-P5-3; 3-P10-3) provided a higher F1-score than the combined model of the ORTHO and the WV2 (2O-P80-3), the result showed that despite the higher – but still low – F1-score, there are many errors in the segmentation. Comparison of 3-P5-3 and 3-P10-3 models revealed that by adding only 5 additional WV3 training images, the recall increased significantly (from 0.2 to 0.72), but the precision remained almost unchanged; i.e. the model correctly identified more buildings but the number of false positives was still very high due to the low precision value.
Table 6. Prediction results on the WorldView-3 image based on F1-scores in the case where WorldView-3 images were included for building the models (first and last tags of the labels: 2 = WorldView-2; 3 = WorldView-3; O = Orthophoto. Second tag = Number of training image used for the prediction before augmentation).
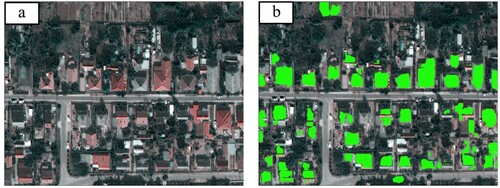
Best results were achieved when the WV2 and the ORTHO data were merged with the WV3. We used 192 images from the WV2 and the orthophoto, as well as 24 and 48 from the WV3 respectively (23O-P85-3; 23O-P90-3). Using all the available training data (23O-P90-3), the F1-score of the resulting model was 0.693, providing the most accurate segmentation for the WV3 image (). Although misclassifications also occurred in this model, their proportion has been significantly reduced and most of the buildings were included in the segmentation.
Figure 7. Segmentation result based on the combination of all available training data (23O-P90-3). (a: original image; b: segmentation result; first and last tags of the labels: 2 = WorldView-2, 3 = WorldView-3, O = Orthophoto, second tag = Number of training image used for the prediction before augmentation).
Discussion
Although many methods have been developed for building segmentation, seeking the way to reach the highest thematic accuracy with least efforts (i.e. collecting reference data) is still a challenging task due to the inhomogeneity of densely built-up areas: the presence of vegetation, shadows and other obstacles can relevantly bias the results. Furthermore, with the technology development the available input data is increasing, but the special characteristics of images taken by Uncrewed Aerial Vehicles (UAV), aircrafts, and satellites images regarding the applied sensor’s spatial and spectral resolution, the time of acquisition, which leads to significant differences among the possible output maps. Deep learning segmentation solutions are popular in image processing, there is a high requirement for annotated data, whilst producing these reference data is very time-consuming and their availability is often limited (Brigato and Iocchi Citation2020; Jia et al. Citation2021). Thus, a greatest challenge is the fusion of these data sources and their combined use in analyzes, e.g. in extracting or identifying objects (Liu et al. Citation2020; Meng et al. Citation2020), which is an important step when we intend to use previously collected reference data on a new (independent) image. In our work we have also encountered these problems: when fuzing the reference data, we followed the approach of Li et al. (Citation2021), that is, we reduced the bands of the WV images so that the number and the spectral range of the remaining bands is as close as possible to the channels of the orthophoto. As several previous studies have shown, U-Net is fundamentally well suited to building segmentation procedures (Alsabhan, Alotaiby, and Chaudhary Citation2022; McGlinchy et al. Citation2019; Yu et al. Citation2022; Wang et al. Citation2020a). Although many different variants of the U-Net have been developed in recent years to achieve even higher accuracies (He, Fang, and Plaza Citation2020; Hui et al. Citation2019; Rastogi, Bodani, and Sharma Citation2020; Wang and Miao Citation2022), we applied the original U-Net proposed by Ronneberger, Fischer, and Brox (Citation2015), as our research focused on how well the basic network can be used for segmentation with multi-source input data. Thus, we were able to focus on the impact of different data processing and training strategies on the segmentation performance, as the original network provided a suitable baseline for comparison.
We found that when the prediction was performed on the same image as the training, a very limited amount of data gave sufficiently good results. In case of the WV2 and orthophoto, we achieved validation accuracies over 94% with only 192 images (including the augmented images, too) used for training. The spatial resolution was 0.5 and 0.4 m for the WV2 and the ORTHO, respectively, with an image size of 512 × 512 pixels. Other researchers have achieved similarly high accuracies for building segmentation using U-Net based models, but in many cases, they have used considerably more training images. Wang et al. (Citation2022) conducted their research on the WHU (Ji, Wei, and Lu Citation2019) and Inria (Maggiori et al. Citation2017) datasets, with images of the same size as ours and a spatial resolution of 0.3 m, however, the number of images used for training was 4736 and 10000, respectively, achieving validation accuracy above 96%. Abdollahi and Pradhan (Citation2021) implemented the AIRS dataset (Chen et al. Citation2019) with a larger tile size (1536 × 1536) but finer resolution (7.5 cm), which contains more than 220000 buildings: they reported a validation accuracy above 95% with their proposed U-Net based network.
We reduced the number of training data in case of WV3: after augmentation, the models were trained with 24 and 48 images (3-P5-3; 3-P10-3). The amount of data used for these models proved to be insufficient: overfitting was observed in the learning curve (c,d), and severe misclassifications were visible in the segmentation results (c,d). In addition to the errors of the 3-P5-3; 3-P10-3, the F1-scores were low (). Using only the WV2 and orthophoto training data for the prediction of WV3 yielded even worse results (F1-score of 0.184; ): despite the number of the combined training images used for training was 384 (2O-P80-3), the F1-score was lower than in the case where only 24 images from WV3 were used (3-P5-3), so although we had 16 times more data, building the model with data from different sources resulted in a lower prediction performance (F1-score of 0.184). A significant improvement was achieved when the WV3 data were included alongside the WV2 and the ORTHO (23O-P85-3; 23O-P90-3): adding as few as 24 images to the modeling process, the F1-score increased by nearly 0.5 (from 0.184 to 0.661; and ). The inclusion of 24 additional images from WV3 further increased the accuracy of the prediction, with this model (23O-P90-3) yielding the highest F1-score (0.693). Furthermore, the precision and recall values of this model were similar (0.68 and 0.71, respectively), indicating that the model performed consistently.
The difference was considerable when WV2 images were applied to predict WV3 (e.g. 2O-P80-3) and vice versa (e.g. 3O-P50-2): in the former case (WV2 →WV3) the F1-score was 0.184, while in the latter it was 0.567 (WV3 →WV2), despite having less training data. The explanation lies in the quality of the two images: WV2 was taken in summer, with a smaller off-nadir angle (18°) and better lighting conditions, while WV3 was taken in autumn, with a higher off-nadir angle (30°). As a result, the buildings are more distorted in the WV3 image, which also produced larger proportion of shadows. Using the lower-quality WV3 images for training, the U-Net generalized better when predicting the WV2 images, but when trying to segment the WV3 images with the higher-quality WV2 training data, the model failed. Our results are consistent with the study of Weir et al. (Citation2020), who analyzed images with off-nadir angles ranging from 7.8° to 54° and found a difference of 0.4 between the F1-scores.
Several deep learning techniques were developed beside the U-Net, and successful applications had been reported in the topic of building extraction. Shi, Li, and Zhu (Citation2020) compared different deep convolutional neural networks (e.g. U-Net; SegNet and different variants of the FCN architecture etc.) on both medium (PlanetScope; 3 m) and very-high resolution (ISPRS Potsdam benchmark dataset; 5 cm) imagery, and found that in case of the PlanetScope imagery, U-Net outperformed several networks such as FCN-32s, FCN-16s, SegNet, etc. At medium resolution, they found that FC-DenseNet performed best, but the difference in F1-score compared to U-Net was only 3%. Furthermore, they revealed that while U-Net provides sharp building boundaries at very-high resolution (5 cm), the completeness of the segmentation result decreases in the presence of finer details. Wang et al. (Citation2022) proposed a novel Vision Transformer (ViT) architecture specified for building extraction and conducted experiments to compare its performance with state-of-the-art convolutional neural networks (CNNs) widely used for the same task (DeepLab V3+; different U-Net variants etc.). Although they found that their ViT-based approach outperformed traditional CNNs in building segmentation, the difference was only 2-3% in F1-scores when compared to different variants of the U-Net. Although these previous studies examined many models, they have primarily focused on benchmark datasets (WHU, Inria, Massachusetts), utilizing very large number of buildings (>10000) to train the models. The results of recent studies also show that although novel solutions generally provide better segmentation results, the classic U-Net, and its variants, are still relevant today. Although the accuracy measures of our experiments were lower, we used images with significant off-nadir, while the benchmark datasets usually contain optimal images that can ensure better results. In addition, we only used a limited number of training images instead of several thousand, but the validation accuracies obtained with 32 (192 with augmentation) training images, were comparable to the results reported in the above studies.
Our approach can serve as a good starting point in deep learning object segmentation cases where the goal is to monitor a particular region, since the incorporation of remote sensing images from different sensors into an existing dataset can be achieved with minimal effort but with good accuracy. A limitation of our approach is that selecting some training data is necessary from the newly included image in order to obtain good results with few data.
Conclusion
Although many deep learning-based building extraction methods have been developed, the combination of remote sensing data from different sources, often with varying resolutions, and limited training data still pose a major challenge in image processing. In this research, we investigated the efficiency of U-Net deep learning segmentation techniques for building extraction using remote sensing data from multiple sources, learning with few samples. We aimed to help data experts with quantified results of different training approaches (including when there was no training data from the given imagery). Our results revealed that:
When the source (i.e. the sensor) of the images used for model training and prediction was the same, validation accuracies were above 94% even with a small amount of training data (2-P40-2 and O-P40-O; 32 images). The segmentation results were visually satisfactory, with few misclassified pixels. For the WV3, when fewer images were used for modeling (3-P5-3 and 3-P10-3; 4 and 8 images), the learning curves showed overfitting and the segmentation results were poor.
Low F1-scores were obtained in the segmentation of the WV3 when only the orthophoto and WV2 images were used for the training. The best results were achieved when images from these two sources were merged (2O-P80-3; 64 images), but the F1-score was only 0.184.
The inclusion of 4 (24 with augmentation) WV3 training images with the ORTHO and WV2 (23O-P85-3) relevantly increased the accuracy: the F1-score increased to: 0.661 and the segmentation result were also visually improved. The addition of 8 (48 with augmentation) WV3 training images further increased the accuracy, but to a lesser extent (23O-P90-3; F1-score of 0.693).
The main conclusion is that U-Net can provide high accuracies in building segmentation even with training data from different sources, but at least a small amount of training data is needed from the target image. Small and medium sized enterprises working in the field of image processing cannot have the resources to ensure large amount of training samples (due to labor-intensive data preparation), however, utilizing the findings of this research, i.e. using only a few training images, and involving a minimal number of training data from the target image itself, good thematic accuracy can be obtained. Thus, building reference datasets of an area from multisource images is reasonable, because more training images increase the classification accuracy.
Disclosure statement
No potential conflict of interest was reported by the author(s).
Data availability statement
The data that support the findings of this study are available on request.
Additional information
Funding
References
- Abadi, Martín, Ashish Agarwal, Paul Barham, Eugene Brevdo, Zhifeng Chen, Craig Citro, Greg S. Corrado, et al. 2016. “TensorFlow: Large-Scale Machine Learning on Heterogeneous Distributed Systems,” March, arXiv:1603.04467.
- Abdollahi, Abolfazl, and Biswajeet Pradhan. 2021. “Integrating Semantic Edges and Segmentation Information for Building Extraction from Aerial Images Using UNet.” Machine Learning with Applications 6: 100194. doi:10.1016/j.mlwa.2021.100194.
- Abdollahi, Abolfazl, Biswajeet Pradhan, and Abdullah M. Alamri. 2020. “An Ensemble Architecture of Deep Convolutional Segnet and Unet Networks for Building Semantic Segmentation from High-Resolution Aerial Images.” Geocarto International 37 (12): 3355–3370. doi:10.1080/10106049.2020.1856199.
- Ahmed, Zahoor, Muhammad Mansoor Asghar, Muhammad Nasir Malik, and Kishwar Nawaz. 2020. “Moving Towards a Sustainable Environment: The Dynamic Linkage Between Natural Resources, Human Capital, Urbanization, Economic Growth, and Ecological Footprint in China.” Resources Policy 67: 101677. doi:10.1016/j.resourpol.2020.101677.
- Alsabhan, Waleed, Turky Alotaiby, and Gopal Chaudhary. 2022. “Automatic Building Extraction on Satellite Images Using Unet and ResNet50.” Computational Intelligence and Neuroscience 2022: 1–12. doi:10.1155/2022/5008854.
- Antoniou, Antreas, Amos Storkey, and Harrison Edwards. 2017. “Data Augmentation Generative Adversarial Networks,” arXiv:1711.04340.
- Ao, X. Y., C. S. B. Grimmond, Y. Y. Chang, D. W. Liu, Y. Q. Tang, P. Hu, Y. D. Wang, J. Zou, and J. G. Tan. 2016. “Heat, Water and Carbon Exchanges in the Tall Megacity of Shanghai: Challenges and Results.” International Journal of Climatology 36 (14): 4608–4624. doi:10.1002/joc.4657.
- Avtar, R., A. A. Komolafe, A. Kouser, D. Singh, A. P. Yunus, J. Dou, P. Kumar, et al. 2020. “Assessing Sustainable Development Prospects Through Remote Sensing: A Review.” Remote Sensing Applications-Society and Environment 20: 100402. doi:10.1016/j.rsase.2020.100402.
- Bardis, M., R. Houshyar, C. Chantaduly, A. Ushinsky, J. Glavis-Bloom, M. Shaver, D. Chow, E. Uchio, and P. Chang. 2020. “Deep Learning with Limited Data: Organ Segmentation Performance by U-Net.” Electronics 9 (8)), doi:10.3390/electronics9081199.
- Beaverstock, J. V., R. G. Smith, and P. J. Taylor. 1999. “A Roster of World Cities.” Cities 16 (6): 445–458. doi:10.1016/S0264-2751(99)00042-6.
- Bischke, Benjamin, Patrick Helber, Joachim Folz, Damian Borth, and Andreas Dengel. 2017. “Multi-Task Learning for Segmentation of Building Footprints with Deep Neural Networks,” September, arXiv:1709.05932.
- Breunig, M., H. Taubenbock, M. Wurm, and A. Roth. 2009. “Changing Urbanity in Istanbul Analysis of Megacity Developments Using Synergistic Potentials of Multi-Temporal SAR and Optical Data.” 2009 Joint Urban Remote Sensing Event, Vols 1-3, 24-+.
- Brigato, L., and L. Iocchi. 2020. “A Close Look at Deep Learning with Small Data,” March, arXiv:2003.12843.
- Brownlee, J. 2018. “Better Deep Learning: Train Faster, Reduce Overfitting, and Make Better Predictions.” Machine Learning Mastery.
- Cha, Zhangzhao, Dongmei Xu, Yi Tang, and Zuo Jiang. 2023. “Meta-Learning for Zero-Shot Remote Sensing Image Super-Resolution.” Mathematics 11 (7): 1653. doi:10.3390/math11071653.
- Chen, Q., L. Wang, Y. F. Wu, G. M. Wu, Z. L. Guo, and S. L. Waslander. 2019. “Aerial Imagery for Roof Segmentation: A Large-Scale Dataset towards Automatic Mapping of Buildings (Withdrawn Publication).” Isprs Journal of Photogrammetry and Remote Sensing 147: 42–55. doi:10.1016/j.isprsjprs.2018.11.011.
- Chlap, Phillip, Hang Min, Nym Vandenberg, Jason Dowling, Lois Holloway, and Annette Haworth. 2021. “A Review of Medical Image Data Augmentation Techniques for Deep Learning Applications.” Journal of Medical Imaging and Radiation Oncology 65 (5): 545–563. doi:10.1111/1754-9485.13261.
- Dong, Nanqing, and Eric Xing. 2018. Few-Shot Semantic Segmentation with Prototype Learning.
- Du, Getao, Xu Cao, Jimin Liang, Xueli Chen, and Yonghua Zhan. 2020. “Medical Image Segmentation Based on U-Net: A Review.” Journal of Imaging Science and Technology 64 (2): 20508-1–20508-12. doi:10.2352/J.ImagingSci.Technol.2020.64.2.020508.
- Eslami, M., and A. Mohammadzadeh. 2016. “Developing a Spectral-Based Strategy for Urban Object Detection from Airborne Hyperspectral TIR and Visible Data.” Ieee Journal of Selected Topics in Applied Earth Observations and Remote Sensing 9 (5): 1808–1816. doi:10.1109/JSTARS.2015.2489838.
- Fan, Xiangsuo, Chuan Yan, Jinlong Fan, and Nayi Wang. 2022. “Improved U-Net Remote Sensing Classification Algorithm Fusing Attention and Multiscale Features.” Remote Sensing 14 (15): 3591. doi:10.3390/rs14153591.
- Fischer, A., T. H. Kolbe, F. Lang, A. B. Cremers, W. Forstner, L. Plumer, and V. Steinhage. 1998. “Extracting Buildings from Aerial Images Using Hierarchical Aggregation in 2D and 3D.” Computer Vision and Image Understanding 72 (2): 185–203. doi:10.1006/cviu.1998.0721.
- Gavankar, N. L., and S. K. Ghosh. 2018. “Automatic Building Footprint Extraction from High-Resolution Satellite Image Using Mathematical Morphology.” European Journal of Remote Sensing 51 (1): 182–193. doi:10.1080/22797254.2017.1416676.
- Gella, Getachew Workineh, Dirk Tiede, Stefan Lang, Lorenz Wendit, and Yunya Gao. 2023. “Spatially Transferable Dwelling Extraction from Multi-Sensor Imagery in IDP/Refugee Settlements: A Meta-Learning Approach.” International Journal of Applied Earth Observation and Geoinformation 117 (March): 103210. doi:10.1016/j.jag.2023.103210.
- Goodfellow, Ian, Jean Pouget-Abadie, Mehdi Mirza, Bing Xu, David Warde-Farley, Sherjil Ozair, Aaron Courville, and Yoshua Bengio. 2020. “Generative Adversarial Networks.” Communications of the Acm 63 (11): 139–144. doi:10.1145/3422622.
- Griffiths, P., P. Hostert, O. Gruebner, and S. van der Linden. 2010. “Mapping Megacity Growth with Multi-Sensor Data.” Remote Sensing of Environment 114 (2): 426–439. doi:10.1016/j.rse.2009.09.012.
- Han, Q. Z., Q. Yin, X. Zheng, and Z. Y. Chen. 2022. “Remote Sensing Image Building Detection Method Based on Mask R-CNN.” Complex & Intelligent Systems 8 (3): 1847–1855. doi:10.1007/s40747-021-00322-z.
- He, N. J., L. Y. Fang, S. T. Li, A. Plaza, and J. Plaza. 2018. “Remote Sensing Scene Classification Using Multilayer Stacked Covariance Pooling.” Ieee Transactions on Geoscience and Remote Sensing 56 (12): 6899–6910. doi:10.1109/TGRS.2018.2845668.
- He, Nanjun, Leyuan Fang, and Antonio Plaza. 2020. “Hybrid First and Second Order Attention Unet for Building Segmentation in Remote Sensing Images.” Science China Information Sciences 63 (4), doi:10.1007/s11432-019-2791-7.
- Hoque, Ul, M. R, R. Burks, C. Kwan, and J. Li. 2019. “Deep Learning for Remote Sensing Image Super-Resolution.” In 2019 Ieee 10th Annual Ubiquitous Computing, Electronics & Mobile Communication Conference (Uemcon), 286–292.
- Hospedales, Timothy, Antreas Antoniou, Paul Micaelli, and Amos Storkey. 2022. “Meta-Learning in Neural Networks: A Survey.” IEEE Transactions on Pattern Analysis and Machine Intelligence 44 (9): 5149–5169. doi:10.1109/TPAMI.2021.3079209.
- Hu, L. S., M. J. Qin, F. Zhang, Z. H. Du, and R. Y. Liu. 2021. “RSCNN: A CNN-Based Method to Enhance Low-Light Remote-Sensing Images.” Remote Sensing 13 (1): 62. doi:10.3390/rs13010062.
- Hui, Jian, Mengkun Du, Xin Ye, Qiming Qin, and Juan Sui. 2019. “Effective Building Extraction from High-Resolution Remote Sensing Images With Multitask Driven Deep Neural Network.” IEEE Geoscience and Remote Sensing Letters 16 (5): 786–790. doi:10.1109/LGRS.2018.2880986.
- Huisman, Mike, Jan N. van Rijn, and Aske Plaat. 2021. “A Survey of Deep Meta-Learning.” Artificial Intelligence Review 54 (6): 4483–4541. doi:10.1007/s10462-021-10004-4.
- Jaynes, C., E. Riseman, and A. Hanson. 2003. “Recognition and Reconstruction of Buildings from Multiple Aerial Images.” Computer Vision and Image Understanding 90 (1): 68–98. doi:10.1016/S1077-3142(03)00027-4.
- Jia, Sen, Shuguo Jiang, Zhijie Lin, Nanying Li, Meng Xu, and Shiqi Yu. 2021. “A Survey: Deep Learning for Hyperspectral Image Classification with Few Labeled Samples.” Neurocomputing 448 (August): 179–204. doi:10.1016/j.neucom.2021.03.035.
- Ji, Shunping, Shiqing Wei, and Meng Lu. 2019. “Fully Convolutional Networks for Multisource Building Extraction from an Open Aerial and Satellite Imagery Data Set.” Ieee Transactions on Geoscience and Remote Sensing 57 (1): 574–586. doi:10.1109/TGRS.2018.2858817.
- Jung, S. J., K. Lee, and W. H. Lee. 2022. “Object-Based High-Rise Building Detection Using Morphological Building Index and Digital Map.” Remote Sensing 14 (2): 330. doi:10.3390/rs14020330.
- Kadhim, Nada, Monjur Mourshed, and Michaela Bray. 2016. “Advances in Remote Sensing Applications for Urban Sustainability.” Euro-Mediterranean Journal for Environmental Integration 1 (1), doi:10.1007/s41207-016-0007-4.
- Kampffmeyer, M., A. B. Salberg, and R. Jenssen. 2016. “Semantic Segmentation of Small Objects and Modeling of Uncertainty in Urban Remote Sensing Images Using Deep Convolutional Neural Networks.” In Proceedings of 29th Ieee Conference on Computer Vision and Pattern Recognition Workshops, (Cvprw 2016), 680–88. doi:10.1109/Cvprw.2016.90.
- Kingma, Diederik P., and Jimmy Ba. 2014. “Adam: A Method for Stochastic Optimization,” arXiv:1412.6980.
- Koop, S. H. A., and C. J. van Leeuwen. 2017. “The Challenges of Water, Waste and Climate Change in Cities.” Environment, Development and Sustainability 19 (2): 385–418. https://doi.org/10.1007/s10668-016-9760-4.
- Krizhevsky, A., I. Sutskever, and G. E. Hinton. 2017. “ImageNet Classification with Deep Convolutional Neural Networks.” Communications of the Acm 60 (6): 84–90. doi:10.1145/3065386.
- Leung, H. K., X. Z. Chen, C. W. Yu, H. Y. Liang, J. Y. Wu, and Y. L. Chen. 2019. “A Deep-Learning-Based Vehicle Detection Approach for Insufficient and Nighttime Illumination Conditions.” Applied Sciences-Basel 9 (22), doi:10.3390/app9224769.
- Li, D. R., J. Ma, T. Cheng, J. L. van Genderen, and Z. F. Shao. 2019. “Challenges and Opportunities for the Development of MEGACITIES.” International Journal of Digital Earth 12 (12): 1382–1395. doi:10.1080/17538947.2018.1512662.
- Li, Mengya, Penghai Wu, Biao Wang, Honglyun Park, Yang Hui, and Wu Yanlan. 2021. “A Deep Learning Method of Water Body Extraction from High Resolution Remote Sensing Images With Multisensors.” Ieee Journal of Selected Topics in Applied Earth Observations and Remote Sensing 14: 3120–3132. doi:10.1109/JSTARS.2021.3060769.
- Liu, Jia, Tianrui Li, Peng Xie, Shengdong Du, Fei Teng, and Xin Yang. 2020. “Urban Big Data Fusion Based on Deep Learning: An Overview.” Information Fusion 53: 123–133. doi:10.1016/j.inffus.2019.06.016.
- Long, Jonathan, Evan Shelhamer, and Trevor Darrell. 2015. “Fully Convolutional Networks for Semantic Segmentation.” In Presented at the 2015 IEEE Conference on Computer Vision and Pattern Recognition (CVPR).
- Ma, L., Y. Liu, X. L. Zhang, Y. X. Ye, G. F. Yin, and B. A. Johnson. 2019. “Deep Learning in Remote Sensing Applications: A Meta-Analysis and Review.” Isprs Journal of Photogrammetry and Remote Sensing 152 (June): 166–177. doi:10.1016/j.isprsjprs.2019.04.015.
- Maggiori, Emmanuel, Yuliya Tarabalka, Guillaume Charpiat, and Pierre Alliez. 2017. “Can Semantic Labeling Methods Generalize to Any City? The Inria Aerial Image Labeling Benchmark.” In Presented at the 2017 IEEE International Geoscience and Remote Sensing Symposium (IGARSS).
- Maktav, D., F. S. Erbek, and C. Jürgens. 2005. “Remote Sensing of Urban Areas.” International Journal of Remote Sensing 26 (4): 655–659. https://doi.org/10.1080/01431160512331316469.
- McGlinchy, Joe, Brian Johnson, Brian Muller, Maxwell Joseph, and Jeremy Diaz. 2019. “Application of UNet Fully Convolutional Neural Network to Impervious Surface Segmentation in Urban Environment from High Resolution Satellite Imagery.” In Presented at the IGARSS 2019-2019 IEEE International Geoscience and Remote Sensing Symposium.
- Meng, Tong, Xuyang Jing, Zheng Yan, and Witold Pedrycz. 2020. “A Survey on Machine Learning for Data Fusion.” Information Fusion 57: 115–129. doi:10.1016/j.inffus.2019.12.001.
- Miller, R. B., and C. Small. 2003. “Cities from Space: Potential Applications of Remote Sensing in Urban Environmental Research and Policy.” Environmental Science & Policy 6 (2): 129–137. doi:10.1016/S1462-9011(03)00002-9.
- Mou, L. C., L. Bruzzone, and X. X. Zhu. 2019. “Learning Spectral-Spatial-Temporal Features via a Recurrent Convolutional Neural Network for Change Detection in Multispectral Imagery.” Ieee Transactions on Geoscience and Remote Sensing 57 (2): 924–935. doi:10.1109/TGRS.2018.2863224.
- Oșlobanu, Constantin, and Mircea Alexe. 2021. “Built-up Area Analysis Using Sentinel Data in Metropolitan Areas of Transylvania, Romania.” Hungarian Geographical Bulletin 70 (1): 3–18. doi:10.15201/hungeobull.70.1.1.
- Panboonyuen, T., K. Jitkajornwanich, S. Lawawirojwong, P. Srestasathiern, and P. Vateekul. 2019. “Semantic Segmentation on Remotely Sensed Images Using an Enhanced Global Convolutional Network with Channel Attention and Domain Specific Transfer Learning.” Remote Sensing 11 (1): 83. doi:10.3390/rs11010083.
- Peppa, M. V., D. Bell, T. Komar, and W. Xiao. 2018. “Urban Traffic Flow Analysis Based on Deep Learning Car Detection from Cctv Image Series.” The International Archives of the Photogrammetry, Remote Sensing and Spatial Information Sciences XLII-4: 499–506. doi:10.5194/isprs-archives-XLII-4-499-2018.
- Perez, Luis, and Jason Wang. 2017. “The Effectiveness of Data Augmentation in Image Classification Using Deep Learning,” arXiv:1712.04621.
- Rastogi, Kriti, Pankaj Bodani, and Shashikant A. Sharma. 2020. “Automatic Building Footprint Extraction from Very High-Resolution Imagery Using Deep Learning Techniques.” Geocarto International 37 (5): 1501–1513. doi:10.1080/10106049.2020.1778100.
- Rice, Leslie, Eric Wong, and J. Zico Kolter. 2020. “Overfitting in Adversarially Robust Deep Learning,” arXiv:2002.11569.
- Riffat, Saffa, Richard Powell, and Devrim Aydin. 2016. “Future Cities and Environmental Sustainability.” Future Cities and Environment 2 (0), doi:10.1186/s40984-016-0014-2.
- Ronneberger, O., P. Fischer, and T. Brox. 2015. “U-Net: Convolutional Networks for Biomedical Image Segmentation.” Medical Image Computing and Computer-Assisted Intervention, Pt Iii 9351: 234–241. doi:10.1007/978-3-319-24574-4_28.
- Rose, R. A., D. Byler, J. R. Eastman, E. Fleishman, G. Geller, S. Goetz, L. Guild, et al. 2015. “Ten Ways Remote Sensing Can Contribute to Conservation.” Conservation Biology 29 (2): 350–359. doi:10.1111/cobi.12397.
- Rottensteiner, F., G. Sohn, M. Gerke, J. D. Wegner, U. Breitkopf, and J. Jung. 2014. “Results of the ISPRS Benchmark on Urban Object Detection and 3D Building Reconstruction.” Isprs Journal of Photogrammetry and Remote Sensing 93 (July): 256–271. doi:10.1016/j.isprsjprs.2013.10.004.
- Roy, M. 2009. “Planning for Sustainable Urbanisation in Fast Growing Cities: Mitigation and Adaptation Issues Addressed in Dhaka, Bangladesh.” Habitat International 33 (3): 276–286. doi:10.1016/j.habitatint.2008.10.022.
- Schlosser, A. D., G. Szabo, L. Bertalan, Z. Varga, P. Enyedi, and S. Szabo. 2020. “Building Extraction Using Orthophotos and Dense Point Cloud Derived from Visual Band Aerial Imagery Based on Machine Learning and Segmentation.” Remote Sensing 12 (15): 2397. doi:10.3390/rs12152397.
- Shen, L. Y., Y. Peng, X. L. Zhang, and Y. Z. Wu. 2012. “An Alternative Model for Evaluating Sustainable Urbanization.” Cities 29 (1): 32–39. doi:10.1016/j.cities.2011.06.008.
- Shi, Yilei, Qingyu Li, and Xiao Xiang Zhu. 2020. “Building Segmentation Through a Gated Graph Convolutional Neural Network with Deep Structured Feature Embedding.” ISPRS Journal of Photogrammetry and Remote Sensing 159 (January): 184–197. doi:10.1016/j.isprsjprs.2019.11.004.
- Shorten, C., and T. M. Khoshgoftaar. 2019. “A Survey on Image Data Augmentation for Deep Learning.” Journal of Big Data 6 (1), doi:10.1186/s40537-019-0197-0.
- Song, Yisheng, Ting Wang, Subrota K. Mondal, and Jyoti Prakash Sahoo. 2022. “A Comprehensive Survey of Few-Shot Learning: Evolution, Applications, Challenges, and Opportunities.” arXiv. doi:10.48550/arXiv.2205.06743.
- Srivastava, N., G. Hinton, A. Krizhevsky, I. Sutskever, and R. Salakhutdinov. 2014. “Dropout: A Simple Way to Prevent Neural Networks from Overfitting.” Journal of Machine Learning Research 15 (June): 1929–1958.
- Sun, Qianru, Yaoyao Liu, Tat-Seng Chua, and Bernt Schiele. 2019. “Meta-Transfer Learning for Few-Shot Learning.” arXiv. doi:10.48550/arXiv.1812.02391.
- Sun, Xian, Bing Wang, Zhirui Wang, Hao Li, Hengchao Li, and Kun Fu. 2021. “Research Progress on Few-Shot Learning for Remote Sensing Image Interpretation.” IEEE Journal of Selected Topics in Applied Earth Observations and Remote Sensing 14: 2387–2402. doi:10.1109/JSTARS.2021.3052869.
- Taubenbock, H., M. Wegmann, A. Roth, H. Mehl, and S. Dech. 2009. “Urbanization in India - Spatiotemporal Analysis Using Remote Sensing Data.” Computers, Environment and Urban Systems 33 (3): 179–188. doi:10.1016/j.compenvurbsys.2008.09.003.
- Thepade, Sudeep D., and Mayuresh R. Dindorkar. 2022. “Fusing Deep Convolutional Neural Network Features with Thepade’s SBTC for Land Usage Identification.” Engineering Science and Technology, an International Journal 27 (March): 101014. doi:10.1016/j.jestch.2021.05.018.
- Thirumaladevi, S., K. Veera Swamy, and M. Sailaja. 2023. “Remote Sensing Image Scene Classification by Transfer Learning to Augment the Accuracy.” Measurement: Sensors 25 (February): 100645. doi:10.1016/j.measen.2022.100645.
- Tseng, Gabriel, Hannah Kerner, Catherine Nakalembe, and Inbal Becker-Reshef. 2021. “Learning to Predict Crop Type from Heterogeneous Sparse Labels Using Meta-Learning.” In 2021 IEEE/CVF Conference on Computer Vision and Pattern Recognition Workshops (CVPRW), 1111–20. doi:10.1109/CVPRW53098.2021.00122.
- United Nations, Department of Economic and Social Affairs, Population Division. 2019. World Urbanization Prospects: The 2018 Revision (ST/ESA/SER.A/420). New York: United Nations. https://population.un.org/wup/publications/Files/WUP2018-Report.pdf.
- Uttara, S., Nishi Bhuvandas, and Vanita Aggarwal. 2012. “Impacts of Urbanization on Environment.” International Journal of Research in Engineering and Applied Sciences 2 (2): 1637–1645.
- Wang, Libo, Shenghui Fang, Xiaoliang Meng, and Rui Li. 2022. “Building Extraction With Vision Transformer.” IEEE Transactions on Geoscience and Remote Sensing 60: 1–11. doi:10.1109/TGRS.2022.3186634.
- Wang, Shengsheng, Xiaowei Hou, and Xin Zhao. 2020a. “Automatic Building Extraction from High-Resolution Aerial Imagery via Fully Convolutional Encoder-Decoder Network With Non-Local Block.” IEEE Access 8: 7313–7322. doi:10.1109/ACCESS.2020.2964043.
- Wang, Haiying, and Fang Miao. 2022. “Building Extraction from Remote Sensing Images Using Deep Residual U-Net.” European Journal of Remote Sensing 55 (1): 71–85. doi:10.1080/22797254.2021.2018944.
- Wang, Weixing, Nan Yang, Yi Zhang, Fengping Wang, Ting Cao, and Patrik Eklund. 2016. “A Review of Road Extraction from Remote Sensing Images.” Journal of Traffic and Transportation Engineering (English Edition) 3 (3): 271–282. doi:10.1016/j.jtte.2016.05.005.
- Wang, Yaqing, Quanming Yao, James Kwok, and Lionel M. Ni. 2020b. “Generalizing from a Few Examples: A Survey on Few-Shot Learning.” arXiv. doi:10.48550/arXiv.1904.05046.
- Wang, Q., Z. H. Yuan, Q. Du, and X. L. Li. 2019. “GETNET: A General End-to-End 2-D CNN Framework for Hyperspectral Image Change Detection.” Ieee Transactions on Geoscience and Remote Sensing 57 (1): 3–13. doi:10.1109/TGRS.2018.2849692.
- Weir, Nicholas, David Lindenbaum, Alexei Bastidas, Adam Etten, Sean Mcpherson, Jacob Shermeyer, Varun Kumar, and Hanlin Tang. 2020. “SpaceNet MVOI: A Multi-View Overhead Imagery Dataset.” In Proceedings/IEEE International Conference on Computer Vision. IEEE International Conference on Computer Vision, January.
- Weiss, Karl, Taghi M. Khoshgoftaar, and DingDing Wang. 2016. “A Survey of Transfer Learning.” Journal of Big Data 3 (1): 9. doi:10.1186/s40537-016-0043-6.
- Wellmann, Thilo, Angela Lausch, Erik Andersson, Sonja Knapp, Chiara Cortinovis, Jessica Jache, Sebastian Scheuer, et al. 2020. “Remote Sensing in Urban Planning: Contributions Towards Ecologically Sound Policies?” Landscape and Urban Planning 204: 103921. doi:10.1016/j.landurbplan.2020.103921.
- Xu, Y. Y., L. Wu, Z. Xie, and Z. L. Chen. 2018. “Building Extraction in Very High Resolution Remote Sensing Imagery Using Deep Learning and Guided Filters.” Remote Sensing 10 (1), doi:10.3390/rs10010144.
- Yan, Chuan, Xiangsuo Fan, Jinlong Fan, and Nayi Wang. 2022. “Improved U-Net Remote Sensing Classification Algorithm Based on Multi-Feature Fusion Perception.” Remote Sensing 14 (5): 1118. doi:10.3390/rs14051118.
- Yang, Jiachen, Xiaolan Guo, Yang Li, Francesco Marinello, Sezai Ercisli, and Zhuo Zhang. 2022. “A Survey of Few-Shot Learning in Smart Agriculture: Developments, Applications, and Challenges.” Plant Methods 18 (1): 28. doi:10.1186/s13007-022-00866-2.
- Ying, X. 2019. “An Overview of Overfitting and Its Solutions.” In 2018 International Conference on Computer Information Science and Application Technology 1168. doi:10.1088/1742-6596/1168/2/022022.
- You, Y. F., S. Y. Wang, Y. X. Ma, G. S. Chen, B. Wang, M. Shen, and W. H. Liu. 2018. “Building Detection from VHR Remote Sensing Imagery Based on the Morphological Building Index.” Remote Sensing 10 (8): 1287. doi:10.3390/rs10081287.
- Yu, Mingyang, Xiaoxian Chen, Wenzhuo Zhang, and Yaohui Liu. 2022. “AGs-Unet: Building Extraction Model for High Resolution Remote Sensing Images Based on Attention Gates U Network.” Sensors 22 (8): 2932. doi:10.3390/s22082932.
- Yuan, Q. Q., H. F. Shen, T. W. Li, Z. W. Li, S. W. Li, Y. Jiang, H. Z. Xu, et al. 2020. “Deep Learning in Environmental Remote Sensing: Achievements and Challenges.” Remote Sensing of Environment 241 (May): 111716. doi:10.1016/j.rse.2020.111716.
- Yuan, X. H., J. F. Shi, and L. C. Gu. 2021. “A Review of Deep Learning Methods for Semantic Segmentation of Remote Sensing Imagery.” Expert Systems with Applications 169 (May): 114417. doi:10.1016/j.eswa.2020.114417.
- Zhang, Deyuan, Zhenghong Liu, and Xiangbin Shi. 2020. “Transfer Learning on EfficientNet for Remote Sensing Image Classification.” In 2020 5th International Conference on Mechanical, Control and Computer Engineering (ICMCCE), 2255–58. doi:10.1109/ICMCCE51767.2020.00489.
- Zhang, L. P., L. F. Zhang, and B. Du. 2016. “Deep Learning for Remote Sensing Data: A Technical Tutorial on the State of the Art.” Ieee Geoscience and Remote Sensing Magazine 4 (2): 22–40. doi:10.1109/MGRS.2016.2540798.
- Zhou, D. F., V. Fremont, B. Quost, Y. C. Dai, and H. D. Li. 2017. “Moving Object Detection and Segmentation in Urban Environments from a Moving Platform.” Image and Vision Computing 68: 76–87. doi:10.1016/j.imavis.2017.07.006.