
 ?Mathematical formulae have been encoded as MathML and are displayed in this HTML version using MathJax in order to improve their display. Uncheck the box to turn MathJax off. This feature requires Javascript. Click on a formula to zoom.
ABSTRACT
Africa is covered with extensive woodlands, savannas and rainforests. The tree cover of these biomes has been undergoing substantial changes in recent decades. However, the dynamics of forests in Africa are currently unclear, particularly in the woodlands and savanna areas covered by sparse trees. Here, we assessed the spatio-temporal trend of African forests from 2000 to 2020, using a 250-m resolution fractional tree cover product that can capture the variation of forest density in the widespread mixed vegetation landscapes of the continent. The tree cover trends, interannual change and hotspots of forest gain and loss were evaluated. Results showed that the African forest area increased at a rate of 3.59 million ha/year over the study period, reaching 589 million ha in 2020. Considerable forest gain and loss both occurred in Africa. The net change rate in woodlands’ forest area was the fastest (2.28 million ha/year), followed by rainforests (0.80 million ha/year) and savannas (0.34 million ha/year). Hotspots of forest gain were concentrated in the north belt of woodlands and savannas, while forest loss primarily clustered in East and South Africa. This work would help African countries to monitor forest change and promote forest management to achieve the Sustainable Development Goals.
1. Introduction
Forest plays an essential role in the biodiversity conservation of flora and fauna, climate change mitigation and adaptation, and ecosystem service maintenance for social-economic development (Alkama and Cescatti Citation2016). Promoting the sustainable management of all types of forests is proposed by Sustainable Development Goals (SDGs), and forest area is considered as one of the monitoring indicators (SDG 15.1.1).
Africa is covered by the world’s second-largest tropical rainforests, whose carbon storage plays a crucial role in the global carbon cycle (Cuni-Sanchez et al. Citation2021). Besides, the continent is famous for its extensive woodlands and the world’s most immense savannas (Aleman, Jarzyna, and Staver Citation2018). The two mixed tree-grass systems account for about 30% of the continent’s total area. In recent decades, these vegetation biomes have been undergoing substantial changes due to climate change, wildfires and anthropogenic activities (Mitchard and Flintrop Citation2013; Brandt et al. Citation2017). Severe forest decline occurred in Africa, including deforestation, wildfire and shifting agriculture (Curtis et al. Citation2018). Evidences for forest recovery and woody plant encroachment in woodlands and savannas were also reported (Venter, Cramer, and Hawkins Citation2018). Monitoring the dynamics of African tree-covered areas, primarily rainforests, woodlands and savannas, would help to promote sustainable forest management and reach the SDGs.
Remote sensing provides an effective tool for monitoring forest change in Africa (Guo et al. Citation2021; Cui and Li Citation2022). Many studies assessed the variation of vegetation greenness in Africa using vegetation indices such as Normalized Difference Vegetation Index (NDVI) and Enhanced Vegetation Index (EVI) derived from various satellite observations (e.g. Heumann et al. Citation2007; Mishra et al. Citation2015; Venter et al. Citation2020). However, both forests and herbaceous vegetation may contribute to the signal of the vegetation index but with differentiated ecological functions (Brandt et al. Citation2015; Estoque et al. Citation2021), making it challenging to separate their respective contributions to vegetation’s greenness change. This should not be neglected, especially in widespread woodlands and savannas of Africa, which are transitional biomes composited of trees and grasses (Bucini and Hanan Citation2007).
The dynamics of African forests were also evaluated with categorical forest maps derived from remote sensing data (Bodart et al. Citation2013; Skowno et al. Citation2017; Bullock et al. Citation2021). The categorical forest map identifies land surface with the tree cover reaching a certain percentage as forests. This approach inadequately represents within-class heterogeneity of forest density (DeFries et al. Citation1995), which may underestimate the forest cover changes without alternation of land cover types (Estoque et al. Citation2021). For example, when the tree cover increases from 50% to 90% or decreases to 20%, the forest class might stay the same. This uncertainty may be exacerbated in woodlands and savanna landscapes covered with mixed trees and grasses, which are widely distributed in Africa.
Fractional tree cover provides the improved depiction of forest cover with the proportion of ground covered by trees or woody vegetation, which helps to describe sub-pixel forest cover change over time (DeFries, Hansen, and Townshend Citation2000). Detailed forest gain and loss assessment results, particularly in the widespread mixed tree-grass systems, could be obtained using the fractional tree cover data (Estoque et al. Citation2021; Bera et al. Citation2021). However, several disadvantages were reported for the existing fractional tree cover products, such as low interannual stability (Yang and Crews Citation2019), discontinuous spatial distribution (Gerard et al. Citation2017), overestimation for low values and underestimation for high values (Sexton et al. Citation2013). This may result in unrealistic results in forest change analysis. A few studies have extracted tree cover or woody plant cover data from MODIS and Landsat imageries combined with aerial photography records and used it to assess forest change in Africa (e.g. Buitenwerf et al. Citation2012; Brandt et al. Citation2018; Wimberly et al. Citation2022). However, these studies were available only in small regions, such as the Kruger park in South Africa (Levick and Rogers Citation2011), the Serengeti national park in Tanzania (Holdo et al. Citation2020) and the Sahel belt in northern Africa (Brandt et al. Citation2016). Although woody plants dynamics of the whole continent were addressed in several studies, the assessment was based on the meta-analysis (Stevens et al. Citation2017), or using vegetation optical depth data at a 0.25° spatial resolution as a proxy for woody cover (Brandt et al. Citation2017). There is still a lack of studies to depict African forest change using tree cover data at the continental scale.
This paper aims to map the spatio-temporal changes of forests in Africa from 2000 to 2020. We use the GLOBMAP fractional tree cover product to assess the tree cover trend, interannual dynamics, and hotspot countries occurring substantial forest gain or loss in the continent. This product was generated from MODIS seasonal observations based on the different spectral seasonal curves of trees and herbaceous vegetation components. It shows high interannual stability and reasonable spatial patterns, which can characterize the change of forest density in the widespread mixed tree-grass landscapes of Africa. This work would support African countries in assessing forest dynamics for sustainable forest management.
2. Material and method
2.1. Study area
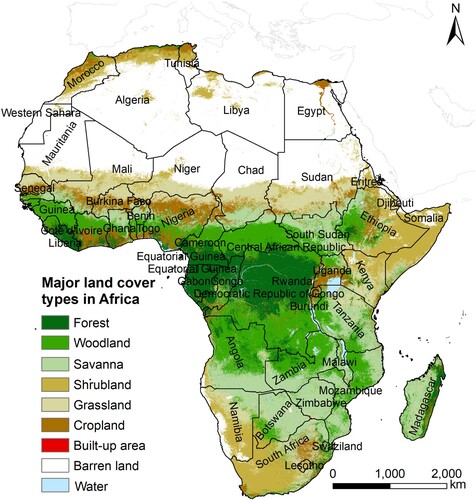
The study area is comprised of the entire land of Africa (17°33′W∼51°24′E, 37°21′N∼34°51′S), covering an area of 3.02 billion ha (FAO and UNEP Citation2020). shows the land cover maps of Africa. The International Geosphere-Biosphere Programme (IGBP) classification in MODIS land cover type products (MCD12Q1) was aggregated into nine categories: forest, woodland, savanna, shrubland, grassland, cropland, built-up area, barren land and water body. Forest, woodland and savanna are the three main biome types covered by trees. Africa’s forest is dominated by tropical rainforest (about 90%), which is concentrated in Central Africa and Eastern Madagascar. Woodland is distributed in the north and south of the tropical rainforest. The north belt is stretched from Guinean countries across South Sudan to the Ethiopian highlands, and the south belt is at the south of the equator spanning from Angola to Mozambique. Savanna is located farther north and south of woodland, primarily in the Sahel regions in sub-Saharan Africa, south of the South African Plateau and western Madagascar.
Figure 1. Land cover map in Africa. The land cover map was aggregated from the International Geosphere Biosphere Programme (IGBP) land cover layer of MODIS land cover type products (MCD12Q1) for 2010. Forest consists of evergreen needleleaf forest, evergreen broadleaf forest, deciduous needleleaf forest, deciduous broadleaf forest, and mixed forest. Woodland is comprised of woody savanna. Shrubland is comprised of closed shrubland and open shrubland.
2.2. Datasets
This study analyzed and compared the forest cover change in Africa using eight remote sensing products, including GLOBMAP Fractional Tree Cover product, Global Geo-information Public Product GlobeLand30 land cover maps, the Advanced Very High Resolution Radiometer Vegetation Continuous Fields (AVHRR VCF) product, Moderate-Resolution Imaging Spectroradiometer Vegetation Continuous Fields (MODIS VCF) product, Global Forest Change (GFC) product, GLOBMAP Leaf Area Index (LAI) product, Climatic Research Unit gridded time series (CRU TS) and Google Earth high spatial resolution imageries.
2.2.1. Globmap fractional tree cover product
GLOBMAP Fractional Tree Cover product (Version 1.0) was used to analyze tree cover dynamics and quantify the forest area, gain and loss in Africa from 2000 to 2020. In this dataset, tree cover refers to the annual maximum woody plant cover when leaves are at full growth. Global tree cover was generated from MODIS seasonal observations at a spatial resolution of 250-m from 2000 to 2020. First, nine phenological metrics were extracted as the input features from MODIS seasonal land surface reflectance data based on seasonal spectral curve shapes of trees and herbaceous vegetation (Liu and Liu Citation2020). These include four Logistic model regression parameters and five descriptive statistics, namely the mean and bias values of NDVI, the mean reflectance of green and two short-wave infrared bands during the growing season. Then, training samples were derived from the combination of high-resolution forest cover maps of GlobeLand30 (Chen et al. Citation2015) and PALSAR Forest/Non-Forest products (Shimada et al. Citation2014). An aggregated map was created by calculating the proportion of pixels labeled as forest in GlobeLand30 at a 250-m spatial resolution. Those pixels with an area proportion of inconsistent forest/non-forest labels in the two products exceeding 30% were excluded. About one billion training samples were derived from the aggregated map. Finally, a feedforward neural network was calibrated and used to generate annual global fractional tree cover maps. The fractional tree cover in each pixel ranged from 0 to 100%. The estimation results were validated with 1,140 reference samples visually interpreted from Google Earth’s very high spatial resolution imageries, showing the root mean square error (RMSE) and mean absolute error (MAE) of 11.78% and 7.39%, respectively. This dataset was used to characterize forest changes within pixels.
2.2.2. Globeland30 land cover product
Forest maps from GlobeLand30 in 2000 and 2020 were used for comparative analysis of forest change in Africa. GlobeLand30 provides global land cover maps at 30-m resolution in three timestamps 2000, 2010, and 2020 (Chen, Ban, and Li Citation2014). It was produced based on an integrated method of pixel-based classification, object-based identification, and expert knowledge verification (Chen et al. Citation2015). The overall accuracy of the dataset is above 80%. Forest is defined as the land with a tree canopy cover of over 10% in GlobeLand30 product. The dataset was downloaded from http://globeland30.org/.
2.2.3. Avhrr vegetation continuous fields product
The percent tree cover layers in AVHRR VCF product from 2001 to 2016 were used for comparative analysis of forest change. AVHRR VCF consists of three layers of vegetation cover, including percent tree cover, percent non-tree vegetation, and percent bare ground (Song et al. Citation2018). This yearly fractional vegetation cover data was generated from AVHRR Long Term Data Record Version 4 (LTDR V4) data using a bagged regression tree model, covering from 1982 to 2016 (1994 and 2000 were missing due to lack of data) at a 0.05-degree resolution. The percent tree cover represents the ratio of the area covered by tree crowns’ vertical projection above ground to the total area in the dataset. Data was provided at https://earthexplorer.usgs.gov/products.
2.2.4. Modis vegetation continuous fields product
The percent tree cover layers in MODIS VCF yearly product (MOD44B Version 6) from 2000 to 2020 were used for comparative analysis of forest change. MODIS VCF contains fractions of three ground cover components, including percent tree cover, percent non-tree cover, and percent non-vegetated (Hansen et al. Citation2003). The data was generated using temporal metrics from 16-day composites of MODIS land surface reflectance and brightness temperatures data based on a supervised regression tree algorithm. The percent tree cover is referred to the area proportion of tree canopy cover with tree height equal to or greater than 5 m. Data was provided at https://lpdaac.usgs.gov/products/mod44bv006/.
2.2.5. Global forest change product
Forest cover gain over 2000–2012 and forest cover loss over 2000–2020 from GFC were also used for comparative analysis. GFC provides forest cover gain during 2000–2012 and annual forest cover loss during 2000–2021 (Hansen et al. Citation2013). The data was generated from Landsat satellites based on bagged decision tree methodology. Forest cover gain in the data represents the inverse of forest cover loss or the pixel’s state changed from non-forest to forest. Forest cover loss means the stand-replacement disturbance or the pixel’s state changed from forest to non-forest. Data was downloaded from https://storage.googleapis.com/earthenginepartners-hansen/GFC-2021-v1.9/download.html.
2.2.6. Globmap leaf area index product
GLOBMAP LAI product was used to map the annual mean LAI trend from 2000 to 2020 as a reference in comparative analysis. The product provides a consistent long-term global LAI from 1981 to the present (Liu, Liu, and Chen Citation2012). GLOBMAP LAI was retrieved by quantitative fusion of MODIS and AVHRR data. MODIS LAI series was generated from MODIS land surface reflectance data (MOD09A1 C6) based on the GLOBCARBON LAI algorithm (Deng et al. Citation2006). The relationships between AVHRR observations (GIMMS NDVI (Tucker et al. Citation2005)) and MODIS LAI were established pixel by pixel using two data series during the overlapped period (2000–2006). Then the AVHRR LAI back to 1981 was estimated from historical AVHRR GIMMS NDVI based on these pixel-level relationships. Here, the LAI data derived from MODIS during 2000–2020 at a 500-m spatial resolution were used to evaluate the vegetation change.
2.2.7. Climatic research unit gridded time series
Annual accumulated precipitation and mean temperature from CRU TS 4.06 over 2000–2020 were used to conduct a correlation analysis between forest and climate factors. CRU TS provides global monthly climate data from 1901 to 2020 at a 0.5° resolution (Harris et al. Citation2020), which was produced by the National Centre for Atmospheric Science in the UK (https://crudata.uea.ac.uk/cru/data/hrg/). The grided monthly data was integrated by the daily or sub-daily observations from the National Meteorological Administration and external stations based on the Angular Distance Weighted (ADW) interpolation method. Annual accumulated precipitation was derived by summing the CRU TS monthly precipitation of all 12 calendar months. The annual mean temperature was derived by averaging the CRU TS monthly mean temperature of all 12 calendar months.
2.2.8. High spatial resolution imagery from google earth
High spatial resolution imageries available in Google Earth were used as auxiliary data to demonstrate the dynamics of forests in three sites as examples. Site 1 is in the west of South Sudan (26.01°E, 7.22°N), site 2 is in the east of Zambia (31.18°E, 13.49°S), and site 3 is in the south of Central African Republic (19.02°E, 5.29°N).
2.3. Methodology
2.3.1. Assessing forest cover changes in Africa
To assess the forest cover dynamics in Africa, the linear trend method and t-test were applied to model the changing trend and confidence level of the tree cover over 2000–2020 using GLOBMAP fractional tree cover product, respectively. The linear trend, widely used in the analysis of vegetation dynamics (Wingate, Phinn, and Kuhn Citation2019; Wang et al. Citation2020), was regressed based on the ordinary least square regression. The trend of tree cover was estimated using the following expression.
(1)
(1) where
represents the trend of tree cover,
is the number of years in the study period, which is 21 in this study.
is the value of tree cover in the year
. A positive value of slope indicates that tree cover increases in the study period, while a negative value indicates that tree cover decreases. The trend with p < 0.05 is considered statistically significant.
We also estimated the trend and confidence level of annual forest area using the linear trend method and t-test. Here, forested land refers to the land with a tree cover of more than 10%, referenced by the forest definition in Food and Agriculture Organization (FAO). The area was calculated by multiplying the tree cover in GLOBMAP product with the area of a single pixel (62, 500 square meters). Then yearly forest area was obtained by summing the area of all pixels within a region in a specific year. Interannual dynamics in forest area and hotspots of forest gain and loss over the study period were assessed after smoothing the annual data to reduce the uncertainty of the product. In estimating interannual dynamics, the yearly fractional tree cover data from 2000 to 2020 was smoothed using a five-year moving average method. The maximum and minimum values within each five-year period were excluded before calculating the average value to reduce the impacts of extreme values. Then the annual forest gain and loss in forest area were calculated from the difference of the smoothed data between the two adjacent years. We also smoothed the data that was used to identify the hotspots of forest gain and loss. The tree cover at the beginning of the study period was calculated from the average values for 2000, 2001, and 2002, and that at the end of the study period was calculated from the average values for 2018, 2019, and 2020. Then, the difference in tree cover between the two periods was estimated.
Additionally, the linear trends of percent tree cover from AVHRR VCF over 2001–2016 and that from MODIS VCF over 2000–2020 were estimated for comparative analysis. The forest change of GlobeLand30 was also assessed to compare with the tree cover trend. Forest maps from GlobeLand30 in 2000 and 2020 were aggregated to the spatial resolution of 250-m by calculating the area proportion of the forest pixels within each 250-m grid. Then the forest change was estimated by subtraction of the two resampled maps. Forest gain and loss maps derived from GFC were aggregated to a 250-m spatial resolution through the resample function in Google Earth Engine. Besides, the annual mean LAI was calculated from GLOBMAP LAI dataset during 2000–2020. The linear trend in annual mean LAI was evaluated and compared with the forest change derived from forest products.
2.3.2. Quantifying the driving roles of climate on forest dynamics
Linear trends of annual accumulated precipitation and mean temperature from 2000 to 2020 were estimated, and the roles played by the two climatic factors in driving forest dynamics were assessed by Pearson’s correlation analysis. The spatial resolution of GLOBMAP fractional tree cover product was aggregated to 0.5° to match the resolution of climatic datasets.
The correlation coefficient was estimated by the following expression:
(2)
(2) where
represents Pearson’s correlation coefficient between tree cover and climate factors,
is 21 in this study.
and
is the tree cover and the climatic factor (annual accumulated precipitation or mean temperature) in the year
. If
, it indicates that the increase of the climate factor promotes tree growth; otherwise, if
, it means the increase of that climate factor is not conducive to tree growth. The higher the absolute value of the correlation coefficient, the stronger the relationship between the two factors. The correlation coefficient with p < 0.05 is considered statistically significant in this study.
3. Results
3.1. Spatial distribution of Africa’s tree cover in 2020
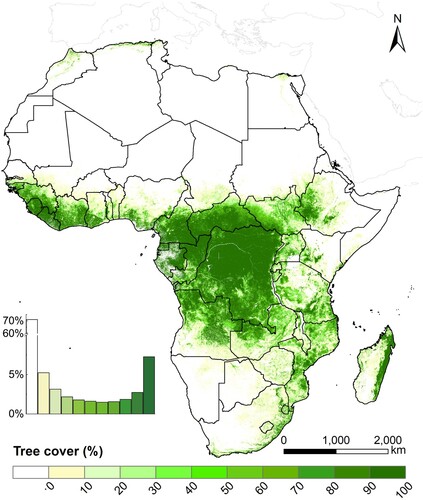
represents the spatial distribution of tree cover over Africa in 2020. About 29% of the land area in Africa was covered by tree crowns, with most clustered in sub-Saharan Africa. The Land Cover Classification System (LCCS) was followed in the study to further classify the land covered by trees into closed, open and sparse forests (Jansen and Di Gregorio Citation2002). Closed forests (tree cover ≥ 70%) indicated dense tree cover, accounting for 51% of all the forested areas in Africa. They were primarily distributed in the central Congo Basin and eastern Madagascar, similar to the distribution of rainforests in Africa. Open forests (20%≤ tree cover < 70%) and sparse forests (10% < tree cover < 20%) accounted for 37% and 12% of the forested areas, respectively. These forests were mainly concentrated in woodlands and savannas in East and South Africa and Guinea and Sudan in the north of the Congo basin.
Figure 2. Spatial distribution of tree cover in 2020 for Africa.
3.2. Annual trend in tree cover from 2000 to 2020
The linear trend map of tree cover in the study period is shown in . The results showed an overall increasing trend of tree cover in Africa at a rate of 0.50 ± 1.45%/year from 2000 to 2020. Most of the forested areas (61.30%) indicated insignificant (p ≥ 0.05) trends or remained unchanged in tree cover, mainly distributed in the central Congo Basin. About 25.41% of the forested areas show significant positive trends (p < 0.05), which indicates an increase in tree cover in these regions. These pixels were primarily concentrated in woodlands in the north and south of the Congo basin. Almost 14% of pixels with positive slopes showed an increasing rate faster than 2%/year, and most of these pixels were found in the north belt of woodlands from Cameroon to South Sudan. 13.29% of the forested areas showed significant negative slopes (p < 0.05), suggesting a decline in forest density. These pixels were concentrated in parts of East and South Africa and eastern Madagascar, and 86% of these pixels had negative slopes at a rate lower than −2%/year ( (a)).
Figure 3. Linear trend map (%/year) of tree cover in Africa over 2000–2020. Grey color areas exhibited no significant trend at the 95% confidence level or the change/trend equal to 0%/year. White color areas exhibited non-forested (Pixels with tree cover approximately 0% of more than 18 years from 2000 to 2020).
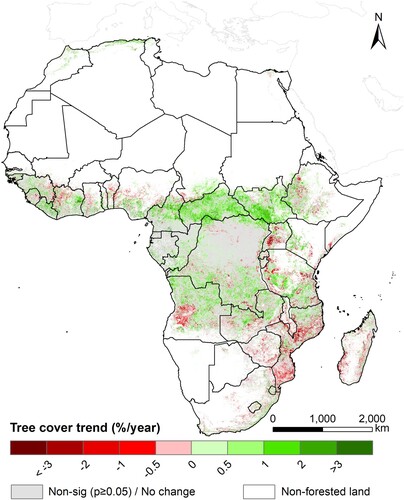
Figure 4. The area proportion of tree cover changing trend and the trend variations in different forest types in Africa. (a) Histogram of linear trend of tree cover over 2000–2020 in the whole continent, and (b) variations of trend in the initially closed forest (tree cover ≥ 70%), open forest (20% ≤ tree cover < 70%), and sparse forest (10% < tree cover < 20%). Black bars mean the median value of the trend and green bars represent the quartiles of the trend. Note that the plot does not include insignificant trends (p ≥ 0.05). Different forest types were referenced from the GLOBMAP fractional tree cover data in 2000 based on the definition of the Land Cover Classification System (LCCS).
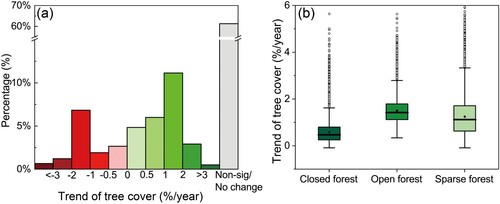
Different dynamics patterns were observed for various initial forest types ( (b)). The trends of tree cover for the initial closed, open and sparse forests were 0.58 ± 0.47%/year, 1.50 ± 0.53%/year and 1.25 ± 0.80%/year, respectively. Generally, the tree density in open and sparse forests increased faster than that of closed forests, probably due to the limited potential of tree cover expansion for the initially closed forests.
3.3. Interannual dynamics in forest area from 2000 to 2020
Interannual dynamics of forest area were derived from the GLOBMAP product to investigate forest gain and loss during 2000–2020 in Africa and typical vegetation biomes, namely rainforest, woodland and savanna. The distribution of these three biomes was modified from the land cover map of MCD12Q1 and the simplified vegetation map of Miller et al. (Citation2016). Forest gain and loss in 2000 were excluded from the assessment due to the lack of data from the previous year.
The annual forest area in Africa showed a significant increasing trend over 2000–2020, with a rate of 3.59 million ha/year. Forest area in Africa was 448 million ha in 2000 and rose to 589 million ha by 2020 ( (a)). Because MODIS images used for data generation in 2000 did not cover the whole year, which may introduce uncertainty in the estimation results of 2000. However, the increasing trend in the African forest area was still significant during 2001–2020. Annual forest gain in Africa remained relatively stable during the study period, showing a downward fluctuation around 2010. The average gain was about 17 million ha yearly from 2001 to 2020. The average forest loss area was about 14 million ha/year, caused by forest disturbances such as fires, herbivore activities and shifted agriculture (Buitenwerf et al. Citation2012). Substantial forest loss was found in 2009 and 2010 and exceeded the area of forest gain. After 2010, a downward trend of forest loss was demonstrated.
Figure 5. Annual forest area dynamics, gain and loss in Africa and typical forest biomes during 2000–2020. Interannual changes in (a) Africa, (b) rainforest, (c) woodland, and (d) savanna.
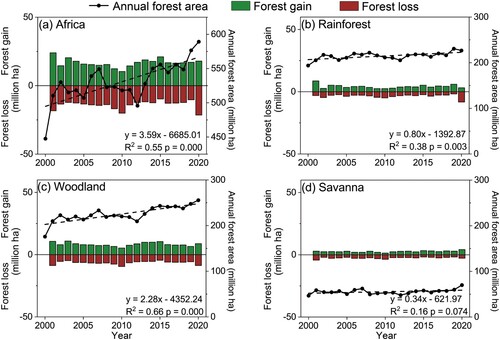
Forest area in rainforest biomes showed a slightly positive trend (0.80 million ha/year), varying between 194 million ha and 231 million ha over 2000–2020. Two distinct phases of forest loss were found for rainforests, a phase of loss increasing (2003–2010) and another phase of loss decreasing in a fluctuation way (2011–2019). The forest loss may be related to deforestation due to increasing population pressure (Kranz et al. Citation2018). Nonetheless, the average annual forest area gain of 4 million ha was comparable to the annual forest area loss of 3 million in the region, indicating that subsequent growth of secondary forest in deforested areas or reforestation had offset forest degradation during the study period (Potapov et al. Citation2012).
A significant forest area increase was found in woodland biomes from 182 million ha in 2000 to 260 million ha in 2020 (at a rate of 2.28 million ha/year), accompanied by notable forest loss and gain during the study period. Woodlands were divided into two belts at the north and south of the equator. Different patterns of forest gain and loss were found in the two belts. More forest gain than forest loss was found in the north belt, and forest gain and forest loss coexisted in the south belt. The average forest loss area was 6 million ha in the entire region, of which about 66% was contributed from woodlands in the south belt at the south of the equator. The forest loss in woodlands had two phases, including a phase of increased forest loss before 2010 and another phase of decreased forest loss after 2010. Extensive forest gain occurred in both the south and north belts of woodlands, showing an average gain area of 5 million ha and 3 million ha in the two belts, respectively. A possible reason might be the encroachment of woody plants (Venter, Cramer, and Hawkins Citation2018).
A slight increase in forested area was also presented in savanna areas during 2000–2020. The net forest gain in savanna biomes was 23 million ha over the last two decades, with an annual increase rate of 0.34 million ha. Forest loss in the region reached the largest in 2010 (4 million ha), then declined and stably changed in the following years. Forest gain showed an opposite change with an increasing tendency since 2010. This might be related to forest recovery, reforestation and woody plant encroachment in the region, as suggested in the previous study (Brandt et al. Citation2015).
3.4. Hotspots of forest area loss and gain
Hotspots for forest area loss and gain in Africa were identified at the country scale (). Countries that suffered the most forest loss were primarily distributed in Central, South and Southeast Africa, including Mozambique, the Democratic Republic of Congo, Tanzania, Angola, Zambia, South Africa, Madagascar, Uganda, Zimbabwe, and Ethiopia. The total loss area in these ten countries accounted for about 76% of the overall area of forest loss in Africa. Forest area decline and degradation in these counties might be related to severe deforestation to meet the increasing livelihood needs and rapid population growth (Brandt et al. Citation2017).
Figure 6. Hotspots of forest area loss and gain from 2000 to 2020 in Africa at the country scale. Top ten countries with the most (a) forest area loss and (b) forest area gain over 2000–2020.
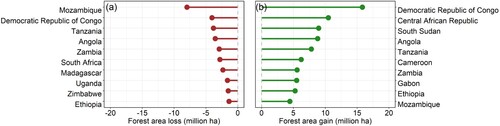
Countries that experienced the most significant forest area gain were concentrated in Central Africa and the north belt of woodlands from the Gulf of Guinea to Ethiopian highlands, including the Democratic Republic of Congo, the Central African Republic, South Sudan, Angola, Tanzania, Cameroon, Zambia, Gabon, Ethiopia, and Mozambique. The forest gain area in these ten countries accounted for about 70% of the total forest area gain in Africa. The expansion of forested areas was probably caused by natural forest regrowth, newly planted trees (Fagan et al. Citation2022) and woody plant encroachment (Mitchard et al. Citation2009).
We found that the Democratic Republic of Congo, Tanzania, Angola, Zambia, Ethiopia and Mozambique were hotspots of forest loss and gain. Widespread forest degradation reported in these countries results in forest loss (Abera et al. Citation2022), while secondary forests could regrow at the sufficient rainfall condition in the previously cleared areas, which may lead to forest recovery in these regions (Potapov et al. Citation2012).
4. Discussion
4.1. Comparative analysis of multiple datasets for monitoring forest dynamics
The African forests dynamics estimated from GLOBMAP fractional tree cover product were compared with those detected by other datasets, namely GlobeLand30, AVHRR VCF, MODIS VCF and GFC (). All datasets demonstrated considerable forest gain and loss in Africa over the recent two decades in spatial distribution, except for GFC showing a dramatic forest loss but few forest gains. A net forest gain was demonstrated by MODIS VCF over the study period, with the forest area increasing from 347 million ha in 2000 to 366 million ha in 2020. This net gain agrees with the conclusion observed from our results but shows different spatial patterns. In contrast, GlobeLand30 and AVHRR VCF reported a net forest area loss in Africa. A substantial forest loss of 156 million ha was found during 2000–2020 based on forest maps from GlobeLand30, accounting for 19% of the forest area in 2000 (828 million ha). The forest area derived from AVHRR VCF showed a faint net loss of 5 million ha during 2001–2016. The forest area from AVHRR VCF in 2016 was 529 million ha, close to our results of 589 million ha.
Figure 7. Forest change maps based on GlobeLand30, AVHRR VCF, MODIS VCF and GFC products, and annual mean LAI change map. (a) Forest change of GlobeLand30 from 2000 to 2020, (b) linear trend of percent tree cover of AVHRR VCF from 2001 to 2016, (c) linear trend of percent tree cover of MODIS VCF from 2000 to 2020. Grey color areas exhibited no significant trend at the 95% confidence level or the change ratio equal to zero. White color areas exhibited no forest or tree covered. (d) Forest cover gain from 2000 to 2012 and (e) forest cover loss from 2000 to 2020 of GFC in Africa. (f) Linear trend of annual mean LAI from 2000 to 2020, white color represented no forest-covered areas of GLOBMAP fractional tree cover product (pixels with tree cover approximately 0% of more than 18 years from 2000 to 2020).
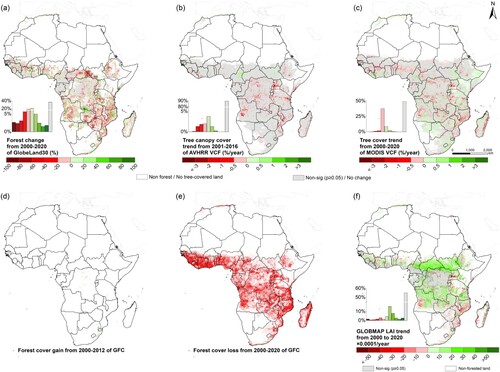
GlobeLand30 showed a slightly higher area proportion of forest loss pixels (32.15%) than that of forest gain pixels (31.42%) ( (a)). The north belt of woodlands was identified as one of the hotspots of forest loss, with the forest percentage decreasing by 60% or even more. This differed from the results in our study. The possible reason may be that the forest map in GlobeLand30 identifies all lands with canopy cover above 10% as forest. It can measure the expansion or contraction of forest extent (Chen, Ban, and Li Citation2014), but may underestimate the changes in forest cover density. For example, when the tree cover of a pixel increased from 30% to 80%, this change could not be captured by this categorical forest map. In this study, forest dynamics were estimated using the fractional tree cover dataset, which could represent the variations of tree density and detect its gradual change. (a) shows Google Earth high-resolution images in a site of western South Sudan (26.01°E, 7.22°N) in the north belt of woodlands as an example. A pronounced increase in tree cover was presented from 2013 to 2020, according to Google Earth images, which is consistent with the positive trend in tree cover of our results. Due to the limitation in acquisition times of high spatial resolution images, earlier images were not found on the site.
Figure 8. High spatial resolution images from Google Earth in three sites as examples. (a) Site 1 in South Sudan (26.01°E, 7.22°N), (b) site 2 in Zambia (31.18°E, 13.49°S), and (c) site 3 in the Central African Republic (19.02°E, 5.29°N).
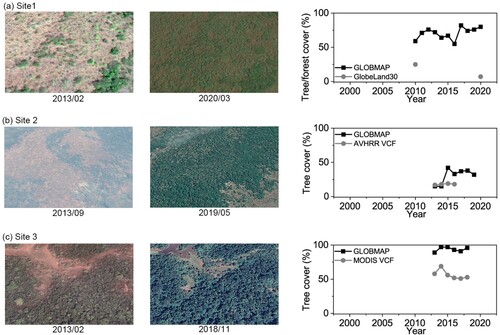
Linear trend map derived from AVHRR VCF data indicated that 5.27% of the pixels showed significant positive trends in percent tree cover ( (b)), and almost the same area proportion of the pixels showed significant negative trends (5.23%). Over 60% of the downward pixels show declining in tree cover at a rate greater than −0.5%/year. Forest gain in the north belt of woodlands was demonstrated by AVHRR VCF data, similar to our results. A pronounced forest loss was exhibited in the deciduous woodlands in the south of the Congo basin, which showed more loss areas compared with our results. This might be related to the different spatial resolutions of the two datasets. The resolution of AVHRR VCF is 8 km, much coarser than that of the GLOBMAP fractional tree cover data (250 m). Subtle and gradual changes in tree cover could be missed using images at a coarse spatial resolution, while the data at a fine spatial resolution would capture detailed forest gain and loss information. Besides, the study period of the two data was not the same, which probably affected the results of the forest trends. (b) shows an example in eastern Zambia (31.18°E, 13.49°S) in southeastern Africa, where deforested patches were dominated according to AVHRR VCF, yet a significant forest gain was detected in our results. The high spatial resolution images from Google Earth suggested that the tree cover increased from 2013 to 2019.
MODIS VCF linear trend map indicated significant downward slopes in 40.15% of the pixels ( (c)), which represented fourth times the pixels that showed significant upward slopes (10.88%). This product had a low percentage of pixels with fast decreasing trends in tree cover, and about 94% of the negative pixels decreased at a rate of −0.5%∼0%/year. Hotspots of forest loss detected by MODIS VCF data were distributed across the whole continent except for the southernmost and northernmost regions, while the spatial pattern of forest gain was unclear from the map. This disagrees with our results and annual mean LAI trend that showed an explicit forest gain and LAI increase in the north belt of woodlands. The possible reason may be the reported disadvantages of low interannual stability of MODIS VCF (Yang and Crews Citation2019), which leads to substantial temporal fluctuations and makes it hard to determine robust change trends. Furthermore, tree cover in sparse forests was overestimated, and that in dense forests was underestimated in the data (Sexton et al. Citation2013), which helps to explain the high proportions of pixels with slight negative and positive trends. High spatial resolution images in the southern of the Central African Republic (19.02°E, 5.29°N) from Google Earth ( (c)) presented forest gain in the region from 2013 to 2018. This is more in agreement with the increased tree cover of GLOBMAP, compared with the negative trend from MODIS VCF.
Unlike other products, forest gain and loss were mapped separately, covering different study periods in the GFC product. A substantial forest cover loss of 66 million ha from 2000 to 2020 was indicated by GFC data, while only about 4 million ha of forest cover gain was demonstrated from 2000 to 2012 ( (d-e)). The loss area was almost sixteen times the area of forest gain. This may be because the data focus on the forest cover loss other than gain (Guo et al. Citation2022). In addition, annual forest cover loss maps generated in GFC lack a distinction between permanent loss and disturbances with subsequent regrowth (Curtis et al. Citation2018), easily overestimating forest cover loss and causing confusion when comparing findings with other products.
The dynamics of African forests were assessed using fractional tree cover data in this study. Compared with categorical forest maps defining forests as the land with a tree cover reaching a certain threshold, the fractional tree cover data depicts the area proportion covered by trees in a pixel, which enables it to capture forest density increase caused by natural regrowth and gradual restoration. The spatio-temporal trend obtained in this study is consistent with the change patterns of annual mean LAI ( (f)), and is also supported by the studies based on NDVI, Net Primary Productivity (NPP), and fractional woody cover data (Mitchard and Flintrop Citation2013; Ugbaje et al. Citation2017; Venter, Cramer, and Hawkins Citation2018), whose assessment concluded positive trend in vegetation greenness, productivity and woody cover in the continent. The hotspots of positive slopes were also identified in the north (from Guinea countries to South Sudan) and south (from Zambia to Mozambique) belts of woodlands and savannas. This indicated that GLOBMAP tree cover data could capture forest density change within pixels, making it possible to track the gradual changes in savannas and woodlands mixed by trees and herbaceous vegetation in Africa. These results were not conflicted with the severe deforestation occurring in Africa documented by some previous studies using satellite-based forest cover loss maps (DeFries et al. Citation2010; Aleman, Jarzyna, and Staver Citation2018). The purpose of the latter studies focused on mapping forest loss and degradation rather than gradual regrowth (Mitchard and Flintrop Citation2013). Additionally, deforestation was reported to occur principally in Miombo woodlands at the south of the equator (Pelletier et al. Citation2018). This finding agrees with our assessment, demonstrating decreasing trends in tree cover in southeastern Africa. The conclusion of a net gain in tree cover across Africa in our study indicated that lands undergoing forest gain might exceed the areas that suffered deforestation and degradation. The forest gain was perhaps related to the growth of secondary forests in deforested patches (Potapov et al. Citation2012), woody plant encroachment (Stevens et al. Citation2017), and afforestation by sustainable forest management.
4.2. Analysis of drivers of forest change
To learn the driving roles of climate factors on forest change in Africa, linear trends of annual accumulated precipitation and mean temperature and their correlation with tree cover were quantified (). In sub-Saharan Africa, linear trend maps of annual accumulated precipitation ( (a)) and annual mean temperature ( (b)) both showed different change patterns in various regions. Precipitation and temperature trends demonstrated significant upward slopes in most areas of the north belt stretching from Guinea, crossing through Sudan to the Ethiopia highlands, corresponding to the net forest gain. A significant upward precipitation tendency and a downward temperature tendency were found in the central Congo basin and its southern margin. Both forest gain and loss occurred in the regions. On the contrary, southeastern Africa from Mozambique to South Africa was dominated by decreased precipitation and increased temperature with substantial forest loss, which indicated that precipitation might be a critical factor affecting forest growth.
Figure 9. Linear trend and correlation coefficient maps for precipitation and temperature in Africa over 2000–2020. The spatio-temporal trend of (a) annual accumulated precipitation and (b) annual mean temperature. Pearson’s correlation coefficient between tree cover and (c) annual accumulated precipitation and (d) annual mean temperature. Grey color areas exhibited no significant trend or correlation at the 95% confidence level. White color areas exhibited no forest-covered (Pixels with tree cover approximately 0% of more than 18 years from 2000 to 2020).
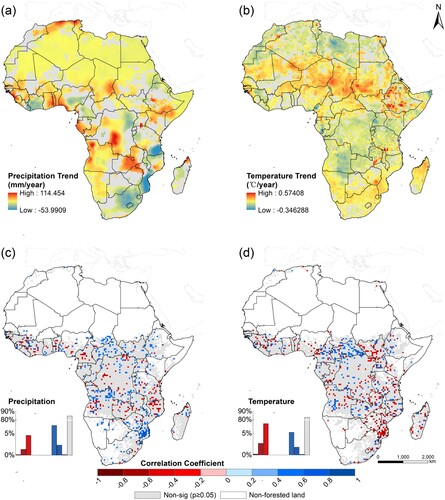
(c-d) presents the correlation of climatic drivers with tree cover. Results demonstrated that only a few forested areas were significantly driven by precipitation or temperature (15.40% and 17.40%, respectively). More positive correlations (9.31%) between precipitation and tree cover were estimated than the negative correlation (6.05%) in Africa. Hotspots, where increased rainfall promoted forest density, were found in the north belt of woodlands and savannas and part of the south of the Congo basin. The north belt of tree-covered areas is the transition zone between a tropical desert climate and a savanna climate with scarce rainfall. Thus, the increasing precipitation contributed to local forest gain, corroborated by previous studies (Staver, Archibald, and Levin Citation2011; Venter, Cramer, and Hawkins Citation2018). The negative effect of temperature on tree cover (10.16%) was demonstrated to be greater than the positive effect (7.21%) in Africa. The raised temperature in southeastern countries of Africa resulted in forest loss. It was probably because local miombo woodlands were distributed in a dry and hot climate. The increasing temperature evaporated the soil moisture, possibly destroying trees’ growth (Pelletier et al. Citation2018).
Although the analysis of the effects of fires and human activities on forest dynamics is outside the scope of this study, these drivers should not be ignored. Fires were considered a restrained factor of forest at low rainfall (Staver, Archibald, and Levin Citation2011). Other than the threat from natural wildfires, human-set fires were reported to play a risky role in forests of Africa (Wood et al. Citation2022). Besides, another important cause of forest loss in Africa was human-induced deforestation (Brandt et al. Citation2017; Abera et al. Citation2022), which resulted from the increasing demand for livelihoods due to population expansion, the development of commercial and livestock agriculture and agricultural transformation (Mograbi et al. Citation2017; Brandt et al. Citation2018). The deforestation hotspots were clustered in tropical forests, such as the south-central Congo basin and East Africa. Our analysis also suggested notable forest loss in these regions. Nevertheless, the impacts of human activities are not always negative. To cope with the severe desertification and land degradation, some countries in Africa have implemented ecological projects in recent years. One of the notable efforts is the Africa Great Green Wall Initiative launched in 2007, aiming to restore 100 million hectares of land by 2030 in the Sahel countries (Nzabarinda et al. Citation2021). Our results also show upward trends of tree cover in these countries, particularly in Chad and Ethiopia (), which indicates the ecological improvement in these regions.
4.3. Limitations and prospects
The changes in African forests were assessed using the GLOBMAP fractional tree cover product in this study. This dataset extracts the tree cover based on the distinctive shape characteristics of seasonal spectral curves of trees and herbaceous vegetation during the growing season. The greenness of trees usually exhibits a plateau with satellite NDVI value being stable around high value during the vegetation maturity period, while the NDVI seasonal curve of herbaceous vegetation shows a parabolic shape with an opening downward (Liu and Liu Citation2020). However, woody plants, mainly trees and shrubs, show greenness plateaus during the maturity period. Respective covers of the two components were both included in this product. Thus, it is unclear whether the net area gain in tree cover in Africa resulted from forest recovery or shrub encroachment. Shrub encroachment is a sacrifice of trees and grassland, which may reduce the spatial heterogeneity of the structure in vegetation biomes and reduce biodiversity (Marston et al. Citation2017). Therefore, it would help to further understand the dynamics of forests to distinguish tree and shrub cover in Africa.
Another limitation is that the tree cover data used in this study is at a spatial resolution of 250-m. It might miss forested areas with extraordinarily low tree cover, particularly in the transition zones between the Sahara Desert and woodlands. Forest patches in the regions are fragmented and may be missed in the 250-m pixel, which would introduce uncertainty in change analysis. It would be beneficial to assess the dynamics of forests in key ecological regions by mapping the tree canopies using fine-resolution data, which may capture the sparse tree cover in these regions and help to improve the change analysis (Zhang et al. Citation2019).
In addition, the linear correlation and two climatic factors, namely annual accumulated precipitation and annual mean temperature, were used in this study to quantify the driving roles of climate on forest change, but with a weak relationship. More interesting insights would be obtained if the seasonal variation and geographical patterns of climatic factors were considered jointly. Moreover, forest dynamics in Africa are not simply dominated by these two factors, and the impacts of human activities and wildfires cannot be ignored (Curtis et al. Citation2018). If the driving roles of other factors, such as population size, urban construction, agricultural development and wildfire, could be quantified using nonlinear analytical models (such as a random forest), it would be helpful to offer more valuable suggestions for regional forest management and conservation.
5. Conclusions
This study assessed the dynamics of forests in Africa during 2000–2020 using a fractional tree cover dataset. The change trend and magnitude of slopes of tree cover over the last two decades across Africa were estimated. The interannual forest area gain and loss in different vegetation biomes were evaluated, respectively. We further identified hotspots of forest changes. Results concluded that forest area showed a net gain over 2000–2020 in Africa, with an increase rate of 3.59 million ha/year. The linear trend map indicated the dominant upward tendency of tree cover at a mean rate of 0.50 ± 1.45%/year. Initial open and sparse forests with a tree cover of less than 70% increased faster than closed forests (tree cover ≥ 70%). The north belt of woodlands and savannas, stretching from Guinea countries, crossing through Sudan to the Ethiopia highlands, was identified as hotspots for forest gain. Meanwhile, forest loss has been occurring widely in the past twenty years. The forest area loss increased in the first ten years, then changed slowly and stably in the following years. The downward trend was concentrated in forested areas in the east of the Congo basin and the southern part of Africa. The net change rate in forest area of woodland biomes was the fastest (2.28 million ha/year), followed by the rainforests (0.80 million ha/year) and savannas (0.34 million ha/year). Area of forest gain and loss of the top ten hotspots countries covered over 70% of the total gain or loss area in the continent, primarily distributed in the north belt of woodlands, and South and Southeast Africa, respectively. Countries in Central Africa experienced both significant forest gain and loss.
This study used GLOBMAP fractional tree cover product to estimate the changes in forest density within pixels. Large-scale mixed tree-grass systems were covered in Africa, fractional tree cover data can improve the assessment of the dynamics of forest density for this mixed system. This work may help African countries to formulate forest management and conservation policies. The assessment of African forest dynamics will further provide strategies for the continent to implement reducing emissions from deforestation and forest degradation (REDD+) and develop sustainable use of terrestrial ecosystems proposed by SDG15. Many high-resolution remote sensing imageries are currently available, which could help to improve the monitoring of African forests. It is proposed to apply Sentinel-2 and Landsat data at a fine spatial resolution to assess the forest change over the past decades and evaluate its impacts on the carbon cycle in further study.
Acknowledgements
We thank Eskew, Kyle D. from the University of Oklahoma for assistance with English writing of our study. We are grateful to the following data providers: Land Processes Distributed Active Archive Center for AVHRR Vegetation Continuous Fields product and MOD44B Version 6 Vegetation Continuous Fields yearly product; National Geomatics Center of China for GlobeLand30 maps; The Global Land Analysis and Discovery laboratory at the University of Maryland for the Global Forest Change product; National Centre for Atmospheric Science in the UK for the CRU TS climate data; and Google Earth for high spatial resolution imageries.
Disclosure statement
No potential conflict of interest was reported by the author(s).
Funding
This work was supported by the National Key Research and Development Program of China (No. 2019YFA0606603), the Strategic Priority Research Program of the Chinese Academy of Sciences (No. XDA19080303), the National Natural Science Foundation of China (No. 42161144001), and the Youth Innovation Promotion Association of Chinese Academy of Sciences (No. 2019056).
Data availability
The GLOBMAP fractional tree cover product that support the findings of this study are available from the corresponding author upon request.
References
- Abera, T. A., J. Heiskanen, E. E. Maeda, B. T. Hailu, and P. K. E. Pellikka. 2022. “Improved Detection of Abrupt Change in Vegetation Reveals Dominant Fractional Woody Cover Decline in Eastern Africa.” Remote Sensing of Environment 271. doi:10.1016/j.rse.2022.112897.
- Aleman, J. C., M. A. Jarzyna, and A. C. Staver. 2018. “Forest Extent and Deforestation in Tropical Africa Since 1900.” Nature Ecology & Evolution 2 (1): 26–33. doi:10.1038/s41559-017-0406-1.
- Alkama, R., and A. Cescatti. 2016. “Biophysical Climate Impacts of Recent Changes in Global Forest Cover.” Science 351 (6273): 600–604. doi:10.1126/science.aac8083.
- Bera, B., S. Bhattacharjee, N. Sengupta, and S. Saha. 2021. “Dynamics of Deforestation and Forest Degradation Hotspots Applying geo-Spatial Techniques, Apalchand Forest in Terai Belt of Himalayan Foothills: Conservation Priorities of Forest Ecosystem.” Remote Sensing Applications: Society and Environment 22: 100510. doi:10.1016/j.rsase.2021.100510.
- Bodart, C., A. B. Brink, F. Donnay, A. Lupi, P. Mayaux, and F. Achard. 2013. “Continental Estimates of Forest Cover and Forest Cover Changes in the dry Ecosystems of Africa Between 1990 and 2000.” Journal of Biogeography 40 (6): 1036–1047. doi:10.1111/jbi.12084.
- Brandt, M., P. Hiernaux, K. Rasmussen, C. Mbow, L. Kergoat, T. Tagesson, Y. Z. Ibrahim, A. Wele, C. J. Tucker, and R. Fensholt. 2016. “Assessing Woody Vegetation Trends in Sahelian Drylands Using MODIS Based Seasonal Metrics.” Remote Sensing of Environment 183: 215–225. doi:10.1016/j.rse.2016.05.027.
- Brandt, M., C. Mbow, A. A. Diouf, A. Verger, C. Samimi, and R. Fensholt. 2015. “Ground- and Satellite-Based Evidence of the Biophysical Mechanisms Behind the Greening Sahel.” Global Change Biology 21 (4): 1610–1620. doi:10.1111/gcb.12807.
- Brandt, M., K. Rasmussen, P. Hiernaux, S. Herrmann, C. J. Tucker, X. Y. Tong, F. Tian, et al. 2018. “Reduction of Tree Cover in West African Woodlands and Promotion in Semi-Arid Farmlands.” Nature Geoscience 11 (5): 328. doi:10.1038/s41561-018-0092-x.
- Brandt, M., K. Rasmussen, J. Penuelas, F. Tian, G. Schurgers, A. Verger, O. Mertz, J. R. B. Palmer, and R. Fensholt. 2017. “Human Population Growth Offsets Climate-Driven Increase in Woody Vegetation in sub-Saharan Africa.” Nature Ecology & Evolution 1 (4). doi:10.1038/s41559-017-0081.
- Bucini, G., and N. P. Hanan. 2007. “A Continental-Scale Analysis of Tree Cover in African Savannas.” Global Ecology and Biogeography 16 (5): 593–605. doi:10.1111/j.1466-8238.2007.00325.x.
- Buitenwerf, R., W. J. Bond, N. Stevens, and W. S. W. Trollope. 2012. “Increased Tree Densities in South African Savannas: > 50 Years of Data Suggests CO2 as a Driver.” Global Change Biology 18 (2): 675–684. doi:10.1111/j.1365-2486.2011.02561.x.
- Bullock, E. L., S. P. Healey, Z. Q. Yang, P. Oduor, N. Gorelick, S. Omondi, E. Ouko, and W. B. Cohen. 2021. “Three Decades of Land Cover Change in East Africa.” Land 10 (2). doi:10.3390/land10020150.
- Chen, J., Y. F. Ban, and S. N. Li. 2014. “Open Access to Earth Land-Cover map.” Nature 514 (7523): 434–434. doi:10.1038/514434c.
- Chen, J., J. Chen, A. P. Liao, X. Cao, L. J. Chen, X. H. Chen, C. Y. He, et al. 2015. “Global Land Cover Mapping at 30 m Resolution: A POK-Based Operational Approach.” ISPRS Journal of Photogrammetry and Remote Sensing 103: 7–27. doi:10.1016/j.isprsjprs.2014.09.002.
- Cui, Y., and X. Li. 2022. “A new Global Land Productivity Dynamic Product Based on the Consistency of Various Vegetation Biophysical Indicators.” Big Earth Data 6 (1): 36–53. doi:10.1080/20964471.2021.2018789.
- Cuni-Sanchez, A., M. J. P. Sullivan, P. J. Platts, S. L. Lewis, R. Marchant, G. Imani, W. Hubau, et al. 2021. “High Aboveground Carbon Stock of African Tropical Montane Forests.” Nature 596 (7873): 536. doi:10.1038/s41586-021-03728-4.
- Curtis, P. G., C. M. Slay, N. L. Harris, A. Tyukavina, and M. C. Hansen. 2018. “Classifying Drivers of Global Forest Loss.” Science 361 (6407): 1108–1111. doi:10.1126/science.aau3445.
- DeFries, R. S., C. B. Field, I. Fung, C. O. Justice, S. Los, P. A. Matson, E. Matthews, et al. 1995. “Mapping the Land-Surface for Global Atmosphere-Biosphere Models – Toward Continuous of Vegetations Functional Properties.” Journal of Geophysical Research-Atmospheres 100 (D10): 20867–20882. doi:10.1029/95jd01536.
- DeFries, R. S., M. C. Hansen, and J. R. G. Townshend. 2000. “Global Continuous Fields of Vegetation Characteristics: A Linear Mixture Model Applied to Multi-Year 8 km AVHRR Data.” International Journal of Remote Sensing 21 (6-7): 1389–1414. doi:10.1080/014311600210236.
- DeFries, R. S., T. Rudel, M. Uriarte, and M. Hansen. 2010. “Deforestation Driven by Urban Population Growth and Agricultural Trade in the Twenty-First Century.” Nature Geoscience 3 (3): 178–181. doi:10.1038/ngeo756.
- Deng, F., J. M. Chen, S. Plummer, M. Chen, and J. Pisek. 2006. “Algorithm for Global Leaf Area Index Retrieval Using Satellite Imagery.” IEEE Transactions on Geoscience and Remote Sensing 44 (8): 2219–2229. doi:10.1109/tgrs.2006.872100.
- Estoque, R. C., B. A. Johnson, Y. Gao, R. DasGupta, M. Ooba, T. Togawa, Y. Hijioka, et al. 2021. “Remotely Sensed Tree Canopy Cover-Based Indicators for Monitoring Global Sustainability and Environmental Initiatives.” Environmental Research Letters 16 (4). doi:10.1088/1748-9326/abe5d9.
- Fagan, M., D. H. Kim, W. Settle, L. Ferry, J. Drew, H. Carlson, J. Slaughter, et al. 2022. “The Expansion of Tree Plantations Across Tropical Biomes.” Nature Sustainability 5 (8): 681–688. doi:10.1038/s41893-022-00904-w.
- FAO and UNEP. 2020. “The State of the World’s Forests 2020: Forests, Biodiversity and People.” https://www.unep.org/resources/state-worlds-forests-forests-biodiversity-and-people.
- Gerard, F., D. Hooftman, F. van Langevelde, E. Veenendaal, S. M. White, and J. Lloyd. 2017. “MODIS VCF Should not be Used to Detect Discontinuities in Tree Cover due to Binning Bias. A Comment on Hanan et al. (2014) and Staver and Hansen (2015).” Global Ecology and Biogeography 26 (7): 854–859. doi:10.1111/geb.12592.
- Guo, J., P. Gong, I. Dronova, and Z. Zhu. 2022. “Forest Cover Change in China from 2000 to 2016.” International Journal of Remote Sensing 43 (2): 593–606. doi:10.1080/01431161.2021.2022804.
- Guo, H., D. Liang, F. Chen, and Z. Shirazi. 2021. “Innovative Approaches to the Sustainable Development Goals Using big Earth Data.” Big Earth Data 5 (3): 263–276. doi:10.1080/20964471.2021.1939989.
- Hansen, M. C., R. S. DeFries, J. R. G. Townshend, M. Carroll, C. Dimiceli, and R. A. Sohlberg. 2003. “Global Percent Tree Cover at a Spatial Resolution of 500 Meters: First Results of the MODIS Vegetation Continuous Fields Algorithm.” Earth Interactions 7. doi:10.1175/1087-3562(2003)007<0001:GPTCAA>2.0.CO;2.
- Hansen, M. C., P. V. Potapov, R. Moore, M. Hancher, S. A. Turubanova, A. Tyukavina, D. Thau, et al. 2013. “High-Resolution Global Maps of 21st-Century Forest Cover Change.” Science 342 (6160): 850–853. doi:10.1126/science.1244693.
- Harris, I., T. J. Osborn, P. Jones, and D. Lister. 2020. “Version 4 of the CRU TS Monthly High-Resolution Gridded Multivariate Climate Dataset.” Scientific Data 7 (1). doi:10.1038/s41597-020-0453-3.
- Heumann, B. W., J. W. Seaquist, L. Eklundh, and P. Jonsson. 2007. “AVHRR Derived Phenological Change in the Sahel and Soudan, Africa, 1982-2005.” Remote Sensing of Environment 108 (4): 385–392. doi:10.1016/j.rse.2006.11.025.
- Holdo, R. M., D. A. Onderdonk, A. G. Barr, M. Mwita, and T. M. Anderson. 2020. “Spatial Transitions in Tree Cover are Associated with Soil Hydrology, but not with Grass Biomass, Fire Frequency, or Herbivore Biomass in Serengeti Savannahs.” Journal of Ecology 108 (2): 586–597. doi:10.1111/1365-2745.13303.
- Jansen, L. J. M., and A. Di Gregorio. 2002. “Parametric Land Cover and Land-use Classifications as Tools for Environmental Change Detection.” Agriculture Ecosystems & Environment 91 (1-3): 89–100. doi:10.1016/s0167-8809(01)00243-2.
- Kranz, O., E. Schoepfer, R. Tegtmeyer, and S. Lang. 2018. “Earth Observation Based Multi-Scale Assessment of Logging Activities in the Democratic Republic of the Congo.” ISPRS Journal of Photogrammetry and Remote Sensing 144: 254–267. doi:10.1016/j.isprsjprs.2018.07.012.
- Levick, S. R., and K. H. Rogers. 2011. “Context-dependent Vegetation Dynamics in an African Savanna.” Landscape Ecology 26 (4): 515–528. doi:10.1007/s10980-011-9578-2.
- Liu, Y., and R. G. Liu. 2020. “A Simple Approach for Mapping Forest Cover from Time Series of Satellite Data.” Remote Sensing 12 (18). doi:10.3390/rs12182918.
- Liu, Y., R. Liu, and J. M. Chen. 2012. “Retrospective Retrieval of Long-Term Consistent Global Leaf Area Index (1981-2011) from Combined AVHRR and MODIS Data.” Journal of Geophysical Research-Biogeosciences 117. doi:10.1029/2012jg002084.
- Marston, C. G., P. Aplin, D. M. Wilkinson, R. Field, and H. J. O'Regan. 2017. “Scrubbing Up: Multi-Scale Investigation of Woody Encroachment in a Southern African Savannah.” Remote Sensing 9 (5). doi:10.3390/rs9050419.
- Miller, C. S., W. D. Gosling, D. B. Kemp, A. L. Coe, and I. Gilmour. 2016. “Drivers of Ecosystem and Climate Change in Tropical West Africa Over the Past Similar to 540 000 Years.” Journal of Quaternary Science 31 (7): 671–677. doi:10.1002/jqs.2893.
- Mishra, N. B., K. A. Crews, N. Neeti, T. Meyer, and K. R. Young. 2015. “MODIS Derived Vegetation Greenness Trends in African Savanna: Deconstructing and Localizing the Role of Changing Moisture Availability, Fire Regime and Anthropogenic Impact.” Remote Sensing of Environment 169: 192–204. doi:10.1016/j.rse.2015.08.008.
- Mitchard, E. T. A., and C. M. Flintrop. 2013. “Woody Encroachment and Forest Degradation in sub-Saharan Africa's Woodlands and Savannas 1982-2006.” Philosophical Transactions of the Royal Society B-Biological Sciences 368 (1625). doi:10.1098/rstb.2012.0406.
- Mitchard, E. T. A., S. S. Saatchi, F. F. Gerard, S. L. Lewis, and P. Meir. 2009. “Measuring Woody Encroachment Along a Forest-Savanna Boundary in Central Africa.” Earth Interactions 13. doi:10.1175/2009ei278.1.
- Mograbi, P. J., G. P. Asner, E. T. F. Witkowski, B. F. N. Erasmus, K. J. Wessels, R. Mathieu, and N. R. Vaughn. 2017. “Humans and Elephants as Treefall Drivers in African Savannas.” Ecography 40 (11): 1274–1284. doi:10.1111/ecog.02549.
- Nzabarinda, V., A. M. Bao, W. Q. Xu, S. Uwamahoro, M. Udahogora, E. D. Umwali, A. Nyirarwasa, and J. Umuhoza. 2021. “A Spatial and Temporal Assessment of Vegetation Greening and Precipitation Changes for Monitoring Vegetation Dynamics in Climate Zones Over Africa.” ISPRS International Journal of Geo-Information 10 (3). doi:10.3390/ijgi10030129.
- Pelletier, J., A. Paquette, K. Mbindo, N. Zimba, A. Siampale, B. Chendauka, F. Siangulube, and J. W. Roberts. 2018. “Carbon Sink Despite Large Deforestation in African Tropical dry Forests (Miombo Woodlands).” Environmental Research Letters 13 (9). doi:10.1088/1748-9326/aadc9a.
- Potapov, P. V., S. A. Turubanova, M. C. Hansen, B. Adusei, M. Broich, A. Altstatt, L. Mane, and C. O. Justice. 2012. “Quantifying Forest Cover Loss in Democratic Republic of the Congo, 2000-2010, with Landsat ETM Plus Data.” Remote Sensing of Environment 122: 106–116. doi:10.1016/j.rse.2011.08.027.
- Sexton, J. O., X.-P. Song, M. Feng, P. Noojipady, A. Anand, C. Huang, D.-H. Kim, et al. 2013. “Global, 30-m Resolution Continuous Fields of Tree Cover: Landsat-Based Rescaling of MODIS Vegetation Continuous Fields with Lidar-Based Estimates of Error.” International Journal of Digital Earth 6 (5): 427–448. doi:10.1080/17538947.2013.786146.
- Shimada, M., T. Itoh, T. Motooka, M. Watanabe, T. Shiraishi, R. Thapa, and R. Lucas. 2014. “New Global Forest/non-Forest Maps from ALOS PALSAR Data (2007-2010).” Remote Sensing of Environment 155: 13–31. doi:10.1016/j.rse.2014.04.014.
- Skowno, A. L., M. W. Thompson, J. Hiestermann, B. Ripley, A. G. West, and W. J. Bond. 2017. “Woodland Expansion in South African Grassy Biomes Based on Satellite Observations (1990-2013): General Patterns and Potential Drivers.” Global Change Biology 23 (6): 2358–2369. doi:10.1111/gcb.13529.
- Song, X. P., M. C. Hansen, S. V. Stehman, P. V. Potapov, A. Tyukavina, E. F. Vermote, and J. R. Townshend. 2018. “Global Land Change from 1982 to 2016.” Nature 560 (7720): 639. doi:10.1038/s41586-018-0411-9.
- Staver, A. C., S. Archibald, and S. Levin. 2011. “Tree Cover in sub-Saharan Africa: Rainfall and Fire Constrain Forest and Savanna as Alternative Stable States.” Ecology 92 (5): 1063–1072. doi:10.1890/10-1684.1.
- Stevens, N., C. E. R. Lehmann, B. P. Murphy, and G. Durigan. 2017. “Savanna Woody Encroachment is Widespread Across Three Continents.” Global Change Biology 23 (1): 235–244. doi:10.1111/gcb.13409.
- Tucker, C. J., J. E. Pinzon, M. E. Brown, D. A. Slayback, E. W. Pak, R. Mahoney, E. F. Vermote, and N. El Saleous. 2005. “An Extended AVHRR 8-km NDVI Dataset Compatible with MODIS and SPOT Vegetation NDVI Data.” International Journal of Remote Sensing 26 (20): 4485–4498. doi:10.1080/01431160500168686.
- Ugbaje, S. U., I. O. A. Odeh, T. F. A. Bishop, and J. L. Li. 2017. “Assessing the Spatio-Temporal Variability of Vegetation Productivity in Africa: Quantifying the Relative Roles of Climate Variability and Human Activities.” International Journal of Digital Earth 10 (9): 879–900. doi:10.1080/17538947.2016.1265017.
- Venter, Z. S., M. D. Cramer, and H. J. Hawkins. 2018. “Drivers of Woody Plant Encroachment Over Africa.” Nature Communications 9. doi:10.1038/s41467-018-04616-8.
- Venter, Z. S., S. L. Scott, P. G. Desmet, and M. T. Hoffman. 2020. “Application of Landsat-Derived Vegetation Trends Over South Africa: Potential for Monitoring Land Degradation and Restoration.” Ecological Indicators 113. doi:10.1016/j.ecolind.2020.106206.
- Wang, M. M., G. J. He, N. Ishwaran, T. H. Hong, A. Bell, Z. M. Zhang, G. Z. Wang, and M. Wang. 2020. “Monitoring Vegetation Dynamics in East Rennell Island World Heritage Site Using Multi-Sensor and Multi-Temporal Remote Sensing Data.” International Journal of Digital Earth 13 (3): 393–409. doi:10.1080/17538947.2018.1523955.
- Wimberly, M. C., F. K. Dwomoh, I. Numata, F. Mensah, J. Amoako, D. M. Nekorchuk, and A. McMahon. 2022. “Historical Trends of Degradation, Loss, and Recovery in the Tropical Forest Reserves of Ghana.” International Journal of Digital Earth 15 (1): 30–51. doi:10.1080/17538947.2021.2012533.
- Wingate, V. R., S. R. Phinn, and N. Kuhn. 2019. “Mapping Precipitation-Corrected NDVI Trends Across Namibia.” Science of the Total Environment 684: 96–112. doi:10.1016/j.scitotenv.2019.05.158.
- Wood, E., M. Mgaya, C. Andrews, K. Schreckenberg, J. A. Fisher, I. Grundy, and C. M. Ryan. 2022. “Intentions Behind Common and Risky Fires in South-Eastern Tanzania.” African Journal of Range & Forage Science 39 (1): 124–135. doi:10.2989/10220119.2021.2000026.
- Yang, X., and K. Crews. 2019. “Applicability Analysis of MODIS Tree Cover Product in Texas Savanna.” International Journal of Applied Earth Observation and Geoinformation 81: 186–194. doi:10.1016/j.jag.2019.05.003.
- Zhang, W. M., M. Brandt, Q. Wang, A. V. Prishchepov, C. J. Tucker, Y. M. Li, H. Lyu, and R. Fensholt. 2019. “From Woody Cover to Woody Canopies: How Sentinel-1 and Sentinel-2 Data Advance the Mapping of Woody Plants in Savannas.” Remote Sensing of Environment 234. doi:10.1016/j.rse.2019.111465.