
ABSTRACT
In recent years, RS and GIS technologies have played an increasingly important role in various aspects of rainfall induced landslide research. In order to systematically understand their application situation, this paper extensively used various visualization analysis technologies for in-depth analysis of 1,161 documents collected by the WOS data platform in the past 27 years by combining quantitative and qualitative methods. Then, this article focuses on sub domain analysis from four aspects: landslide detection and monitoring, prediction models, sensitivity mapping, and risk assessment. The study found that the number of literature in this field has steadily increased and is expected to continue to rise. This literature review has attracted widespread attention from the academic community, but it is challenging to meet research needs. Frequent and effective cooperation between countries, institutions, and authors is very beneficial for promoting progress in this field. The future development direction is a new intelligent hybrid model that integrates multiple research methods. This study can provide researchers in this field with the core research force, hot topic evolution, and future development trends of future rainfall-induced landslides and contribute to landslide prevention and control decision-making and achieving the United Nations’sustainable development goals.
1. Introduction
The landslide is a complex system dynamics process controlled by multiple factors. Many factors trigger landslide hazards, among which rainfall is the most critical inducing factor (Donati and Turrini Citation2002; Li et al. Citation2021; Mekrishu et al. Citation2022). The hazard caused by the deformation and failure of slopes due to rainfall is called rainfall-induced landslides hazards (Wieczorek and Glade Citation2005), the world's most widely distributed and most frequent landslide hazard. Ubydul Haque et al. conducted a statistical analysis of landslides in 128 countries around the world from 1995 to 2014. They found that rainfall-induced landslides accounted for 85%, and there was a significant correlation between landslides and rainfall events in space and time (Haque et al. Citation2019). Melanie, J. F. and David, N.P. made a spatiotemporal analysis of the global non-seismic landslide dataset during 2004-2016. The result showed that 79% of the non-seismic landslide events were caused by rainfall (Froude and Petley Citation2018). During 2011-2016, Fanyu Zhang et al. collected all landslides in China and proved that 94.2% of the landslides were related to rainfall (Zhang and Huang Citation2018). These rainfall-induced landslides disasters have caused heavy losses of life and property (Aristizábal and Sánchez Citation2020; Jain et al. Citation2021; Martha et al. Citation2019 Matziaris et al. Citation2015; Orense and Sapuay Citation2006; Park, Oh, and Park Citation2021;), and aroused widespread concern in society and great attention from various countries (Dai, Lee, and Wang Citation2003; Yilmaz Citation2009).
However, rainfall landslides mainly occur in mountainous and hilly areas and are accompanied by severe rainstorm weather. Sudden, hidden, and challenging field investigations characterize them. Their research has always been one of the hard problems in natural disasters. (Pourghasemi, Mohammady, and Pradhan Citation2012; Sharma and Shakya Citation2008). It is difficult to find hidden dangers and guarantee the timeliness and accuracy of spatiotemporal information analysis of landslide hazards by the traditional manual investigation and screening methods. With the rapid development of geo-information science and new generation of information technology, RS and GIS technologies have been widely used in recent decades, providing more reliable research methods for rainfall-induced landslides (Chen, Chue, and Chen Citation2013; Manfré et al. Citation2012). The environmental factors such as topography, landform, vegetation coverage, and land use type can be obtained, calculated, and analyzed under the advantages of RS and GIS technologies, which are very suitable for researching rainfall-induced landslides hazards (Abdallah et al. Citation2005). Scholars explored the essential characteristics, influencing factors, instability mechanism, deformation mechanism, stability, and dynamic aspects of rainfall-induced landslides by widely using RS and GIS technologies for the effective detection, forecast, early warning, prevention, and control of rainfall-induced landslides hazards. We have reviewed previous literature and used it as the starting point for our research. The essential documents that are up-to-date, most cited, most frequently used at all times, and most used in the last 180 days in the research field of rainfall-induced landslides hazards can be found by the sorting function of WOS. See for the review of the four representative documents, which are the core references in this research.
Table 1. Table for the Review of Representative Documents.
Although scholars have done a lot of research in this field, there is still a lack of comprehensive and detailed sorting and summary on the study of RS and GIS technology in rainfall landslides. These documents show the readers such problems from different angles:
What is the temporal and spatial distribution of the number of documents issued in this field? What is the highly cited literature? What is the status quo of scientific research cooperation analysis?
What are the representative concerns of these documents? What is the development trend in the future?
What research methods do scholars prefer in terms of central topics in this field, such as landslide detection and monitoring, prediction model, sensitivity mapping, analysis and evaluation, and how effective are they?
If the above problems are analyzed in depth, it will help the rainfall landslide researchers to broaden their thinking and carry out adequate research combined with their work. Analyzing previous review papers, it was found that most of them mainly focused on describing a particular region rather than the world, and the comprehensiveness of the research was lacking. Furthermore, few people have paid attention to the bibliometric analysis of literature in this field, which has a low degree of visualization and is difficult to intuitively reflect the application of RS technology and GIS technology in studying rainfall-induced landslides disasters. In addition, the literature database samples are old, and difficult to track emerging technologies and methods, which cannot reflect the research hotspots in this field in recent years and predict future development trends. Given this, this paper retrieved 1,161 documents published during 1995–2022 from the document data platform of WOS based on the comprehensive analysis of previous research results and comprehensively reviewed the achievements of the global RS and GIS technologies in the rainfall-induced landslides hazards geoinformatics research. The paper deeply explored the research topics and hotspots through the scientific application of document analysis functions of the WOS document data platform and various document visualization tools, mainly introducing the research progress in four landslide detection and monitoring sub-fields, predictive model analysis, susceptibility mapping, and risk assessment. Then, the limitations of literature data, four sub-areas, and econometric analysis results during this study were discussed, corresponding solutions were proposed, and how the study could provide some assistance to policymakers and UN SDGs. Finally, the advantages of using bibliometric analysis software for visual analysis in this study were summarized, revealing the core research strengths, hot topic evolution, and future trends of rainfall-induced landslides geoinformatics in the future.
2. Material and methods
2.1. Document retrieval and processing
This paper took the WOS document data platform as the data source for analysis, and the retrieval time was July 18, 2022. The search settings were TS = ‘landslide’ AND ‘GIS’ AND ‘rain*’ and TS = ‘landslide’ AND ‘RS’, of which ‘*’ represented a wildcard character, ‘rain*’ contained multiple subject words: ‘rainfall-induced’, ‘rainfall’, ‘rainfall-triggered’, ‘torrential rain’, ‘high-rainfall’, ‘heavy rainfall’ and so forth. We set the data source as ‘Search in: Web of Science Core Collection’ in the WOS document data platform. Selected the citation index as ‘Editions: All’, the document fields as ‘Topic’ and the retrieval time as ‘Publication: All years (1900-2022)’. 1,328 records from 1995 to 2022 were retrieved from the WOS document data platform. To ensure the accuracy and relevance of the document and facilitate the document management and visualization analysis of the software, the raw data needs to be downloaded in different formats and provided with preparations such as terms unification, sorting and deduplication, and item-by-item screening. For this, a flow chart () was drawn to illustrate the strategies of document data collection, screening, and sorting.
Figure 1. Number of documents published and cited quantity.
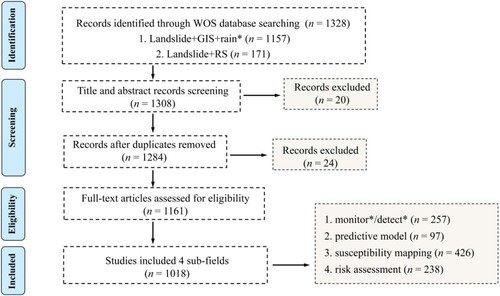
Firstly, the retrieved documents were ‘added to the tag list’ in the resulting interface of the WOS document data platform so that the bibliometric analysis function of WOS could be used to analyze the retrieval results quantitatively. Then, the data format (*.ris) was used to download, which was convenient for Endnote to browse documents and manage references. The tabular data format (*.xls) was adopted to download to realize document collation and data analysis in Excel. The data format (*.txt) was applied to download to facilitate visualization analysis of the software. Since different papers used different names for terms with the same meaning to improve the accuracy of document analysis, the words were unified, as shown in . After being de-duplicated according to title and DOI, the two researchers screened and summarized the documents based on the document inclusion and exclusion criteria and the document information, such as titles, keywords, and abstracts. The inclusion criteria were that the research object is a rainfall-induced landslides and the research contents involve the application of RS and GIS technologies in geoinformatics. The exclusion criteria were as follows: (1) the study subjects were not rainfall-type landslides, such as earthquakes, tsunamis, hurricanes, forest fires, human activities, and other landslides as the main inducing factors. (2) Literature with no correlation between the research content and RS and GIS technology. After the ambiguous and uncertain contents were submitted to the third researchers for judgment and determined through group meetings, 1,161 accurate records were obtained to form a document sample database. Finally, in the result of the document sample database, the keywords such as ‘monitor*’, ‘detect*’, ‘predictive model’, ‘susceptibility mapping’, ‘risk assessment’ were further retrieved for document refining, and the keys documents in the four sub-fields were extracted, sorted and combed according to time, number of citations and download counts in combination with professional knowledge.
Table 2. Unified terms.
2.2. Visualization analysis method
Visualization analysis is mainly applied for massive data correlation analysis and can perform a correlation analysis of data and make a complete analysis chart with the aid of manual operation (Elejalde, De Elejalde, and Heitman Citation1985). This paper made a visualization analysis of the application and development trend of RS and GIS technologies in the rainfall-induced landslides geoinformatics research field by extensively using various document analysis tools such as WOS document data platform, VOSviewer, SCImago Graphica, Pajek and Citespace. First, click on the ‘Analyze Retrieval Results’ in the WOS document data platform and select the publication year, country/region, publication title, research direction, and other functional modules from the list of marked document results to provide primary data for the visualization analysis of this paper.
VOSviewer is a kind of software for the visualization analysis of documents. In 2009, Van Eck and Waltman (Citation2010) proposed VOSviewer at the 12th International Conference on Scientometrics and Informetrics (ISSI), attracting attention from the academic circle. Retrieval found that a document on the VOSviewer program was cited more than 4,000 times, indicating that VOSviewer had been widely used for document analysis in various fields (Cobo et al. Citation2011; Leydesdorff, Carley, and Rafols Citation2013). However, VOSviewer has only been used in research on landslide hazards in recent three years (Bovi et al. Citation2022; Kaur and Sood Citation2020; Yang et al. Citation2022a). This paper mainly made inter-country cooperation analysis and high-frequency keywords analysis with VOSviewer (version 1.6.16) software, used SCImago Graphics for global geographic visualization analysis of the document, and combined with Pajek for keyword node separation. As two easy-to-use document visualization analysis software, SCImago Graphica and Pajek can be downloaded and used for free at https://graphica.app/ and http://mrvar.fdv.uni-lj.si/pajek/be2.htm.
With apparent advantages in co-occurrence networks and research trend visualization analysis (Chen Citation2017; Ding et al. Citation2021; Yang et al. Citation2017), CiteSpace has been favored by many scholars since it was developed. In particular, CiteSpace, together with VOSviewer for visualization analysis, can achieve complementary advantages and is a good tool for mining research hotspots and development trends (Ding and Yang Citation2020; Markscheffel and Schröter Citation2021; Xu, Yu, and Wang Citation2019; Yang et al. Citation2022b). In light of this, this paper used Citespace (version 6.1. R2) for author cooperation, institutional cooperation, keyword clustering analysis, and timeline analysis and also combined with VOSviewer for research hotspots and trend analysis.
3. Results
3.1. Spatio-temporal distribution of number of documents published
Statistics of the number of papers published and cited in this research field during 1995–2022 were made according to time sequence, as shown in . The results indicated that the number of documents published and cited shows an increasing trend as a whole, reflecting that the application of RS and GIS technologies in this field has attracted more and more attention from many scholars.
Figure 2. Number of documents published and cited quantity.
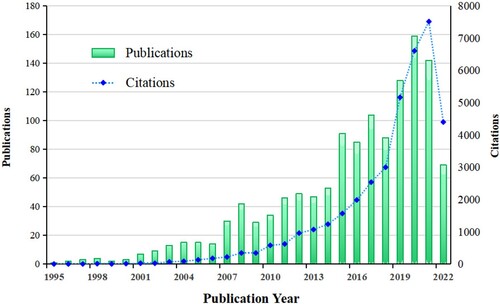
The first stage (1995-2007) was the preliminary application stage: The number of documents published and cited in this stage was small, but there were research results every year. The research in this filed began in 1995 and coincided with the ‘An International Decade for Natural Hazard Reduction’ mid-term of the United Nations. Under the background that the landslide hazard research was being carried out in full swing after first applying GIS technology to the analysis of rainfall-induced landslides hazards, WU, WM. et al. proposed a slope stability model (dSLAM) (Wu and Sidle Citation1995) and integrated the contour-line topographic analysis and GIS technology for spatial data extraction and display, which had a significant impact on subsequent scholars (Ozdemir and Turoglu Citation2007; Qiao Citation2004; Tarantino, Blonda, and Pasquariello Citation2004; Wang et al. Citation2007; Yang et al. Citation2001). The second stage (2008-2014) was the development and application stage: a few scholars began to focus on integrating RS and GIS technologies and predicting rainfall-induced landslides through artificial intelligence modeling (Kavoura and Sabatakakis Citation2020 Liu, Du, and Yi Citation2022;; Park et al. Citation2011). What contributed most was that in 2013, Tehrany, Pradhan, and Jebur (Citation2013) researched the spatial prediction of flood-prone areas by using the statistical model integrated with the decision tree (DT) and GIS, which was cited 371 times, indicating that the hybrid intelligence method integrating RS and GIS technologies and artificial intelligence method has significantly contributed to the subsequent research on rainfall-induced landslides hazards. The third stage (2015-2022) was a rapid development stage: The number of documents published and cited increased significantly compared with that of the previous two stages. The number of papers published in 2017 exceeded 100, reached a peak of 159 in 2020, but declined slightly in 2021, showing an increasing trend as a whole. In 2022, although there was no complete statistics on research results, the number of a document published reached 69, and the number of citations also acquired 4,399, which showed that scholars had paid more attention to the research value of this field (Jiang et al. Citation2020 Mondal and Mandal Citation2018;).
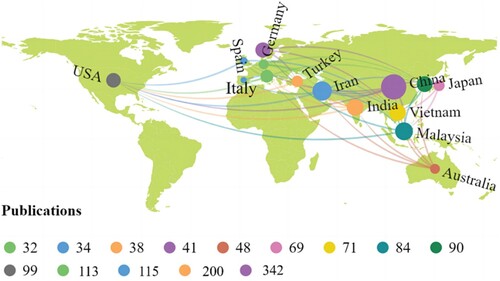
The analysis of the document results in the WOS document data platform showed that 89 countries or regions had published papers in this field. From , it is clearly seen that the research in this field was widely distributed worldwide. The circular node represents the number of publications in the country. The larger the number of publications, the larger the node. The specific numbers are shown in the legend below . The connections between nodes indicate the relations between countries. With the most significant number of papers published, China is the only country that has published more than 300 papers, which correlates closely with the characteristics of high density, high frequency, and wide distribution of rainfall-induced landslides in China and the large number of funds invested in landslide hazard prevention and control research. According to the statistical data of Petley (Citation2012), the number of deaths caused by landslide hazards in China during 2004–2010 was 6,860, which ranked first in the world and was significantly higher than that of other countries. Besides, countries such as Italy and the United States, etc., were deeply affected by rainfall-induced landslides hazards.
Figure 3. National Geographic visualization with more than 30 articles posted(by VOSviewer and Scimago).
The detailed distribution of the journals that rank in the top 5 in the number of documents published was obtained after the document sample database was processed, as shown in . The journals that rank in the top 10 in the number of documents published were authoritative journals with international reputations, indicating that high-level international researchers have gradually recognized the research in this field. It can be seen intuitively from that with the most significant number of papers published, Natural Hazards has published 84 articles, accounting for 7.24% of the total number of papers published. Since 2002, Natural Hazards has published papers in this field and successively posted documents on RS and GIS technologies in landslide spatial analysis (Wang, Sassa, and Xu Citation2007), landslide susceptibility mapping (Yalcin and Bulut Citation2007), risk analysis (Gentile, Bisantino, and Trisorio Liuzzi Citation2008), hazard zoning (Kouli et al. Citation2010), etc., with a total number of citations of 2,462 and an average number of sources of 123 per year. The journal not only had the highest total number of documents published but also was more frequently published (4) and cited every year, which showed that its influence ranks first. In 1999 (Bonomi and Cavallin Citation1999), Geomorphology was the first to publish papers in this field, with the highest total number of citations (4,334) and the highest average annual number of citations (188), showing that the journal has made significant contributions to this research field. With the highest annual average number of papers published, Environmental Earth Sciences published five articles, which meant that the journal focuses more on this research field. Although Remote Sensing was the last concern about this field (Teshebaeva et al. Citation2015), it had a prominent position in the number of papers published or the annual number of articles cited. Journals such as Catena (25), Journal of Mountain Science (22), and Sustainability (21) had a relatively large number of papers published and were the primary sources of documents in this field. Most of these journals originated from geoscience, engineering technology, environmental science, and other areas, playing an essential role in promoting the development of this field. Furthermore, 25 journals published more than ten papers, accounting for 59.17% of the published papers. In general, the distribution of journals was diverse and scattered, and it was a common consensus to pay attention to the importance of applying RS and GIS technologies to the research of rainfall-induced landslides geo-informatics field.
Table 3. Distribution of journals(TOP 5).
3.2. Analysis of highly cited documents
In the document sample database in this paper, the top 5 copies with the highest number of citations are shown in . The highly cited articles that rank first and second were both from Dai, F.C. Team. In nearly 27 years of research in this field, the two papers of the team have been cited 29 and 26 times per year, respectively, which showed that Dai, F.C. et al. had made significant influences in this field, and also proved that the small number of review documents have essential reference value for subsequent research, and more review documents in this field need to be systematically summarized and deeply analyzed in the future.
Table 4. Highly cited literature information table(TOP 5).
With the third highest number of citations, and as a review paper, it was cited 684 times, which further explained the necessity and importance of the review documents. Having been studied earlier, documents ranked fourth in the number of citations were the documents at the beginning of the second research stage (2008-2014) in this research field, and also the early documents on the combination of RS and GIS technologies with intelligent methods, which were forward-looking. In the follow-up research, many documents on new hybrid intelligent algorithms were published one after another, which once again proved that mixed intelligent methods are hot topics in this research field. Finally, although the document with the fifth highest number of citations was published at the preliminary exploration stage of this research field, its popularity has not decreased. It has been cited 439 times, playing an essential role in guiding subsequent scholars to use GIS technology to carry out rainfall-induced landslides research and showing that this field has been widely concerned by the academic circle.
3.3. Analysis of scientific research cooperation
In terms of the analysis of author cooperation and high productivity author, the data in the document sample database was retrieved and imported into CiteSpace (version 6.1.R2) for processing. To facilitate the clear display of the documents-based knowledge mapping (Chen Citation2004; Chen Citation2006; Chen Citation2016), the software parameters were set first, and the time span was selected as 1995-2022. The time slice was set as follows: the node type was selected as Author, Pathfinder, and MST were chosen for tailoring the network mapping, and the remaining parameters were selected as default values. Using the CiteSpace author co-occurrence and cooperation analysis function, the core author groups and their cooperative relationships were visualized in . The authors published more than 30 papers, and their representative works are shown in . In , a dot represents an author. The large the dot radius is, the more papers the author publishes. The lines between the dots represent the scientific research cooperation between the authors. shows a specific relationship between most authors, which is reflected in multiple core author groups. The largest core author group is centered on PRADHAN B, and the core author group is closely related to other author groups. indicates that the team publishes 57 papers, which have been cited 6,106 times in total, and ranks first in the number of articles published and the total number of citations, showing that the team is the most influential core author group in this field. The second-ranked core author group is the BUI T author group. indicates that the core author group is also closely related to other core author groups. Still, its scientific research cooperation is not as extensive as that of the PRADHAN B core author group. intuitively shows that the BUI T team publishes 40 papers, which have been cited 4,507 times, and makes a lot of contributions to this field. demonstrates that although the core author groups of the third-ranked PHAMT and the fourth-ranked CHEN W have more academic exchanges with other scientific research teams, their cooperation is not as extensive and close as that of the previous two core author groups.
Figure 4. The authors’ partnership is co-present (by CiteSpace).
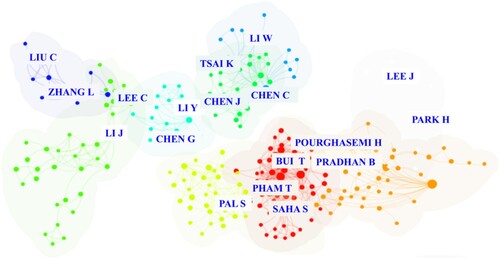
also seems to suggest that the PHAMT and CHEN W author groups are weaker than the previous two core author groups in terms of both the number of papers published and the total number of citations, indicating that the more they cooperate with other research teams, the more articles they will print and the more the papers will be cited. In addition, except for a few large core author groups, the nodes of the remaining author groups are scattered and not closely correlated with each other and do not form a robust clustering, suggesting that the scientific research teams have not established close cooperation and communication and started a trend of cooperative research, and also indicating that they mainly carry out independent research in this field. Still, the breadth and depth of their study are inferior to that of the previous core author groups. Overall, the number of author nodes in this field is large, showing that the application of RS and GIS technologies in the geoinformatics analysis of rainfall-induced landslides is a research field that researchers are very interested in.
Table 5. High Productivity Authors and Representative Works (Over 30).
The data downloaded from the WOS document data platform was imported VOSviewer (version 1.6.16) to obtain a visualization analysis network map of cooperation between countries relying on the county cooperation function of VOSviewer software and taking the country name as the node. As shown in , the number of rectangular nodes represents the number of countries, and the larger the area of the rectangular node is, the more papers are published by the government. The line between rectangular nodes reflects the cooperation between countries. The more the number of lines, the more extensive the scientific research cooperation is. The closer the lines are, the closer the relationship between them is.
Figure 5. Network diagram of cooperation between countries(by VOSviewer ).
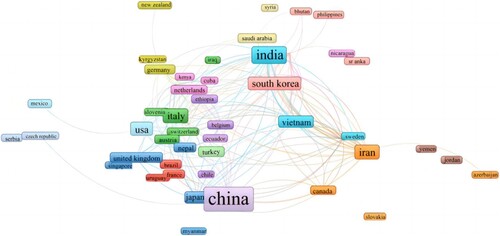
The research results have showed that the lines between rectangular nodes are dense and complex, indicating that there are many cooperative relationships between different countries. With the largest area of corresponding rectangular nodes, and the largest number of papers published, China has the largest area of corresponding rectangular nodes, published the most papers, and connected more rectangular nodes. Although cooperation with other countries is frequent to some extent, it is still in a marginal position and has not yet become an essential bridge in international collaboration. Countries that are second only to China regarding the number of papers published and cooperative influence are India, Italy, Iran, etc. The rectangular nodes where these countries are located are large in area, and there are more lines between the rectangular nodes and other countries, suggesting that these countries occupy relatively core positions in this research field with more significant research influence. Other sporadically scattered countries are not directly linked to other countries but can be indirectly linked to other countries through neighboring countries. The analysis shows that these relatively discrete countries, due to limited scientific research resources, are difficult to form their advantages in the field of disciplines, coupled with geographical constraints and other factors, cannot directly cooperate with more countries in scientific research.
According to the WOS document data platform statistics, 1,292 research institutions have carried out research in this field, of which only one institution has published more than 50 papers, and 58 institutions have published more than ten papers. From (a), it can be seen that the largest cooperative relationship group includes Chinese Acad Sci, China Univ Geosci, Univ Chinese Acad Sci, Xian Univ Sci & Technol, Chengdu Univ Technol, and China Univ Min & Technol, etc., which have formed a stable and close relationship and are from China, indicating that these institutions are significantly affected by geographical factors.
Figure 6. Cooperative analysis and mutation testing (by CiteSpace).
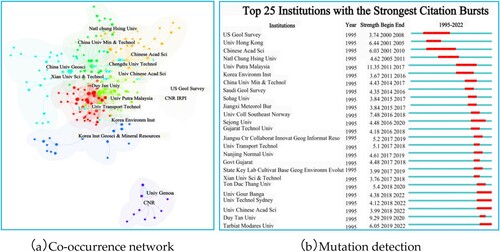
In order to reflect the time sequence and duration of research carried out by various institutions in this field, the ‘Burstterms’ function of the CiteSpace software has been applied for the mutation detection of institution names during 1995–2022 to obtain the top 25 mutation institution names in this field, representing the famous institutions during this period. As shown in (b), Column 1 is the short name of institution names, and Column 2 is the year in which the research started. Column 3 represents the increased intensity of the citation frequency of the institution, which can also be understood as the quantized value of the institution's influence in this research field. The years in Columns 4 and 5 represent the years when the institution appeared and ended in this research field respectively. The red strip represents the mutation duration. It's not hard to see that US Geol Survey first stood out in this field in 2000, followed by Univ Hong Kong and Chinese Acad Sci, which became active in this research field in 2001, of which Chinese Acad Sci is an institution for mutation research, with the most extended period of 9 years from 2001 to 2010. Univ Putra Malaysia had the most significant increase in the intensity value of the citation frequency, which was 11.35, suggesting that the institution's research results had attracted much attention during 1995-2022. The four institutions of Univ Gour Banga, Univ Technol Sydney, Univ Chinese Acad Sci, and Tarbiat Modares Univ have been actively engaged in the geoinformatics analysis of rainfall-induced landslides until now. They will continue to conduct relevant research in the future. Because the cooperation among countries, institutions, and disciplines is limited by geographical location, it is suggested that researchers abandon the concept of space and strengthen academic exchanges using network meetings without considering geographical boundaries.
3.4. Analysis of research hotspots and trend
The keywords involved in this field were displayed in a collinear network relation topic mapping by making use of the visualization method of VOSviewer software, taking keywords as the node and combining with Pajek's node separation function, as shown in . The width of rectangular nodes represents the keyword frequency. The wider the rectangle is, the more prominent the node is, indicating that the keyword frequency is higher. The line between rectangular nodes represents the correlation between keywords. The thicker the line is, the darker the color is, and the closer the connection between keyword nodes will be. The same color of rectangular nodes means that the keywords belong to the same topic. A total of 6 keyword topics have been obtained through the analysis of keyword frequency. It is not difficult to see that as the most frequent keyword, ‘gis’ is at the core of the red topic and is also the focus and hotspot of the topic research.
Figure 7. Keywords co-present theme map(by VOSviewer and Pajek).
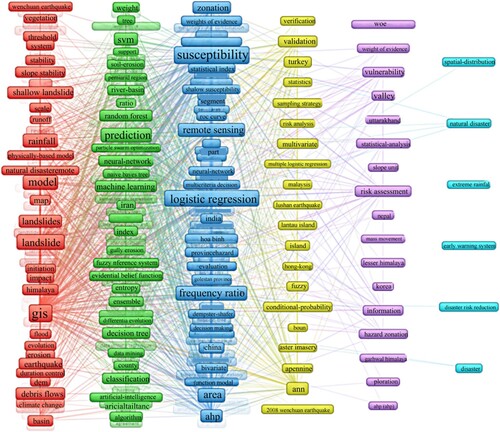
For the keywords like ‘model’, ‘landslide’, and ‘rainfall’ that are closely related to it have the same red color as‘gis’. Moreover, the rectangular nodes where these keywords are located have large widths, prominent integrity, and more divergent lines, indicating that they are high-frequency words and also hot topics of the topic research. Besides, the View clearly shows that keywords such as ‘prediction’, ‘logistic regression’, ‘ann’, ‘risk assessment’, and ‘national hazard’ appear more frequently. Their rectangular nodes are green, light blue, yellow, purple, and cyan, meaning these are the core keywords in the topic they belong to. However, the closer the case to the right is, the more discrete the node is. The fewer the lines between rectangular nodes and other nodes are, indicating that the main research topics in this field are different in heat or depth, and the closer to the right side of the view is, the more it will show a downward trend.
To more clearly show the node topic of keywords and mine research hotspots (Chen, Ibekwe-SanJuan, and Hou Citation2010), CiteSpace software was used to cluster the document keywords into 10 clusters (Saha et al. Citation2021; Van Dao et al. Citation2020; Zhu et al. Citation2021). The color of the clustering tags was consistent with the color of the clustering nodes. The keyword clustering analysis map is shown in after sorting.
Figure 8. Keyword cluster analysis map (by CiteSpace).
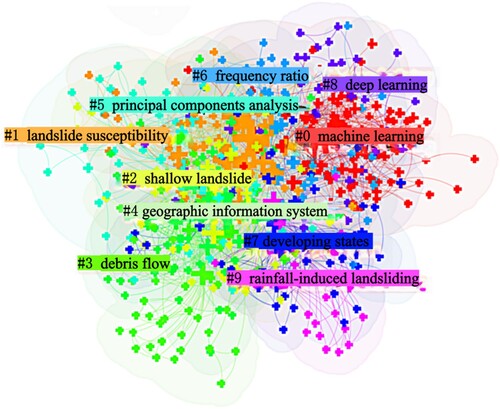
The map has formed a total of 628 nodes and 2,937 lines, and the line density is 0.0149. The clustering information module value Modularity Q = 0.4211 (>0.3), indicates that the clustering community structure is significant. Furthermore, the map silhouette coefficient Weighted Mean Silhouette S = 0.7259 (>0.5) suggests that this cluster has high overall homogeneity and is convincing. The largest cluster is the #9 rainfall-induced landslides. Although this cluster has a significant structure, its scale is the smallest and the average year for the research is the oldest (2004), indicating that the cluster is in a stable development stage, but does not achieve innovative results temporarily. The cluster with the latest average research year is #8 deep learning. Although this cluster appeared late, it has many terms and is in the rise stage, and its main research contents include ‘logistic regression’,‘decision tree’ and ‘multilayer perceptron’, etc. In addition, there are many highly cited documents in cluster #8 deep learning. Most of the documents published in the past five years have high number of citations, proving the great potential of deep learning in the research of rainfall-induced landslides.
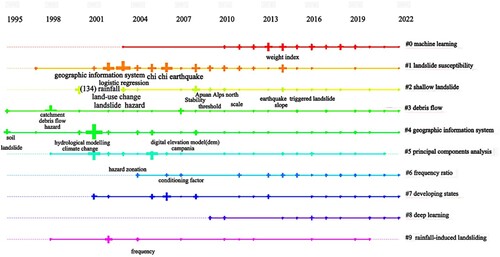
The function of ‘Timeline View’ in CiteSpace was run to generate clustering tags and draw a keyword clustering timeline graph, as shown in . Each clustering tag occupies one line, and the timeline represents the year the keyword first appeared. The two clusters first appeared (1995) are #3 debris flow and #4 geographic information systems. The nodes on the axis of the cluster #3 debris flow are sparser than those on the axis of the cluster #4 geographic information system, showing that the research of the cluster #4 geographic information system is more popular and broader than that of the #3 debris flow. In addition, the most significant node appeared in the #4 geographic information system, which means the GIS technology is the foundation of the research in this field. On the whole, since 2007, there have been no new nodes, which indicates that the research enthusiasm has declined. However, the two clusters are still being studied continuously, suggesting that the two clusters are still the research directions at present and in the future. The cluster #5 principal components analysis appeared late (1997). Still, the distribution density of its nodes has remained the largest till now, showing that the research of this cluster is the most concerned hotspot direction for scholars. It's worth noting that the order in which the nodes appear shows that the annual ring-shaped nodes are denser, and will be greatly reduced in later period. Since 2014, there have been basically no new nodes, which demonstrated that susceptibility analysis has not made much breakthrough in the research of rainfall-induced landslides in recent years, and the cluster has entered a stage of steady development. By contrast, the cluster #1 machine learning appeared later (2003), and had smaller and sparser nodes in early period, but since 2011, new nodes have frequently appeared, suggesting that machine learning has entered the research booming stage, and become the development trend of this research field. The analysis found that the cluster #8 deep learning was the last to appear (2009), and did not have many nodes on the axis, which shows that the cluster has been studied for a short time, does not have many research results and has not made breakthrough research achievements. Although the #8 deep learning is still in the initial stage and has many research gaps, the timeline for this cluster has been continued to the present, indicating that it will be one of the research directions in the future.
Figure 9. Keyword cluster analysis map (by CiteSpace).
4. Research sub-fields
As there are many classification methods in sub-fields, this paper summarized and discussed mainly the four sub-fields of landslide detection and monitoring, predictive model analysis, susceptibility mapping, and risk assessment by combining with multiple analysis results such as spatial–temporal distribution characteristics of the number of papers published, clustering analysis, hotspots, and evolution trends, keyword cloud maps and separation results and comprehensively considering the application of RS and GIS technologies in rainfall-induced landslides. Based on the WOS document data platform, the document samples related to this research content were marked ‘monitor*’, ‘detect*’, ‘predictive model’, ‘susceptibility mapping,’ and ‘risk assessment’ was taken as the retrieval words to extract the documents in four sub-fields.
4.1. Landslide detection and monitoring
How to quickly detect and dynamically monitor landslide data with high precision is an important research topic in geoinformatics analysis of rainfall-induced landslides hazards, which is of great significance for preventing and controlling rainfall-induced landslides hazards (Han et al. Citation2022; Shi et al. Citation2020). In 1998, people realized that it is difficult to distinguish the dangers of individual landslide hazards by qualitative methods, but quantitative methods shall be adopted. Chowdhury and Flentje (Citation1998) conducted quantitative research on the relationship between the underground shear movement and rainfall through the historical recurrence and monitoring of individual landslides based on the GIS accurate geological and landslide map and landslide database and verified it in Australia. The continuous increase of remote sensing data and GIS functions has created opportunities for more precise and rapid detection and monitoring of rainfall-induced landslides (Hussain et al. Citation2005; Singh, Maurya, and Dwivedi Citation2021). Many scholars have successively developed many new methods based on RS and GIS technologies to further improve the stability and accuracy of landslide detection and monitoring from different perspectives. The representative cases are shown in .
Table 6. Typical Cases of Landslide Detection and Monitoring.
High-quality remote sensing images are helpful for researchers to identify the losses before and after landslide events and the exposure of hazard-bearing bodies (Martha et al. Citation2012). With the aid of the GIS technology platform, a variety of remote sensing-based satellite image processing technologies can be used to extract helpful environment and hazard-causing information in landslide areas. Different remote sensing platforms have their advantages (Argyriou et al. Citation2022). The identification and extraction of small-scale landslide data via the uncrewed aerial vehicle (UAV) and semi-global dense matching (SGM) can achieve cm-level accuracy (Al-Rawabdeh et al. Citation2016). Unlike traditional optical and microwave remote sensing, airborne LiDAR can quickly obtain a high-resolution and high-precision digital elevation model (DEM), which has strong advantages in-ground detection. The obtained topographic data has a resolution of 1 meter in the horizontal direction and 0.15 meter in the vertical direction (Chen Citation2006), which is suitable for measuring the decimeter-to-meter level topographic changes in the specific research areas rainfall-induced landslides hazards. For example, the potential hazard areas of rainfall-induced landslides hazards can be easily identified using the natural topography after vegetation removal (Vega Citation2019). With the advantages of high spatial resolution and low comprehensive cost, interferometric synthetic aperture radar (InSAR) is particularly suitable for large-scale continuous tracking and observation. It has obvious advantages in detecting rainfall-induced landslides phenomena (Nakano et al. Citation2016; van Natijne et al. Citation2022; Zhao et al. Citation2012), landslide mass identification, landslide factor extraction, change monitoring, etc. In the landslide detection and monitoring stage, InSAR will continue to be the mainstream method for a long time in the future, with visible light as an auxiliary means. At the same time, the single standards will continue to be replaced by an integrated monitoring system that combines multiple monitoring technologies. Remote sensing data and multi-temporal images have become valuable alternative sources for disaster assessment in areas with limited field investigation potential. However, the complexity of rainfall-induced landslides requires effective object-oriented landslide detection methods to define object features from RS data. In the future, fast and automatic landslide detection methods, such as WebGIS systems for landslide detection and prediction (Yang et al. Citation2023), are worth paying attention to.
4.2. Predictive model analysis
The prediction is based on RS and GIS technology and an established spatiotemporal database, comprehensively analyzing various factors in the landslide area and using spatial analysis function and mathematical means to analyze and predict the possible location, scale, and shape of rainfall-induced landslides. The predictive model mainly processes the geographic input parameters into a single final model by various weighting and interpolation methods (i.e. statistical analysis, probability method, machine learning, expert knowledge, etc.) (Marjanovic, Bajat, and Kovacevic Citation2009). With the strong ability to learn and process complex data (Wang, Tian, and Cao Citation2021), machine learning is a part of artificial intelligence, while deep learning is a part of machine learning (McCarthy et al. Citation2006). As shown in , artificial intelligence has been applied to the field of rainfall-induced landslides since 1992 (Buisson et al. Citation1992) and mainly concentrated on exploring how to integrate artificial intelligence with GIS technology to solve the problem of landslide prediction. As a result, machine learning began to appear in the field of rainfall-induced landslides, opening a new round of application development of artificial intelligence, which has extensively promoted the vigorous development of rainfall-induced landslides research (Qing et al. Citation2020; Yuan et al. Citation2022; Zhao et al. Citation2020). As a new research direction of machine learning (ML) (Prakash, Manconi, and Loew Citation2020), deep learning was applied to the research of rainfall-induced landslides hazards in 2009, which inspired the construction of rainfall-induced landslides prediction models. Based on the analysis of research hotspots in Section 3.4, it can be seen that machine learning has made breakthrough progress in landslide prediction, sensitivity mapping, disaster assessment, and other aspects, which have extensively promoted the vigorous development of research on rainfall-induced landslides.
Table 7. Table of Typical Cases of Predictive Models.
4.3. Susceptibility mapping
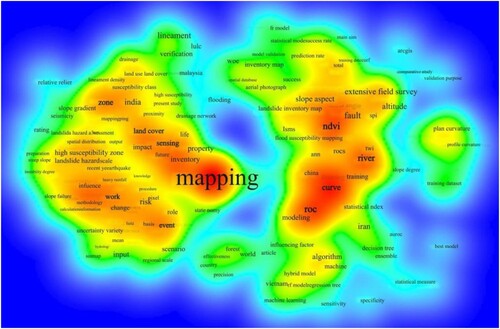
Landslide susceptibility mapping is a meaningful way and tool for geoinformatics analysis of rainfall-induced landslides, which is of great significance for land use planning and disaster reduction decision-making (Achour, Saidani, and Touati Citation2021; He et al. Citation2021; Liu et al. Citation2022). The VOSviewer software can be used to visualize the document keywords related to susceptibility mapping in the document sample database. The research thermodynamic diagram () clearly shows that the redder the color is and the more pronounced the font is, the more research will be conducted. The font of ‘mapping’ is the most obvious, and occupies a central position in rainfall-induced landslides research, which is very important for landslide prediction (Roccati et al. Citation2021), risk assessment, and identification of dangerous areas.
Figure 10. Sensitivity mapping to study the heat map(by VOSviewer).
The key to rainfall-induced landslides susceptibility mapping is to determine the influencing factors of regional landslides and select the appropriate methods. Different influencing factors were considered first. Then, the weight ratio of the factors was processed to judge the relationship between these factors and rainfall-induced landslides hazards and the influence degree. The occurrence of landslide hazards is often affected by many factors, and sometimes these factors will affect each other, so landslide susceptibility mapping is not a sample task. Fernández et al. (Citation1999) were the first to research GIS-based rainfall-induced landslides susceptibility mapping 1999, in which they compared with the previous ‘matrix’ method developed by GIS technology by calculating the correlation coefficient and determining the follow-up on-site evidence to verify the level of susceptibility assessment, proving that the susceptibility mapping can effectively explain the spatial distribution of rainfall-induced landslides and provide valuable information for the stability of large-scale areas. Since then, different researchers have developed various methods for susceptibility mapping. The most frequently cited was the research of Yalcin (Citation2008) on susceptibility mapping by the methods of analytic hierarchy process (AHP), statistical index (Wi), and weighting factor (Wf), which showed that analytical hierarchy process could more genuinely reflect the actual distribution of rainfall-induced landslides in the region. Different methods could be used for susceptibility mapping landslides based on the landslide scale and data availability. Kayastha, Dhital, and De Smedt (Citation2013) divided the susceptibility mapping methods into five categories: (1) direct field mapping, (2) landslide inventory analysis, (3) heuristic method, (4) statistical methods including fuzzy logic and artificial neural networks, (5) process-based conceptual modeling. The limitations of the inevitable landslide inventory and the complexity of influencing factors have increased the difficulty of producing LSMs. Achour, Saidani, and Touati (Citation2021) believe that traditional land awareness must be combined with the latest technologies, such as GIS and machine learning to compensate for the lack of information and landslide data sharing among organizations at all levels. The current research focuses on developing comprehensive susceptibility and hazard assessment models using statistical methods or machine learning algorithms. Drid et al. (Citation2022) used direct and indirect methods to test the Gully Erosion Susceptibility Maps (GESM) design model of K'sob watershed to help evaluate land degradation. Hybrid models can overcome the limitations of using a single method to simulate landslide sensitivity through the integration of various methods. Pham et al. (Citation2021)developed and compared six heterogeneous models and applied the heuristic method of Fuzzy Decision Making Trial and Evaluation Laboratory (FDEMATEL) - Analytic Network Process (ANP) to analyze landslide susceptibility. The study suggests that heuristic methods should be tested before directly applying machine learning models, and further exploration of heuristic techniques and deep learning methods should be conducted in the future.
4.4. Risk assessment
Risk assessment is the most basic and valuable step in preventing and controlling rainfall-induced landslides hazards (Liu et al. Citation2022). For the spatial distribution of rainfall-induced landslides risk, GIS technology was mainly used for the spatial subdivision of the research area. The spatial probability of landslides, the affected area, the spatial distribution of land use or population or property, and the vulnerability were calculated by multiplication (Leone, Asté, and Leroi Citation1996; Menggenang and Samanta Citation2017). Remote sensing can collect a wide range of data in a given time, which can divide the landslide hazard area by comparing and analyzing the relative importance of various influencing factors while saving time and cost and organizing remote sensing data and thematic maps (Arnous Citation2011; Samanta et al. Citation2011; Samanta et al. Citation2012).
In recent years, risk assessment has become an essential tool for solving the inherent uncertainty of rainfall-induced landslides hazards (Bhandary et al. Citation2013; Fu et al. Citation2020). The rainfall-induced landslides risk assessment technology based on RS and GIS technologies can be applied to different stages, from regional-scale development planning to local-scale site-specific assessment. As time went on, the factors to be considered were gradually enriched. Given this, ‘risk assessment’ was used as a keyword to further extract keywords from the document sample database in this research area, then these keywords were imported into the VOSviewer software to obtain a collinear keyword graph related to risk assessment. As shown in , Dark purple represents the earliest time (before 2015), while yellow represents the latest time (after 2019). Regarding research regions, Italy is a country that carried out this sub-filed research earlier, and Iran has paid great attention to the risk assessment of rainfall-induced landslides in recent years. In terms of influencing factors to be considered, human activities, earthquakes, soil erosion, and other factors were the factors that needed to be considered in the early stage. Since 2017, people have begun to consider the influences of roads, distance to obstacles, topography, etc. In recent years, the topographic humidity index (TWI) and river dynamic index (SPI) have gradually attracted the attention of scholars. In terms of research methods, there were few research methods in the early stage, especially before 2017. However, after 2017, the ways and means for rainfall-induced landslides risk assessment, such as weight of evidence (WOE), logistic regression (LR), support vector machine (SVM), and random forest (RF), gradually became abundant.
Figure 11. Collinear plot of the risk assessment studies(by VOSviewer).
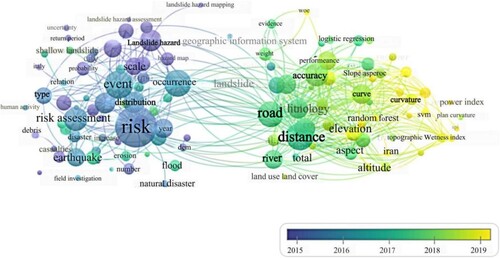
From this, it can be seen that scholars have always been paying great attention to the research on the evaluation of rainfall induced landslide disasters. Based on the continuous development of RS and GIS technology, the rationality of selecting risk assessment factors, research methods, and evaluation accuracy will show a continuous trend of progress.
5. Discussion
With the development of remote sensing multi-source sensors in spatial resolution, temporal resolution, radiation resolution, and spectral resolution, and the progress of GIS in data acquisition management, analysis modeling, and mapping methods, the research on geoinformatics of rainfall-induced landslides hazards has made significant progress. This paper is based on literature visualization analysis and provides the following discussions and suggestions:
Visualization analysis results: The literature review indicates that in the past 27 years, many articles have been published, and journals have been widely distributed, indicating the importance of this field. Since 2015, there has been a sharp increase in scientific achievements in this field, highlighting the increasing awareness of RS and GIS technology's application in rainfall-induced landslides. Countries such as China, India, and Iran rank among the top three in terms of publication volume, and countries such as Italy and the United States have also shown significant interest in this field. The number of publications is not only related to the situation of rainfall-induced landslides, but also to economic development, and countries with more foreign cooperation have more publications. The largest group of institutional partnerships, mainly from China, is significantly influenced by geographical factors. On the other hand, although comprehensive literature has received a lot of attention from the academic community, the overall publication volume is too small to meet the needs of the development of this field. Of course, this study also has certain limitations, only searching the WOS English database. Although the international scientific and technological community recognizes the WOS database as a database that reflects the level of scientific research, with strict screening criteria and citation indexing mechanisms, it can broadly represent research in this field. However, the analysis results may have slight deviations from the actual situation.
Monitoring means and methods: RS technology is mainly used, while GIS technology is less applied, while in the stage of landslide analysis, GIS is more applied, while RS technology is less applied. The rapid development of remote sensing technologies such as space radar, satellite remote sensing, uncrewed aerial vehicles (UAV), and the application of GIS technology has extensively promoted the rapid development of the geoinformatics analysis of rainfall-induced landslides. The comprehensive application of RS and GIS technologies in detecting and monitoring rainfall-induced landslides is mainly for remote sensing image classification and image analytical processing of landslide objects (Liu et al. Citation2021; Nhu et al. Citation2020; Pawluszek-Filipiak and Borkowski Citation2020). However, the accuracy of data processing depends largely on the resolution of satellite images. The review of documents shows that only a few studies on landslide detection and monitoring have been conducted in this field (Syzdykbayev, Karimi, and Karimi Citation2020). In particular, there is a lack of research on integrating a large number of data and correctly using high temporal, high spatial, high-radiation, and high spectral resolution. Besides, although modern remote sensing technology is superior to traditional detection and monitoring methods (Yaa’cob et al. Citation2020), due to their respective restrictions and shortcomings, they cannot rely on a single technical means to identify the potential hazards of rainfall-type landslides. Instead, they can better understand the spatiotemporal variation rules of rainfall-induced landslides by integrating with various standards and using multi-source data. With the rapid growth of landslide data sources, amounts, styles, and the constant improvement of artificial intelligence algorithms. The object-based image analysis (OBIA) detection method based on deep learning algorithms has been increasingly applied to landslide detection. It has shown good performance in terms of detection speed and freeing up manual recognition workload (Ghorbanzadeh, Gholamnia, and Ghamisi Citation2022).
Predictive model: Rainfall-induced landslides prediction requires accurate numerical values, but the complexity of the hazard mechanism often leads to uncertainty in the spatial forecast, making it challenging to predict landslides. The model methods mainly include qualitative, semi-quantitative, and quantitative methods. Qualitative methods that rely on expert capabilities have the advantage of high accuracy, while the disadvantage is limited application space and are subjective. Although the semi-quantitative approach considers other relevant factors on a qualitative basis and conducts statistical analysis, the results still have one-sidedness. The advantage of quantitative methods is that they feel more influencing factors and can quantitatively predict, but their accuracy is often low (Deng et al. Citation2022). Compared with traditional statistical methods, although modern artificial intelligence methods can provide more convenient analysis results, as the foundation of artificial intelligence is big data, rainfall-induced landslides often have insufficient data and strong suddenness, and they do not have big data characteristics. Also, single artificial intelligence algorithms, including the most promising deep learning algorithms, may have problems with local optimum (Li et al. Citation2022), overfitting, low training speed, and low image recognition accuracy. It can be said that the current research on solid artificial intelligence is basically in an inactive state, and the mainstream research is mainly focused on weak artificial intelligence. Of course, the research on rainfall-induced landslides based on RS and GIS technologies is no exception. Therefore, modern spatial information technology, especially various new types of hybrid intelligent methods formed by a precise combination of RS and GIS technologies and different artificial intelligence methods, will have more potential in rainfall-induced landslides prediction. Recently, researchers have found through comparative analysis that Random Subspace Credal Decision Tree (RSCDT) models can effectively improve the accuracy of landslide prediction, and its performance details are superior to individual models. This proves that ensemble models can become a novel and promising method for the spatial prediction of landslides in specific regions (Gui et al. Citation2023).
Susceptibility mapping: With the continuous development of RS and GIS technologies, the research on the geoinformatics of rainfall-induced landslides is deepening, and the classification methods of landslide susceptibility mapping are also changing. Except for the classification methods adopted by Kayastha, Dhital, and De Smedt (Citation2013), there are other classification methods for landslide susceptibility mapping, such as landslide inventory analysis, heuristic, and statistical methods. Pradhan, Seeni, and Kalantar (Citation2017) believed that qualitative and quantitative methods could draw landslide susceptibility mapping or can also be developed by statistical (Bathrellos, Kalivas, and Skilodimou Citation2009; Conoscenti et al. Citation2016; Schicker and Moon Citation2012) and physical (Baum et al. Citation2005; Montrasio, Valentino, and Losi Citation2011 Park, Nikhil, and Lee Citation2013;) methods based on the RS data and the GIS technology. A large number of studies on landslide susceptibility mapping have found that landslide susceptibility mapping technology can be divided into direct mapping (Van Westen, Rengers, and Soeters Citation2003) and indirect mapping (Chen and Song Citation2019; Shirzadi et al. Citation2017). In general, no matter what classification method is used, the inherent advantages and limitations of each susceptibility mapping method should be noted during the research. There is still no method that can be universally used for landslide susceptibility mapping. In recent years, to find more suitable processes, some researchers have gradually developed a new hybrid mapping model (Aghdam, Pradhan, and Panahi Citation2017;; Tien Bui et al. Citation2017 Vasu and Lee Citation2016), integrated the model with GIS by various methods, and achieved good results. In Ha Giang Province, Vietnam, multiple machine learning methods and weighting techniques were compared using limited data to produce LSMs, and it was found that the combination of RF and AHP had the best performance. This study provides a new approach to creating LSMs based on weighted machine learning methods (Trinh et al. Citation2022). Therefore, it is necessary to comprehensively understand each method's characteristics, advantages and disadvantages, and adaptability to improve the accuracy of rainfall-induced landslides susceptibility mapping.
Risk assessment: A landslide is a geological hazard caused by the coupling action of many factors. The difference between rainfall-induced landslides and other landslides is that they have different characteristics of inducing factors and environmental influencing factors. Using different parameters for risk assessment in a specific research area will directly affect the analysis result. Still, the selection of parameters usually depends on the local factors and data availability in the research area. Therefore, an open and comprehensive landslide inventory database is needed to link these influencing factors with rainfall-induced landslides risk assessment (Ibsen and Brunsden Citation1996; Martha et al. Citation2013; Pennington et al. Citation2015). Although the establishment and data update of the landslide inventory database is time-consuming and arduous, it has significant scientific research value and practical significance. It can further clarify the location, volume, type, inducement, frequency, and damage of rainfall-induced landslides (Guzzetti et al. Citation2012; Kirschbaum et al. Citation2010). Concerning the establishment and data update of the landslide inventory database, RS and GIS technologies should be widely used, and integrated with other rainfall-induced landslides risk assessment tools, to become a powerful tool for landslide inventory database establishment and risk assessment. On the other hand, landslide cataloging databases not only provide us with a large amount of risk assessment basis but also pose challenges to the integration ability of non-data businesses. The use of modern 3D GIS technology can provide intuitive and interactive 3D visualization of multi-source geographic big data, making professional landslide knowledge easier for decision-makers and the public to understand. A 3D GIS system that includes interactive route planning, real-time text, images, and other information has just been developed, and most of its functions are implemented using open-source projects (Yang et al. Citation2023).
With the help of information visualization technology, this study systematically combs the application process of RS and GIS technology with rainfall landslides as the research object. Excavate machine learning, landslide sensitivity, and shallow landslides as the three most critical topic groups, among which machine learning is the most popular research topic. The latest information technologies and intelligent algorithms involved in the literature review can help decision-makers quickly integrate, process, and analyze disaster data and assist them in optimizing landslide disaster information management and emergency command and control systems. This literature review clarifies that deep learning is the most promising modeling algorithm and discusses the advantages and disadvantages of various model methods. It is suggested to focus on new intelligent hybrid models in the future, which can provide some reference for makers and UN SDGs to promote landslide disaster management and regional planning.
6. Conclusions
RS and GIS technologies have been widely applied in rainfall-induced landslides, and a large number of research results are constantly emerging. The contradiction between the scattered spatiotemporal distribution of literature in this field, scattered research topics, and unclear research trends, as well as the scarcity and obsolescence of review literature, is becoming increasingly prominent, making it challenging to meet the research needs of landslides. To systematically clarify the development process of research in this field and predict future research trends, this article established a data sample library containing 1161 articles based on the WOS literature data platform. With the help of WOS literature analysis function and various literature visualization tools, relevant literature was systematically analyzed from aspects such as the spatiotemporal distribution of publication volume, highly cited literature, scientific research cooperation, research hotspots, and trends. Finally, the research progress and development trends in the four sub-areas of landslide detection and monitoring, prediction model analysis, sensitivity mapping, and risk assessment were summarized. The results indicate that the literature in this field will continue to show an upward trend, and machine learning algorithms will be relatively active shortly. Among them, deep learning algorithms may become a cutting-edge trend, and new intelligent hybrid models are the future development direction. Ultimately, we will continue to conduct literature data mining and quantitative analysis based on the research hotspots and trends obtained in this article, providing a more scientific and reasonable basis for landslide prevention and control research.
Data availability statement
The data used in this study are available by contacting the corresponding author.
Disclosure statement
No potential conflict of interest was reported by the author(s).
Additional information
Funding
References
- Abdallah, C., J. Chorowicz, R. B. Kheir, and M. Khawlie. 2005. “Detecting Major Terrain Parameters Relating to Mass Movements’ Occurrence Using GIS, Remote Sensing and Statistical Correlations, Case Study Lebanon.” Remote Sensing of Environment 99 (4): 448–461. https://doi.org/10.1016/j.rse.2005.09.014.
- Achour, Y., Z. Saidani, and R. Touati. 2021. “Assessing Landslide Susceptibility Using a Machine Learning-Based Approach to Achieving Land Degradation Neutrality.” Environmental Earth Sciences 80 (17): 575. https://doi.org/10.1007/s12665-021-09889-9.
- Aghdam, I. N., B. Pradhan, and M. Panahi. 2017. “Landslide Susceptibility Assessment Using a Novel Hybrid Model of Statistical Bivariate Methods, FR and WOE and Adaptive Neuro-Fuzzy Inference System, Anfis at Southern Zagros Mountains in Iran.” Environmental Earth Sciences 76 (6): 1–22. https://doi.org/10.1007/s12665-017-6558-0.
- Al-Rawabdeh, A., F. He, A. Moussa, N. El-Sheimy, and A. Habib. 2016. “Using an Unmanned Aerial Vehicle-Based Digital Imaging System to Derive a 3D Point Cloud for Landslide Scarp Recognition.” Remote Sensing 8 (2): 95. https://doi.org/10.3390/rs8020095.
- Argyriou, A. V., C. Polykretis, R. M. Teeuw, and N. Papadopoulos. 2022. “Geoinformatic Analysis of Rainfall-Triggered Landslides in Crete, Greece Based on Spatial Detection and Hazard Mapping.” Sustainability 14 (7): 3956. https://doi.org/10.3390/su14073956.
- Aristizábal, E., and O. Sánchez. 2020. “Spatial and Temporal Patterns and the Socioeconomic Impacts of Landslides in the Tropical and Mountainous Colombian Andes.” Disasters 44 (3): 596–618. https://doi.org/10.1111/disa.12391.
- Arnous, M. O. 2011. “Integrated Remote Sensing and GIS Techniques for Landslide Hazard Zonation: A Case Study Wadi Watier Area, South Sinai, Egypt.” Journal of Coastal Conservation 15 (4): 477–497. https://doi.org/10.1007/s11852-010-0137-9.
- Bathrellos, G. D., D. P. Kalivas, and H. D. Skilodimou. 2009. “Gis-Based Landslide Susceptibility Mapping Models Applied to Natural and Urban Planning in Trikala, Central Greece.” Estudios Geológicos 65 (1): 49–65. https://doi.org/10.3989/egeol.08642.036.
- Baum, R. L., J. A. Coe, J. W. Godt, E. L. Harp, M. E. Reid, W. Z. Savage, W. H. Schulz, et al. 2005. “Regional Landslide-Hazard Assessment for Seattle, Washington, USA.” Landslides 2 (4): 266–279. https://doi.org/10.1007/s10346-005-0023-y.
- Bhandary, N. P., R. K. Dahal, M. Timilsina, and R. Yatabe. 2013. “Rainfall Event-Based Landslide Susceptibility Zonation Mapping.” Natural Hazards 69 (1): 365–388. https://doi.org/10.1007/s11069-013-0715-x.
- Bonomi, T., and A. Cavallin. 1999. “Three-Dimensional Hydrogeological Modelling Application to the Alverà Mudslide,Cortina D’Ampezzo, Italy.” Geomorphology 30 (1-2): 189–199. https://doi.org/10.1016/S0169-555X(99)00054-9.
- Bovi, R. C., J. P. Romanelli, B. F. Caneppele, and M. Cooper. 2022. “Global Trends in Dendrogeomorphology: A Bibliometric Assessment of Research Outputs.” Catena 210: 105921. https://doi.org/10.1016/j.catena.2021.105921.
- Bui, D. T., B. Pradhan, O. Lofman, I. Revhaug, and O. B. Dick. 2012. “Landslide Susceptibility Mapping at Hoa Binh Province, (Vietnam) Using an Adaptive Neuro-Fuzzy Inference System and GIS.” Computers & Geosciences 45: 199–211. https://doi.org/10.1016/j.cageo.2011.10.031.
- Buisson, L., R. Martin Clouaire, L. Vieu, and J. L. Wybo. 1992. “Artificial Intelligence and Environmental Protection: A Survey of Selected Applications in France.” IFIP Transactions A-Computer Science and Technology 13: 635–644. https://doi.org/10.1109/71.113087.
- Chae, B. G., H. J. Park, F. Catani, A. Simoni, and M. Berti. 2017. “Landslide Prediction, Monitoring and Early Warning: A Concise Review Of State-of-the-Art.” Geosciences Journal 21 (6): 1033–1070. https://doi.org/10.1007/s12303-017-0034-4.
- Chen, C. M. 2004. “Searching for Intellectual Turning Points: Progressive Knowledge Domain Visualization.” Proceedings of the National Academy of Sciences 101 (suppl_1): 5303–5310. https://doi.org/10.1073/pnas.0307513100.
- Chen, C. M. 2006. “CiteSpace II: Detecting and Visualizing Emerging Trends and Transient Patterns in Scientific Literature.” Journal of the American Society for Information Science and Technology 57 (3): 359–377. https://doi.org/10.1002/asi.20317.
- Chen, C. M. 2016. CiteSpace: A Practical Guide for Mapping Scientific Literature. Hauppauge, NY, USA: Nova Science Publishers.
- Chen, C. M. 2017. “Science Mapping: A Systematic Review of the Literature.” Journal of Data and Information Science 2 (2): 1–40. https://doi.org/10.1515/jdis-2017-0006.
- Chen, J. W., Y. S. Chue, and Y. R. Chen. 2013. “The Application Of the Genetic Adaptive Neural Network in Landslide Disaster Assessment.” Journal of Marine Science and Technology 21 (4): 9. https://doi.org/10.6119/JMST-012-0709-2.
- Chen, C., F. Ibekwe-SanJuan, and J. Hou. 2010. “The Structure And Dynamics of Cocitation Clusters: A Multiple-Perspective Cocitation Analysis.” Journal of the American Society for Information Science and Technology 61 (7): 1386–1409. https://doi.org/10.1002/asi.21309.
- Chen, C., and M. Song. 2019. “Visualizing a Field Of Research: A Methodology of Systematic Scientometric Reviews.” PloS one 14 (10): e0223994. https://doi.org/10.1371/journal.pone.0223994.
- Chen, W., X. S. Xie, J. B. Peng, J. L. Wang, Z. Duan, and H. Y. Hong. 2017. “GIS-based Landslide Susceptibility Modelling: A Comparative Assessment of Kernel Logistic Regression, Naïve-Bayes Tree, And Alternating Decision Tree Models.” Geomatics, Natural Hazards and Risk 8 (2): 950–973. https://doi.org/10.1080/19475705.2017.1289250.
- Chowdhury, R. N., and P. N. Flentje. 1998. “Effective Urban Landslide Hazard Assessment.” Proceedings of eighth international congress international association For engineering geology And The environment, proceedings 1-5: 871-877.
- Cobo, M. J., A. G. López-Herrera, E. Herrera-Viedma, and F. Herrera. 2011. “Science Mapping Software Tools: Review, Analysis, and Cooperative Study Among Tools.” Journal of the American Society for Information Science and Technology 62 (7): 1382–1402. https://doi.org/10.1002/asi.21525.
- Conoscenti, C., E. Rotigliano, M. Cama, N. A. Caraballo-Arias, L. Lombardo, and V. Agnesi. 2016. “Exploring the Effect of Absence Selection on Landslide Susceptibility Models: A Case Study in Sicily, Italy.” Geomorphology 261: 222–235. https://doi.org/10.1016/j.geomorph.2016.03.006.
- Dai, F. C., and C. F. Lee. 2002. “Landslide Characteristics and Slope Instability Modeling Using GIS, Lantau Island, Hong Kong.” Geomorphology 42 (3-4): 213–228. https://doi.org/10.1016/S0169-555X(01)00087-3.
- Dai, F. C., C. F. Lee, and Y. Y. Ngai. 2002. “Landslide Risk Assessment and Management: An Overview.” Engineering Geology 64 (1): 65–87. https://doi.org/10.1016/S0013-7952(01)00093-X.
- Dai, F. C., C. F. Lee, and S. J. Wang. 2003. “Characterization of Rainfall-Induced Landslides.” International Journal of Remote Sensing 24 (23): 4817–4834. https://doi.org/10.1080/014311601131000082424.
- Deng, N., Y. Li, J. Ma, H. Shahabi, M. Hashim, G. de Oliveira, and S. S. Chaeikar. 2022. “A Comparative Study for Landslide Susceptibility Assessment Using Machine Learning Algorithms Based on Grid Unit and Slope Unit.” Frontiers in Environmental Science 10: 1009433. https://doi.org/10.3389/fenvs.2022.1009433.
- Ding, L., L. Ma, L. Li, C. Liu, N. Li, Z. Yang, Y. Yao, and H. Lu. 2021. “A Survey of Remote Sensing and Geographic Information System Applications for Flash Floods.” Remote Sensing 13: 1818. https://doi.org/10.3390/rs13091818.
- Ding, X., and Z. Yang. 2020. “Knowledge Mapping of Platform Research: A Visual Analysis Using VOS viewer and Cite Space.” Electronic Commerce Research 22: 1–23. https://doi.org/10.1007/s10660-020-09410-7.
- Donati, L., and M. C. Turrini. 2002. “An Objective Method to Rank the Importance of the Factors Predisposing to Landslides with the GIS Methodology: Application to an Area Of The Apennines, Valnerina, Perugia, Italy).” Engineering Geology 63 (3-4): 277–289. https://doi.org/10.1016/S0013-7952(01)00087-4.
- Drid, I., Y. Achour, K. Zighmi, T. Nouioua, O. Khababa, S. Rahmani, O. Ouadfel, and B. Atoui. 2022. “Designing Gully Erosion Susceptibility Maps (GESM) in the Algerian Eastern Tell: A Case Study of the K’sob River Watershed.” Arabian Journal of Geosciences 15 (14): 1–20. https://doi.org/10.1007/s12517-022-10566-9.
- Elejalde, B. R., M. M. De Elejalde, and T. Heitman. 1985. “Visualization of the Fetal Genitalia by Ultrasonography: A Review of the Literature and Analysis of its Accuracy and Ethical Implications.” Journal of Ultrasound in Medicine 4 (12): 633–639. https://doi.org/10.7863/jum.1985.4.12.633.
- Fernández, C. I., T. F. Del Castillo, R. E. Hamdouni, and J. C. Montero. 1999. “Verification of Landslide Susceptibility Mapping: A Case Study.” Earth Surface Processes and Landforms 24 (6): 537–544. https://doi.org/10.1002/,SICI)1096-9837,199906)24:6<537::AID-ESP965>3.0.CO,2-6.
- Froude, M. J., and D. N. Petley. 2018. “Global Fatal Landslide Occurrence from 2004 to 2016.” Natural Hazards and Earth System Sciences 18 (8): 2161–2181. https://doi.org/10.5194/nhess-18-2161-2018. 2018.
- Fu, X., Q. Zhu, C. Liu, N. Li, W. Zhuang, Z. Yang, H. Lu, and M. Tang. 2020. “Estimation of Landslides and Road Capacity after August 8, 2017, MS7.0 Jiuzhaigou Earthquake Using High-Resolution Remote Sensing Images.” Adv. Civ. Eng 2020: 8828385. https://doi.org/10.1155/2020/8828385
- Gentile, F., T. Bisantino, and G. Trisorio Liuzzi. 2008. “Debris-flow Risk Analysis in South Gargano Watersheds, (Southern-Italy).” Natural Hazards 44 (1): 1–17. https://doi.org/10.1007/s11069-007-9139-9.
- Ghorbanzadeh, O., K. Gholamnia, and P. Ghamisi. 2022. “The Application of Resu-Net and Obia for Landslide Detection from Multi-Temporal Sentinel-2 Images.” Big Earth Data, 1–26. https://doi.org/10.1080/20964471.2022.2031544.
- Guarascio, M., G. Folino, F. Chiaravalloti, S. Gabriele, A. Procopio, and P. Sabatino. 2020. “A Machine Learning Approach for Rainfall Estimation Integrating Heterogeneous Data Sources.” IEEE Transactions on Geoscience and Remote Sensing 60: 1–11. https://doi.org/10.1109/TGRS.2020.3037776.
- Gui, Jingyun, Ignacio Pérez-Rey, Miao Yao, Fasuo Zhao, and Wei Chen. 2023. “Credal-Decision-Tree-Based Ensembles for Spatial Prediction of Landslides.” Water 15 (3): 605. https://doi.org/10.3390/w15030605.
- Guzzetti, F., A. C. Mondini, M. Cardinali, F. Fiorucci, M. Santangelo, and K. T. Chang. 2012. “Landslide Inventory Maps: New Tools for an Old Problem.” Earth-Science Reviews 112 (1-2): 42–66. https://doi.org/10.1016/j.earscirev.2012.02.001.
- Han, Y., P. Wang, Y. Zheng, M. Yasir, C. Xu, S. Nazir, M. S. Hossain, S. Ullah, and S. Khan. 2022. “Extraction of Landslide Information Based on Object-Oriented Approach and Cause Analysis in Shuicheng, China.” Remote Sensing 14 (3): 502. https://doi.org/10.3390/rs14030502.
- Haque, U., P. F. Da Silva, G. Devoli, J. Pilz, B. X. Zhao, A. Khaloua, W. Wilopo, et al. 2019. “The Human Cost of Global Warming: Deadly Landslides and Their Triggers, (1995-2014).” Science of the Total Environment 682: 673–684. https://doi.org/10.1016/j.scitotenv.2019.03.415.
- He, Y., Z. Zhao, W. Yang, H. Yan, W. Wang, S. Yao, L. Zhang, and T. Liu. 2021. “A Unified Network of Information Considering Superimposed Landslide Factors Sequence and Pixel Spatial Neighbourhood for Landslide Susceptibility Mapping.” International Journal of Applied Earth Observation and Geoinformation 104: 102508. https://doi.org/10.1016/j.jag.2021.102508.
- Hussain, M., M. H. Arsalan, K. Siddiqi, B. Naseem, and U. Rabab. 2005. “Emerging Geo-Information Technologies, (GIT) for Natural Disaster Management in Pakistan: An Overview.” Proceedings of 2nd international conference on recent advances in space technologies. RAST 2005, IEEE: 487–493.
- Ibsen, M. L., and D. Brunsden. 1996. “The Nature, Use and Problems of Historical Archives for the Temporal Occurrence of Landslides, With Specific Reference to the South Coast of Britain, Ventnor, Isle of Wight.” Geomorphology 15 (3-4): 241–258. https://doi.org/10.1016/0169-555X(95)00073-E.
- Jain, N., T. R. Martha, K. Khanna, P. Roy, and K. V. Kumar. 2021. “Major Landslides in Kerala, India, During 2018-2020 Period: An Analysis Using Rainfall Data And Debris Flow Model.” Landslides 18 (11): 3629–3645. https://doi.org/10.1007/s10346-021-01746-x.
- Jiang, W., Q. Jiao, Y. Luo, Y. S. Li, Q. Li, and B. Q. Li. 2020. “Risk Investigation of Landslide Hazard and Disaster Emergency Based on Multi-Platforms Remote Sensing Techniques.” IGARSS 2020-2020 IEEE international geoscience and remote sensing symposium, IEEE: 5211–5214.
- Kaur, A., and S. K. Sood. 2020. “Ten Years of Disaster Management and use of ICT: A Scientometric Analysis.” Earth Science Informatics 13 (1): 1–27. https://doi.org/10.1007/s12145-019-00408-w.
- Kavoura, K., and N. Sabatakakis. 2020. “Investigating Landslide Susceptibility Procedures in Greece.” Landslides 17 (1): 127–145. https://doi.org/10.1007/s10346-019-01271-y.
- Kayastha, P., M. R. Dhital, and F. De Smedt. 2013. “Application of the Analytical Hierarchy Process, (AHP) for Landslide Susceptibility Mapping: A Case Study from the Tinau Watershed, West Nepal.” Computers & Geosciences 52: 398–408. https://doi.org/10.1016/j.cageo.2012.11.003.
- Kelevitz, K., A. Novellino, A. Watlet, J. Boyd, J. Whiteley, J. Chambers, C. Jordan, T. Wright, A. Hooper, and J. Biggs. 2022. “Ground and Satellite-Based Methods of Measuring Deformation at a UK Landslide Observatory: Comparison and Integration.” Remote Sensing 14 (12): 2836. https://doi.org/10.3390/rs14122836.
- Khasanov, S., M. Juliev, U. Uzbekov, I. Aslanov, I. Agzamova, N. Normatova, S. Islamov, G. Goziev, S. Khodjaeva, and N. Holov. 2021. “Landslides in Central Asia: A Review of Papers Published in 2000–2020 with a Particular Focus on the Importance of GIS and Remote Sensing Techniques.” GeoScape 15 (2): 2. https://doi.org/10.2478/geosc-2021-0011.
- Kirschbaum, D. B., R. Adler, Y. Hong, S. Hill, and A. Lerner-Lam. 2010. “A Global Landslide Catalog for Hazard Applications: Method, Results, and Limitations.” Natural Hazards 52 (3): 561–575. https://doi.org/10.1007/s11069-009-9401-4.
- Kontoes, C., C. Loupasakis, I. Papoutsis, S. Alatza, E. Poyiadji, A. Ganas, C. Psychogyiou, M. Kaskara, S. Antoniadi, and N. Spanou. 2021. “Landslide Susceptibility Mapping of Central and Western Greece, Combining NGI and WOE Methods, with Remote Sensing and Ground Truth Data.” Land 10 (4): 402. https://doi.org/10.3390/land10040402.
- Kouli, M., C. Loupasakis, P. Soupios, and F. Vallianatos. 2010. “Landslide Hazard Zonation in High Risk Areas of Rethymno Prefecture, Crete Island, Greece.” Natural Hazards 52 (3): 599–621. https://doi.org/10.1007/s11069-009-9403-2.
- Leone, Frédéric, J. P. Asté, and E. Leroi. 1996. “Vulnerability Assessment of Elements Exposed to Mass-Movement: Working Toward a Better Risk Perception.” In Landslides-Glissements de Terrain, edited by K. Senneset , 263–270. Rotterdam: Balkema.
- Leydesdorff, L., S. Carley, and I. Rafols. 2013. “Global Maps of Science Based on the New Web-of-Science Categories.” Scientometrics 94 (2): 589–593. https://doi.org/10.1007/s11192-012-0784-8.
- Li, J., D. Hong, L. Gao, J. Yao, K. Zheng, B. Zhang, and J. Chanussot. 2022. “Deep Learning in Multimodal Remote Sensing Data Fusion: A Comprehensive Review.” arXiv Preprint ArXiv:2205.01380, https://doi.org/10.48550/arXiv.2205.01380.
- Li, J., W. Wang, Y. Li, H. Zheng, and G. Q. Chen. 2021. “Spatiotemporal Landslide Susceptibility Mapping Incorporating the Effects of Heavy Rainfall: A Case Study of the Heavy Rainfall in August 2021 in Kitakyushu, Fukuoka, Japan.” Water 13 (22): 3312. https://doi.org/10.3390/w13223312.
- Liu, T., T. Chen, R. Niu, and A. Plaza. 2021. “Landslide Detection Mapping Employing CNN, ResNet, and DenseNet in the Three Gorges Reservoir, China.” IEEE Journal of Selected Topics in Applied Earth Observations and Remote Sensing 14: 11417–11428. https://doi.org/10.1109/JSTARS.2021.3117975.
- Liu, H., J. Du, and Y. Yi. 2022. “Reconceptualising Flood Risk Assessment by Incorporating Sediment Supply.” Catena 217 (106503), https://doi.org/10.1016/j.catena.2022.106503.
- Liu, Z. X., L. L. Sun, Y. Zhang, and Z. Y. Yu. 2022. “Landslide Risk Evaluation Based on Slope Unit: A Case on the Western Hubei Area, China.” Arabian Journal of Geosciences 15 (11): 1–13. https://doi.org/10.1007/s12517-022-10319-8.
- Liu, Y., A. Yuan, Z. Bai, and J. Zhu. 2022. “GIS-based Landslide Susceptibility Mapping Using Frequency Ratio and Index of Entropy Models for She County of Anhui Province, China.” Applied Rheology 32 (1): 22–33. https://doi.org/10.1515/arh-2022-0122.
- Manfré, L. A., E. Hirata, J. B. Silva, E. J. Shinohara, M. A. Giannotti, A. P. C. Larocca, and J. A. Quintanilha. 2012. “An Analysis of Geospatial Technologies for Risk and Natural Disaster Management.” ISPRS International Journal of Geo-Information 1 (2): 166–185. https://doi.org/10.3390/ijgi1020166.
- Marjanovic, M., B. Bajat, and M. Kovacevic. 2009. “Landslide Susceptibility Assessment with Machine Learning Algorithms//2009 International Conference on Intelligent Networking and Collaborative Systems.” IEEE, 273–278. https://doi.org/10.1109/INCOS.2009.25.
- Markscheffel, B., and F. Schröter. 2021. “Comparison of Two Science Mapping Tools Based on Software Technical Evaluation and Bibliometric Case Studies.” COLLNET Journal of Scientometrics and Information Management 15 (2): 365–396. https://doi.org/10.1080/09737766.2021.1960220.
- Martha, T. R., N. Kerle, C. J. Van Westen, V. Jetten, and K. V. Kumar. 2012. “Object-oriented Analysis of Multi-Temporal Panchromatic Images for Creation of Historical Landslide Inventories.” ISPRS Journal of Photogrammetry and Remote Sensing 67: 105–119. https://doi.org/10.1016/j.isprsjprs.2011.11.004.
- Martha, T. R., P. Roy, K. Khanna, and M. Kotteeswaran. 2019. “Landslides Mapped Using Satellite Data in the Western Ghats of India after Excess Rainfall During August 2018.” Current Science 117 (5): 804–812. https://doi.org/10.18520/cs/v117/i5/804-812.
- Martha, T. R., C. J. van Westen, N. Kerle, V. Jetten, and K. V. Kumar. 2013. “Landslide Hazard and Risk Assessment Using Semi-Automatically Created Landslide Inventories.” Geomorphology 184: 139–150. https://doi.org/10.1016/j.geomorph.2012.12.001.
- Matziaris, V., A. M. Marshall, C. M. Heron, and H. S. Yu. 2015. “Centrifuge Model Study of Thresholds for Rainfall-Induced Landslides in Sandy Slopes.” IOP Conference Series: Earth and Environmental Science 26 (1): 012032. https://doi.org/10.1088/1755-1315/26/1/012032.
- McCarthy, J., M. L. Minsky, N. Rochester, and C. E. Shannon. 2006. “A Proposal for the Dartmouth Summer Research Project on Artificial Intelligence, August 31, 1955.” AI Magazine 27 (4): 12–12. https://doi.org/10.1609/aimag.v27i4.1904.
- Mekrishu, W. N., S. K. Singh, P. S. Ningthoujam, and G. Z. Piuthaimei. 2022. “A Study on the Causative and Triggering Factors of Multiple Landslides in Lalmati, Nagaland and Development of a Sinking Zone.” Himalayan Geology 43 (1A): 73–84.
- Menggenang, P., and S. Samanta. 2017. “Modelling and Mapping of Landslide Hazard Using Remote Sensing and GIS Techniques.” Modeling Earth Systems and Environment 3 (3): 1113–1122. https://doi.org/10.1007/s40808-017-0361-5.
- Mondal, S., and S. Mandal. 2018. “RS & GIS-Based Landslide Susceptibility Mapping of the Balason River Basin, Darjeeling Himalaya, Using Logistic Regression, Lr Model.” Georisk: Assessment and Management of Risk for Engineered Systems and Geohazards 12 (1): 29–44. https://doi.org/10.1080/17499518.2017.1347949.
- Montrasio, L., R. Valentino, and G. L. Losi. 2011. “Towards a Real-Time Susceptibility Assessment of Rainfall-Induced Shallow Landslides on a Regional Scale.” Natural Hazards and Earth System Sciences 11 (7): 1927–1947. https://doi.org/10.5194/nhess-11-1927-2011.
- Nakano, T., K. Wada, M. Yamanaka, I. Kamiya, and H. Nakajima. 2016. ““Precursory Slope Deformation Around Landslide Area Detected by InSAR Throughout Japan.” The International Archives of the Photogrammetry, Remote Sensing and Spatial Information Sciences 41: 1201. https://doi.org/10.5194/isprs-archives-XLI-B1-1201-2016.
- Nhu, V. H., A. Mohammadi, H. Shahabi, B. B. Ahmad, N. Al-Ansari, A. Shirzadi, M. Geertsema, et al. 2020. “Landslide Detection and Susceptibility Modeling on Cameron Highlands, Malaysia, A Comparison Between Random Forest, Logistic Regression and Logistic Model Tree Algorithms.” Forests 11 (8): 830. https://doi.org/10.3390/f11080830.
- Orense, R., and S. Sapuay. 2006. “Preliminary Report on the 17 February 2006 Leyte, Philippines Landslide.” Soils and Foundations 46 (5): 685–693. https://doi.org/10.3208/sandf.46.685.
- Ozdemir, H., and H. Turoglu. 2007. “Landslide Susceptibility Assessment Using GIS and RS in the Havran River Basin,Balikesir-TURKEY.” The 12th conference of the international association of mathematical geology, August. 26-31.
- Park, S., S. Jeon, S. Kim, and C. Choi. 2011. “Prediction and Comparison of Urban Growth By Land Suitability Index Mapping Using GIS and RS in South Korea.” Landscape and Urban Planning 99 (2): 104–114. https://doi.org/10.1016/j.landurbplan.2010.09.001.
- Park, D. W., N. V. Nikhil, and S. R. Lee. 2013. “Landslide and Debris Flow Susceptibility Zonation Using Trigrs for the 2011 Seoul Landslide Event.” Natural Hazards and Earth System Sciences 13 (11): 2833–2849. https://doi.org/10.5194/nhess-13-2833-2013.
- Park, D., K. Oh, and B. Park. 2021. Investigation of Landslide Damage in Korea, 1998//Slope Stability Engineering. Seoul: Routledge, 1233–1237.
- Pawluszek-Filipiak, K., and A. Borkowski. 2020. “On the Importance of Train–Test Split Ratio of Datasets in Automatic Landslide Detection by Supervised Classification.” Remote Sensing 12 (18): 3054. https://doi.org/10.3390/rs12183054.
- Pennington, C., K. Freeborough, C. Dashwood, T. Dijkstra, and K. Lawrie. 2015. “The National Landslide Database of Great Britain: Acquisition, Communication and the Role of Social Media.” Geomorphology 249: 44–51. https://doi.org/10.1016/j.geomorph.2015.03.013.
- Petley, D. 2012. “Global Patterns of Loss of Life from Landslides.” Geology 40 (10): 927–930. https://doi.org/10.1130/G33217.1.
- Pham, Q. B., Y. Achour, S. A. Ali, F. Parvin, M. Vojtek, J. Vojteková, and D. T. Anh. 2021. “A Comparison among Fuzzy Multi Criteria Decision Making, Bivariate, Multivariate and Machine Learning Models in Landslide Susceptibility Mapping.” Geomatics, Natural Hazards and Risk 12 (1): 1741–1777. https://doi.org/10.1080/19475705.2021.1944330.
- Pham, B. T., D. Tien Bui, H. R. Pourghasemi, P. Indra, and M. B. Dholakia. 2017. “Landslide Susceptibility Assesssment in the Uttarakhand Area, India, Using GIS: A Comparison Study of Prediction Capability of Naïve Bayes, Multilayer Perceptron Neural Networks, and Functional Trees Methods.” Theoretical and Applied Climatology 128 (1-2): 255–273. https://doi.org/10.1007/s00704-015-1702-9.
- Pourghasemi, H. R., M. Mohammady, and B. Pradhan. 2012. “Landslide Susceptibility Mapping Using Index of Entropy and Conditional Probability Models in GIS: Safarood Basin, Iran.” Catena 97: 71–84. https://doi.org/10.1016/j.catena.2012.05.005.
- Pradhan, B., and S. Lee. 2010. “Regional Landslide Susceptibility Analysis Using Back-Propagation Neural Network Model at Cameron Highland, Malaysia.” Landslides 7 (1): 13–30. https://doi.org/10.1007/s10346-009-0183-2.
- Pradhan, B., M. I. Seeni, and B. Kalantar. 2017. “Performance Evaluation and Sensitivity Analysis of Expert-Based, Statistical, Machine Learning, and Hybrid Models for Producing Landslide Susceptibility Maps.” In Laser Scanning Applications in Landslide Assessment, 193–232. Cham: springer International Publishing.
- Prakash, N., A. Manconi, and S. Loew. 2020. “Mapping Landslides on Eo Data: Performance of Deep Learning Models Vs. Traditional Machine Learning Models.” Remote Sensing 12 (3): 346. https://doi.org/10.3390/rs12030346.
- Qiao, J. P. 2004. “A 3D Visible Evaluation of Landslide Risk Degree Under Integration of Gis and Artificial Intelligence.” Science in China Series E 46 (7): 142. https://doi.org/10.1360/03ez0017.
- Qing, F., Y. Zhao, X. Meng, X. Su, T. Qi, and D. Yue. 2020. “Application of Machine Learning to Debris Flow Susceptibility Mapping Along the China-Pakistan Karakoram Highway.” Remote Sensing 12 (18): 2933. https://doi.org/10.3390/rs12182933.
- Roccati, A., G. Paliaga, F. Luino, F. Faccini, and L. Turconi. 2021. “GIS-based Landslide Susceptibility Mapping for Land Use Planning and Risk Assessment.” Land 10 (2): 162. https://doi.org/10.3390/land10020162.
- Saha, S., J. Roy, B. Pradhan, and T. K. Hembram. 2021. “Hybrid Ensemble Machine Learning Approaches for Landslide Susceptibility Mapping Using Different Sampling Ratios at East Sikkim Himalayan, India.” Advances in Space Research 68 (7): 2819–2840. https://doi.org/10.1016/j.asr.2021.05.018.
- Samanta, S., D. K. Pal, D. Lohar, and B. Pal. 2011. “Preparation of Digital Data Sets on Land Use/Land Cover, Soil and Digital Elevation Model for Temperature Modelling Using Remote Sensing and GIS Techniques.” Indian Journal of Science and Technology 4 (6): 636–642. https://doi.org/10.17485/ijst/2011/v4i6.22
- Samanta, S., D. K. Pal, D. Lohar, and B. Pal. 2012. “Interpolation of Climate Variables and Temperature Modeling.” Theoretical and Applied Climatology 107 (1-2): 35–45. https://doi.org/10.1007/s00704-011-0455-3.
- Schicker, R., and V. Moon. 2012. “Comparison of Bivariate And Multivariate Statistical Approaches in Landslide Susceptibility Mapping at a Regional Scale.” Geomorphology 161: 40–57. https://doi.org/10.1016/j.geomorph.2012.03.036.
- Sharma, R. H., and N. M. Shakya. 2008. “Rain Induced Shallow Landslide Hazard Assessment for Ungauged Catchments.” Hydrogeology Journal 16 (5): 871–877. https://doi.org/10.1007/s10040-008-0310-5.
- Shi, W., M. Zhang, H. Ke, X. Fang, Z. Zhan, and S. X. Chen. 2020. “Landslide Recognition by Deep Convolutional Neural Network and Change Detection.” IEEE Transactions on Geoscience and Remote Sensing 59 (6): 4654–4672. https://doi.org/10.1109/TGRS.2020.3015826.
- Shirzadi, A., D. T. Bui, B. T. Pham, K. Solaimani, K. Chapi, A. Kavian, H. Shahabi, and I. Revhaug. 2017. “Shallow Landslide Susceptibility Assessment Using a Novel Hybrid Intelligence Approach.” Environmental Earth Sciences 76 (2): 1–18. https://doi.org/10.1007/s12665-016-6374-y.
- Singh, P., V. Maurya, and R. Dwivedi. 2021. “Pixel Based Landslide Identification Using Landsat 8 and GEE//2021 IEEE International Geoscience and Remote Sensing Symposium IGARSS.” IEEE, 8444–8447. https://doi.org/10.1109/IGARSS47720.2021.9553358.
- Syzdykbayev, M., B. Karimi, and H. A. Karimi. 2020. “Persistent Homology on Lidar Data to Detect Landslides.” Remote Sensing of Environment 246: 111816. https://doi.org/10.1016/j.rse.2020.111816.
- Tarantino, C., P. Blonda, and G. Pasquariello. 2004. “Application of Change Detection Techniques for Monitoring Man-Induced Landslide Causal Factors//IGARSS 2004. 2004 IEEE International Geoscience and Remote Sensing Symposium.” IEEE 2: 1103–1106. https://doi.org/10.1109/IGARSS.2004.1368605.
- Tehrany, M. S., B. Pradhan, and M. N. Jebur. 2013. “Spatial Prediction of Flood Susceptible Areas Using Rule Based Decision Tree, DT and a Novel Ensemble Bivariate and Multivariate Statistical Models in GIS.” Journal of Hydrology 504: 69–79. https://doi.org/10.1016/j.jhydrol.2013.09.034.
- Teshebaeva, K., S. Roessner, H. Echtler, M. Motagh, H. Wetzel, and B. Molodbekov. 2015. “ALOS/PALSAR InSAR Time-Series Analysis for Detecting Very Slow-Moving Landslides in Southern Kyrgyzstan.” Remote Sensing 7 (7): 8973–8994. https://doi.org/10.3390/rs70708973.
- Tien Bui, D., T. A. Tuan, N. D. Hoang, N. Q. Thanh, D. B. Nguyen, N. Van Liem, and B. Pradhan. 2017. “Spatial Prediction of Rainfall-Induced Landslides for the Lao Cai Area,Vietnam) Using a Hybrid Intelligent Approach of Least Squares Support Vector Machines Inference Model and Artificial Bee Colony Optimization.” Landslides 14 (2): 447–458. https://doi.org/10.1007/s10346-016-0711-9.
- Trinh, T., B. T. Luu, T. H. T. Le, D. H. Nguyen, T. Van Tran, T. H. Van Nguyen, and L. T. Nguyen. 2022. “A Comparative Analysis of Weight-Based Machine Learning Methods for Landslide Susceptibility Mapping in Ha Giang Area.” Big Earth Data, 1–30. https://doi.org/10.1080/20964471.2022.2043520.
- Van Dao, D., A. Jaafari, M. Bayat, D. Mafi-Gholami, C. Qi, H. Moayedi, T. Van Phong, et al. 2020. “A Spatially Explicit Deep Learning Neural Network Model for the Prediction of Landslide Susceptibility.” Catena 188: 104451. https://doi.org/10.1016/j.catena.2019.104451.
- Van Eck, N., and L. Waltman. 2010. “Software Survey: VOS viewer, a Computer Program for Bibliometric Mapping.” Scientometrics 84 (2): 523–538. https://doi.org/10.1007/s11192-009-0146-3.
- van Natijne, A. L., T. A. Bogaard, F. J. van Leijen, R. F. Hanssen, and R. C. Lindenbergh. 2022. “World-wide InSAR Sensitivity Index for Landslide Deformation Tracking.” International Journal of Applied Earth Observation and Geoinformation 111: 102829. https://doi.org/10.1016/j.jag.2022.102829.
- Van Westen, C. J., E. Castellanos, and S. L. Kuriakose. 2008. “Spatial Data for Landslide Susceptibility, Hazard, and Vulnerability Assessment: An Overview.” Engineering Geology 102 (3-4): 112–131. https://doi.org/10.1016/j.enggeo.2008.03.010.
- Van Westen, C. J., N. Rengers, and R. Soeters. 2003. “Use of Geomorphological Information in Indirect Landslide Susceptibility Assessment.” Natural Hazards 30 (3): 399–419. https://doi.org/10.1023/B:NHAZ.0000007097.42735.9e.
- Vasu, N. N., and S. R. Lee. 2016. “A Hybrid Feature Selection Algorithm Integrating an Extreme Learning Machine for Landslide Susceptibility Modeling of Mt. Woomyeon, South Korea.” Geomorphology 263: 50–70. https://doi.org/10.1016/j.geomorph.2016.03.023.
- Vega, J. A. 2019. “The Use of Lidar Data and VHR Imagery to Estimate the Effects of Tree Roots on Shallow Landslides Assessment//IOP Conference Series: Materials Science and Engineering.” IOP Publishing 603 (2): 022010. https://doi.org/10.1088/1757-899x/603/2/022010
- Wang, L. H., A. X. Lu, L. Q. Yu, and Z. Y. Jia. 2007. “The Study of Disaster Investigation by Using Remote Sensing On The Sichuan-Tibet Highway in Tibet//2007 IEEE International Geoscience and Remote Sensing Symposium.” IEEE, 4698–4701. https://doi.org/10.1109/IGARSS.2007.4423908.
- Wang, H. B., K. Sassa, and W. Y. Xu. 2007. “Analysis of a Spatial Distribution of Landslides Triggered by The 2004 Chuetsu Earthquakes of Niigata Prefecture, Japan.” Natural Hazards 41 (1): 43–60. https://doi.org/10.1007/s11069-006-9009-x.
- Wang, Y., Y. Tian, and Y. Cao. 2021. “Dam Siting: A Review.” Water 13 (15): 2080. https://doi.org/10.3390/w13152080.
- Wieczorek, G. F., and T. Glade. 2005. “Climatic Factors Influencing Occurrence of Debris Flows.” In Debris-flow Hazards and Related Phenomena, 325–362. Berlin, Heidelberg: Springer. https://doi.org/10.1007/3-540-27129-5_14.
- Wu, W., and R. C. Sidle. 1995. “A Distributed Slope Stability Model for Steep Forested Basins.” Water Resources Research 31 (8): 2097–2110. https://doi.org/10.1029/95WR01136.
- Xu, Z. S., D. J. Yu, and X. Z. Wang. 2019. “A Bibliometric Overview of International Journal of Machine Learning and Cybernetics Between 2010 and 2017.” International Journal of Machine Learning and Cybernetics 10 (9): 2375–2387. https://doi.org/10.1007/s13042-018-0875-9.
- Yaa’cob, N., Z. N. A. Abd Rashid, N. Tajudin, and M. Kassim. 2020. “Landslide Possibilities Using Remote Sensing and Geographical Information System,GIS).” IOP Conference Series: Earth and Environmental Science 540 (1): 012084. https://doi.org/10.1088/1755-1315/540/1/012084.
- Yalcin, A. 2008. “GIS-based Landslide Susceptibility Mapping Using Analytical Hierarchy Process and Bivariate Statistics in Ardesen,Turkey, Comparisons of Results and Confirmations.” Catena 72 (1): 1–12. https://doi.org/10.1016/j.catena.2007.01.003.
- Yalcin, A., and F. Bulut. 2007. “Landslide Susceptibility Mapping Using GIS and Digital Photogrammetric Techniques: A Case Study from Ardesen, (NE-Turkey).” Natural Hazards 41 (1): 201–226. https://doi.org/10.1007/s11069-006-9030-0.
- Yang, J., C. Cheng, S. Shen, and S. L. Yang. 2017. “Comparison of Complex Network Analysis Software: Citespace, SCI2 and Gephi//2017 IEEE 2nd International Conference on Big Data Analysis, (ICBDA).” IEEE, 169–172. https://doi.org/10.1109/ICBDA.2017.8078800.
- Yang, Z., J. Li, J. Hyyppä, J. Gong, J. Liu, and B. Yang. 2023. “A Comprehensive and Up-To-Date Web-Based Interactive 3D Emergency Response and Visualization System Using Cesium Digital Earth: Taking Landslide Disaster as An Example.” Big Earth Data, 1–23. https://doi.org/10.1080/20964471.2023.2172823.
- Yang, Z., C. Liu, R. Nie, W. C. Zhang, L. L. Zhang, Z. J. Zhang, W. L. Li, et al. 2022. “Research on Uncertainty of Landslide Susceptibility Prediction-Bibliometrics and Knowledge Graph Analysis.” Remote Sensing 14 (16): 3879. https://doi.org/10.3390/rs14163879.
- Yang, W., G. Pu, J. P. Paris, F. Cauneau, T. Ranchin, and Y. Li. 2001. “Applications of Orthophotomaps and Fusion of Landsat Tm, Spot, and Sar Images in the Studies of The Events to Stop Up Water Body and Ecological Environment in the Yangtze Three Gorges Project Region.” Hyperspectral Remote Sensing of the Land and Atmosphere 4151: 189–196. https://doi.org/10.1117/12.417007.
- Yang, Z., X. Yuan, C. Liu, R. Nie, T. Liu, X. Dai, L. Ma, M. Tang, Y. Xu, and H. Lu. 2022. “Meta-Analysis and Visualization of the Literature on Early Identification of Flash Floods.” Remote Sensing 14: 3313. https://doi.org/10.3390/rs14143313.
- Yilmaz, I. 2009. “Landslide Susceptibility Mapping Using Frequency Ratio, Logistic Regression, Artificial Neural Networks and Their Comparison: A Case Study from Kat Landslides, (Tokat-Turkey).” Computers & Geosciences 35 (6): 1125–1138. https://doi.org/10.1016/j.cageo.2008.08.007.
- Yuan, X., C. Liu, R. Nie, Z. Yang, W. Li, X. Dai, J. Cheng, et al. 2022. “A Comparative Analysis of Certainty Factor-Based Machine Learning Methods for Collapse and Landslide Susceptibility Mapping in Wenchuan County, China.” Remote Sensing 14: 3259. https://doi.org/10.3390/rs14143259.
- Zhang, F. Y., and X. W. Huang. 2018. “Trend and Spatiotemporal Distribution of Fatal Landslides Triggered by Non-Seismic Effects in China.” Landslides 15 (8): 1663–1674. https://doi.org/10.1007/s10346-018-1007-z.
- Zhao, C., Z. Lu, Q. Zhang, and J. de La Fuente. 2012. “Large-area Landslide Detection and Monitoring with ALOS/PALSAR Imagery Data Over Northern California and Southern Oregon, USA.” Remote Sensing of Environment 124: 348–359. https://doi.org/10.1016/j.rse.2012.05.025.
- Zhao, Y., X. Meng, T. Qi, F. Qing, M. Xiong, Y. Li, P. Guo, and G. Chen. 2020. “AI-based Identification of Low-Frequency Debris Flow Catchments in the Bailong River Basin, China.” Geomorphology 359: 107125. https://doi.org/10.1016/j.geomorph.2020.107125.
- Zhu, L., G. J. Wang, F. M. Huang, Y. Li, W. Chen, and H. Y. Hong. 2021. “Landslide Susceptibility Prediction Using Sparse Feature Extraction and Machine Learning Models Based on GIS and Remote Sensing.” IEEE Geoscience and Remote Sensing Letters 19: 1–5. https://doi.org/10.1109/LGRS.2021.3054029.