
 ?Mathematical formulae have been encoded as MathML and are displayed in this HTML version using MathJax in order to improve their display. Uncheck the box to turn MathJax off. This feature requires Javascript. Click on a formula to zoom.
ABSTRACT
Changes in wetland ecosystems have a critical impact on the local ecology and species diversity. Different development scenarios and policies are key factors influencing their changes. Therefore, we studied changes of wetlands in the middle Yangtze River basin (MYRB) in 2001–2020, and a patch-generated land use simulation (PLUS) model and random forest (RF) method were applied to predict and analyze the changes under different scenarios in the MYRB in the future (i.e.2035–2095). The results indicated that: (1) The regions with high wetland proportions were concentrated in the central and eastern MYRB in 2001–2020, with a 1.5% decrease in overall wetland area; (2) The RF could simulate the future ecological quality with training and testing accuracies of 0.98 and 0.92, respectively; (3) Remote Sensing Ecological Index (RSEI) less than 0.5 in the central and eastern regions and 13.3% reduction in the northwest in the SSP245 scenario. In general, the study provides a basis for future regional studies of ecosystem quality and provides data to support wetland conservation and management.
1. Introduction
In the context of global change, global biodiversity has declined dramatically with accelerated land-use change and the loss of wetlands (Chaplin-Kramer et al. Citation2015; Luck et al. Citation2004), posing a significant threat to the regional security of the ecosystem and the sustainable development of society and the economy (Ahmed Citation2014; Quesnelle, Fahrig, and Lindsay Citation2013). Global wetlands have been continuously lost since 1900 until the end of the twentieth century owing to human disturbances (Davidson Citation2014; Liao et al. Citation2018). Meanwhile, serious resource constraints and continuous high-intensity industrial-vehicular-domestic pollution have reduced the green living environment and threatened the safety of life and property and the sustainable development of the social economy (Zhu and Woodcock Citation2014). Therefore, considering the effects of land use/land cover changes (LUCC) on ecology under different scenarios can provide a basis for understanding future ecological changes and directions, serving as an important reference for future climate simulations and ecological change analysis (Sun et al. Citation2014; Zhang et al. Citation2022b).
In recent years, remote sensing has become essential for studying natural environments due to easy access to large and varied data and timeliness in analyses (Shi, Zhao, and Han Citation2010). The development of remote sensing technologies provides a large amount of data to support the assessment of environmental quality and to monitor ecological (Willis Citation2015). Various ecological indicators (e.g. forest area (Ochoa-Gaona et al. Citation2010), grassland (Sullivan et al. Citation2010), green space (Gao et al. Citation2020), cities (Gupta et al. Citation2012), and water bodies (Xu Citation2006)), can be easily calculated from easily accessible remote sensing data, which are widely used in research to monitor ecological quality and environmental problems. Although single indicators are easy to calculate and accessible in large quantities, multiple indicators can better reflect the spatial and temporal variation of regional ecology and provide more information to facilitate research (Hu and Xu Citation2018). Therefore, to better analyze ecological conditions and patterns of change, several single indices synthesized as ecological composite indices have been combined with remote sensing techniques to assess regional ecological changes (Foody Citation2007). Currently, remote sensing is one of the most important tools for obtaining the status of regional wetlands, the key to ecological evaluation and identification (Rashid and Aneaus Citation2020).
Since the expansion of urbanization and the rapid development of the economy, the fragmentation of wetlands has been increasing, seriously affecting their ecological health (Li et al. Citation2020). Irrational land use has damaged Irrational land use has damaged the integrity, deepened fragmentation, reduced the overall connectivity, and impacted normal hydrological processes in wetlands (Foti et al. Citation2012), further degrading them (Zheng et al. Citation2012). Moreover, the hydrological processes and connectivity of wetlands are important indicators of wetland functional stability; an important basis for maintaining the regional ecological level (Amoros and Bornette Citation2002; Simioni, Guasselli, and Etchelar Citation2017). Therefore, the reduction in connectivity usually implies the degradation of wetland ecological functions (Cohen et al. Citation2016; Zhang and Wu Citation2018). Numerous studies have shown that eco-hydrological patterns and connectivity of wetlands are important for maintaining the regional ecological environment through the protection and restoration role in the wetland ecology system, ensuring regional structural connections and functional connectivity (Cai et al. Citation2021; Verheijen, Varner, and Haukos Citation2018; Xia et al. Citation2021). Therefore, both are key indicators for the evaluation and identification of the wetland ecological quality.
However, the spatial and temporal characteristics of land use are non-static and interlinked with various factors (precipitation, temperature, gross domestic product (GDP), population, etc.) in changing environments (Kim, Newman, and Güneralp Citation2020). Land use simulation is a key field of land use and land change (LULC) research which can be carried out effectively using existing land classification data (Pijanowski et al. Citation2002). Cellular automaton (CA) has been widely applied to study the spatial and temporal variation of LULC under the influence of natural and social conditions at different scales since Tobler (Citation1979) introduced it in geographic modeling. However, most research on CA modeling has focused on technical modeling procedures, model calibration, and rule improvements, with little attention paid to a conceptual understanding of the root causes of land-use change (Cao et al. Citation2015). As the improvement of models and techniques is the focus and challenge of most studies on CA, modeling the exploration and understanding of the fundamental causes of LULC changes are missing in those studies (Guy et al. Citation2002; Xiao et al. Citation2002). However, the patch generation land use simulation (PLUS) model based on the CA model can accurately simulate the inherent nonlinear relationships in LULC changes and improve the accuracy of LULC simulations (Liang et al. Citation2021). It is often used in LULC change simulation studies because of its application in inaccurate simulations under different climatic and human-influenced conditions (Zhai et al. Citation2021a). In addition, it achieves a complex relationship between simulated land expansion and its drivers using machine learning methods to form top-down rule constraints to accurately simulate LULC (Chen, Wen, and Luo Citation2021b). Compared with the bottom-up structure of the CA model, it innovatively adds a multi-type stochastic seeding mechanism based on threshold reduction, while retaining the original advantages of the LULC prediction model (Güneralp and Seto Citation2013). It can also reflect the complex path dependence of changes and positive feedback mechanisms in the urban-land expansion process (Zhai et al. Citation2021a). Therefore, the model can be utilized for multi-scenario simulations of LULC changes under the influence of different factors.
The model, combined with the random forest approach, can accurately realize the simulation of future changes in multiple scenarios of land types and provide decision support for future wetland conservation and management.
The middle spread of the Yangtze River Basin (MYRB) in China, rich in water resources of various conditions, has not only become a prominent geographical area with economic advantages, but also its excellent natural conditions have become a very important ecological nurturing area and a rich gene pool of species (Shao et al. Citation2020). It has developed into an important biodiversity hotspot due to its strong ecological functions (Li Citation2011). The most advantageous area for the development of eastern and western China, MYRB, has become an important connecting area for the development of the Yangtze River Basin and a key area for urban economic development (Chen et al. Citation2020). However, rapid urbanization and wetland loss have become major threats to the ecology of the MYRB (Wohlfart et al. Citation2016). Over the past 60 years, China's coastal wetlands have declined by nearly 50%, with a reduction of 8.4 million hm2 from 1990 to the present (An et al. Citation2007). Furthermore, numerous studies have indicated high wetland loss, as much as 64-71%, since 1900 (Davidson Citation2014). Therefore, it is necessary to study the changes in ecological quality in the MYRB region under different scenarios. To simulate and analyze the future ecological situation in the MYRB region under different scenarios, we focus on: (1) The changes in the wetland and ecological conditions in the MYRB region from 2001–2020 (2) transformation of landscape and wetland areas under different scenarios (3) changes in the ecological quality of wetlands in the MYRB under different scenarios. Overall, the ecological health study of MYRB not only provides data support for wetland conservation, but also provides decision support for the conservation of ecological health in the region.
2. Study area
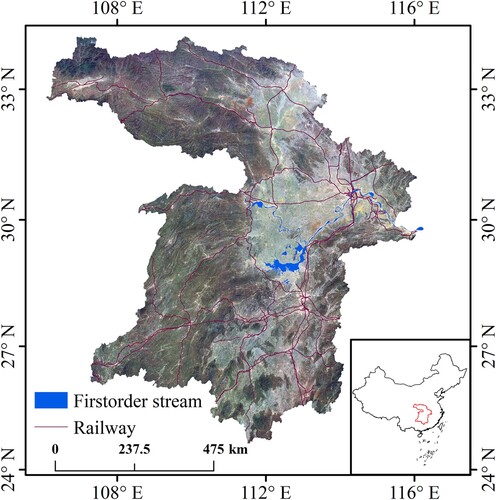
The MYRB is the main stream of the Yichang Hukou section of the Yangtze River, and consists of several lakes and corresponding tributaries of the MYRB covering the area (106°5′–118°36′E, 24°29′–34°12′N) () (Zhao et al. Citation2018). It has a total length of 927 km and an area of approximately 680,000 km², covering nine provinces and 58 cities in total (Yang et al. Citation2020). The study area has a subtropical monsoon climate and a complex distribution of river channels, with an average annual temperature of 14–18 °C, and average annual rainfall of 700–2000 mm (Wang et al. Citation2021). Over the past 60 years, climate change and anthropogenic activities the relationship between rivers and lakes in the MYRB have led to a series of problems in the region's water resources, environment, ecology, and social development (Chen et al. Citation2020; Liu et al. Citation2020b). The area of Poyang Lake and Dongting Lake in the middle and lower spreads of the Yangtze River Plain has been reduced from 5190 to 3750 km² and from 4350 to 2625 km², respectively, due to long-term sedimentation and large-scale land enclosure from the 1950s to the 1970s. This situation poses a great threat to the ecological security of the MYRB (Xu, Xie, and Wang Citation2022).
Figure 1. Study area map.
3. Materials and methods
3.1. Data and preconditioning
We acquired the surface reflectance images (Landsat 5 and 8) of the United States Geological Survey from the Google Earth Engine (GEE) platform (https://earthdata.nasa.gov/). The platform allowed compositing and cropping operations and a 30-meter image resolution was sufficient to reflect feature changes while still ensuring adequate data volume. MYRB Boundary from the Resource and Environmental Science and Data Center, Institute of Geographical Sciences and Resources, Chinese Academy of Sciences (https://www.resdc.cn/).
This study simulated future land-use change impacted by 16 different drivers with a strong influence on land types as suggested from natural, social, and economic aspects. Five of these factors, elevation; slope; precipitation; temperature; and soil type, represent the impact of changing conditions, such as natural climate, on land use change; distances to a primary and secondary lakes, distances to a primary, tertiary, and quaternary roads; proximity to a highway and railroad represent the impact of human activities on land use change under social conditions; gross domestic product(GDP) represents the impact of changing economic conditions in the region on the changing demand for land use (e.g. property development, construction of parks, etc.). To ensure consistency of the data formats, all data layers were gridded in TIFF format, the distances were all Euclidean, and the slope was calculated from the elevation data in the GEE platform.
Four main drivers (i.e. GDP, POP, temperature, and precipitation) were chosen to control for the three shared socioeconomic pathways (SSP)-representative concentration pathways (RCP) (SSP-RCP) future scenarios (i.e. SSP1 and RCP2.6 (SSP126), SSP2 and RCP4.5 (SSP245) and SSP5 and RCP8.5 (SSP585)).
The specific sources of the data are shown in (Liang et al. Citation2021).
Table 1. Driving data sources.
3.2. Methods
3.2.1 Random forest land classification
To obtain the LULC impact for the selected period, we used the smile random forest method in the GEE platform to classify the Landsat synthetic images for 2001, 2005, 2009, 2013, 2017 and 2020.
Random forest (RF) is the general name of a set of methods using a tree classifier (1).
(1)
(1) where
is an independent identically distributed random vector and x is a pattern of input.
During training, the random forest created multiple CART-like trees (n), and each tree was searched for segmentation only on a random input variable derived from the original training sample (Breiman et al. Citation1984). In the classification, the result of input sample X is determined by the most popular category among the voting results of each tree. RF shows good classification performance when dealing with multicollinearity and high-dimensional data, owing to its unique fault tolerance. RF can easily measure the relationship between input and output variables, resulting in good performance explaining the relationship between the land changes.
3.2.2 RSEI calculation
To investigate the degree of landscape fragmentation and connectivity in the study area, we calculated the percentage of wetlands and calculated the density-related index (patch density (PD), number of patches (NP), largest patch index (LPI)), shape-related index (mean shape index (SHAPE_MN), landscape shape index (LSI), mean fractal dimension index (FRAC_MN), mean perimeter-area ratio (PARA_MN)) and connectivity-related index (mean fractal dimension index (FRAC_MN)) and connectivity-related indices (patch cohesion index (COHESION), proportion of like adjacencies (PLADJ), circumscribing circle (CIRCLE_MN), landscape division index (DIVISION), aggregation index (AI), contiguity index (CONTIG_MN)) based on FRAGSTATS 4.2, the area and density index (ADI) and wet connectivity index (WCI) were fitted using principal component analysis.
This study used the remote sensing ecological index (RSEI) to quantify the ecological situation in the area. RSEI was calculated as a composite ecological index as follows.
The normalized difference vegetation index (NDVI) is used to express the regional greenness. NDVI is closely related to plant biomass, plant leaf area, and plant coverage and can represent the greenness of the region.
(2)
(2) where
and
are the near infrared and red band reflectance, respectively.
The normalized differential build-up and bare soil index (NDBSI) can represent the changes and destruction of the original natural ecosystem by human construction, housing, and activities causing passive drying of the ground, which is a negative index (Guha et al. Citation2020).
(3)
(3)
(4)
(4)
(5)
(5) where
,
,
,
and
are the reflectance of blue, green, red, near-infrared, and short-infrared bands 1, respectively.
The modified normalized difference water index (MNDWI) can distinguish between water bodies, buildings, plants, wetlands, and bare soils; and is closely related to changes in the ecological environment (Soltanian, Abbasi, and Bakhtyari Citation2019).
(6)
(6) where
is the mid-infrared band.
Land surface emissivity (LST) can indicate the heat condition in the area.
(7)
(7)
(8)
(8)
(9)
(9) where
is the land surface emissivity,
is the actual surface temperature,
is the blackbody thermal radiance,
is the atmospheric thermal infrared transmittance,
is the thermal infrared radiance,
is the upward atmospheric radiance, and
is the downward atmospheric radiance.
In this study, NDVI, NDBSI, MNDWI, and LST indices representing greenness, dryness, humidity, and heat were calculated from ordinary multi-band remote sensing images. The four calculated indices were used as the four bands of the original image, the principal components of each band were extracted by principal component analysis, and the largest principal component was selected as the value of RSEI. The calculation formula for RSEI is as follows:
(10)
(10) The calculated four indices are used as the four bands of the original image, and the useful information of different bands is aggregated into the first few bands by the method of principal component analysis, and after removing the useless bands, they are sorted according to the percentage of principal components, and the largest principal component is selected as the RSEI value.
3.2.3 PLUS model
The patch-generated land use simulation (PLUS) model effectively integrates a rule mining framework based on a land sprawl analysis strategy with CA based on multiple types of random patch seeds (Liang et al. Citation2021). The RF approach was used to explore the probability of change in each patch land class under the influence of the drivers.
(11)
(11) where
is the ultimate growth probability of land use k in cell i, I(·) is the indicative function, hn(x) is the prediction result of the nth decision tree for vector x, and M is the total number of decision trees.
Meanwhile, the top-down constraint approach and stochastic seeding mechanism based on threshold descent form a new advantage of the model.
(12)
(12) where
is the growth probability surface of LULC,
is a random value in 0-1,
is the threshold for generating new LULC patches by user-determined land use type
.
The PLUS model allows for a clearer and more intuitive understanding of the internal mechanisms of LULC changes in ecosystems affected by complex conditions (https://github.com/HPSCIL/Patch-generating_Land_Use_Simulation_Model).
To complete the simulation, in addition to the basic classification data for the simulation, it is necessary to select suitable driving factors from various aspects such as natural, economic and social as input data according to the characteristics and impact conditions of the land type changes in the simulation area.
Before the simulation it is necessary to simulate the 2020 LULC based on the 2015 drive data as well as the LULC data, compare the calculated results with the 2020 published dataset and use the Kappa coefficient to describe its simulation accuracy. Its simulation accuracy and kappa coefficient were 89.6% and 0.82.
3.2.4 Simulation of different scenarios
Different natural and economic conditions have diverse effects on future LULC changes. According to the simulation scenario, we divided future development into three types: (1) ecological protection (EP). (In this case, sustainable development is based on ecological protection, thus reducing the burning of fossil fuels and protecting the environment); (2) business as usual (BAU) (this situation will maintain the current development scenario); and (3) economic development (ED). (In this case, economic development is the main objective to be considered; fossil fuels are used in large quantities). The scenarios correspond to different factor combinations: EP corresponds to SSP126 scenarios, BAU to SSP245, and ED to SSP585.
4. Results
4.1. Historical environment index analysis
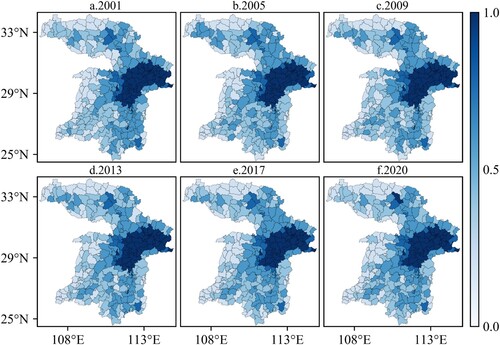
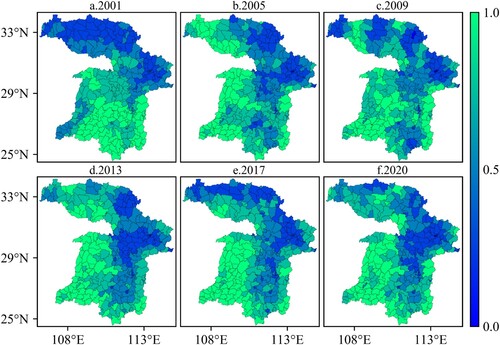
shows the proportion of wetlands during the selected time period. Notably, wetlands were mainly distributed in the central and eastern regions. Of which wetlands were reduced by a total of 1.5%. The areas with a high percentage of wetlands were mainly concentrated in the area adjacent to the main stream of the Yangtze River, which has many tributaries and wetlands. In addition, most counties in the north and southwest region contained high proportion of wetlands, while in the northwest and eastern regions the proportion of wetlands was lower. Minor changes were observed in the proportion of wetlands from 2001 to 2020, with the main changes concentrated in the northwestern region, where the proportion of wetlands was low. The percentage of wetlands increased by 218.3% in 2005–2017, decreased in 2020, and returned to the base level in 2001. Overall, across the study area, the wetland area increased by 1.6% during the period 2001–2020.
Figure 2. Proportion of wetlands in historical period in the MYRB based on the remote sensing images.
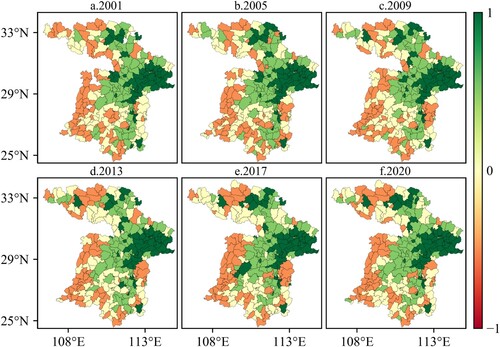
Change in wetland area and density index (ADI) from 2001 to 2020 is shown in . In general, the northern counties and regions close to the main stream of the Yangtze River had a higher ADI (greater than 0.75). In addition, unlike the southwestern counties of the MYRB, where the ADI was at a low level (less than 0.1), the central and northern parts had a high ADI, which was similar to the results of the distribution of wetlands, whose annual changes are mainly concentrated in the northern part. The ADI of counties in the northwest increased by 61.1% during 2001–2013 and decreased by 83.4% in individual counties by 2020. However, the overall ADI increased compared with that in 2001.
Figure 3. Area and density index in historical period in the MYRB based on the remote sensing images.
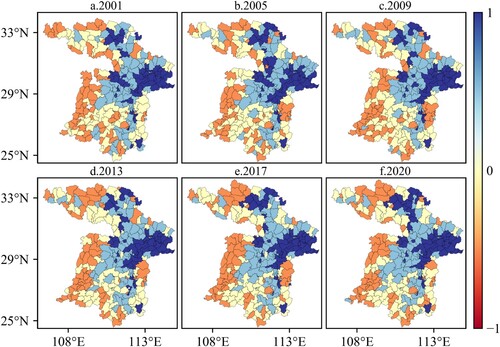
shows the wetland landscape connectivity index (WCI) in 2001–2020. The distribution of WCI is similar to the distribution of ADI – higher in the central and eastern regions and lower in the western counties. The difference was that many counties in the northwest had increasing WCI from lower levels (less than 0.08) in 2001 to 2020 similar to those in the southwest. The WCI for many counties in the northwest improved by a total of 71.1% from 2005 to 2020. By 2020, many counties recovered to the medium level, but two southern counties experienced a total decline of 193.0%.
Figure 4. Historical wetland landscape connectivity index in the MYRB based on the remote sensing images.
4.2. Historical ecological change analysis
The RSEI in each county during 2001–2020 is presented in . Regions with good ecological quality were mainly concentrated in the South and Southwest. The RSEI levels in the central, southern, and northern counties were low. The ecological quality of the counties in the MYRB also changed significantly from 2001 to 2020. In contrast to the southern counties with a higher RSEI (greater than 0.8), the northwestern region had lower levels of RSEI (less 0.06) in 2001. In 2005, the RSEI began to rise widely in counties in the Northwest and Southwest, with an average increase of 43.8%, while the RSEI of southern and central counties decreased by an average of 12.1%. The RSEI in the northwest counties began to decline in 2017, with an average reduction of 27.9% compared with 2013 yet those counties began to improve in 2020, with an average increase of 20.9%. Generally, the RSEI in the counties of the MYRB changed frequently in 2001–2020 (e.g. the situation in the northwest and southwest counties improved, but those in the middle and south declined).
Figure 5. Historical RSEI in the MYRB based on the remote sensing images.
4.3. Future environment index analysis
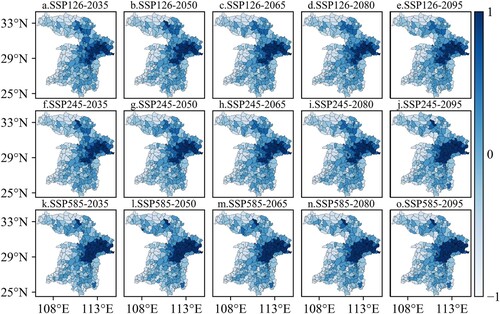
The proportions of wetlands under different future scenarios vary slightly, as shown in . In SSP126 scenario, the proportion of wetlands in the North and South is lower than the proportion of wetlands in the central and eastern regions. In 2035–2050 the proportion of wetlands in the northern counties will increase by 10.2%, yet there will be little change in the other regions. From 2050 to 2095, the proportion of wetlands in some counties in the central area will increase by 30.4%. In SSP245 scenario, the proportion of wetlands is similar to that in SSP126, but the change is slightly different. The proportion of wetlands in many counties in the northern region decreases by 35.2% in 2035–2080, and increases by 10.2% in 2095. In addition, the proportion of wetlands in many counties in the central and eastern regions increases significantly. In SSP585 scenario, the proportion of wetlands in the central and eastern regions is larger, while counties with a low proportion of wetlands are mainly concentrated in the Northwest and West. For example, the proportion of wetlands in many counties in the Northwest increases by an average of 5.0% in 2035–2065, while the proportion of wetlands in counties in the West decreases by 18.6%. By 2080, the proportion of wetlands in the western counties will increase by an average of 54.5% and decrease by 27.8% in the northern counties but return to a level similar to that of 2035 in 2095.
Figure 6. Proportion of wetlands under different scenarios in the future in the MYRB based on the PLUS.
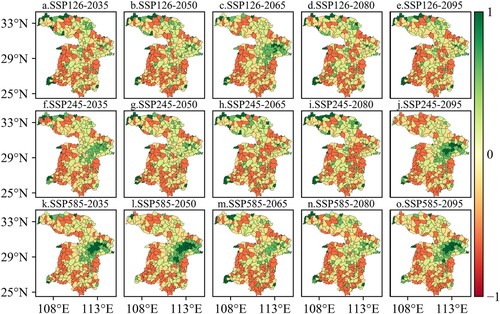
The area and density indices under different future scenarios are shown in . The distribution and changes in the ADI are different under different scenarios. In SSP126 scenario, counties with high ADI are mainly distributed in the northwest and southwest edges of the MYRB, while counties with low ADI are mainly concentrated in the West and scattered in the South. The ADI in the central area increases by an average of 152.1% in 2035–2065, with considerable increases in many counties, whereas the ADI in many counties in the Northwest decreases by an average of 162.2%. From 2065 to 2095, the ADI in the central region begins to decline gradually, while the ADI in many counties in the Northwest increases. In SSP245 scenario, the changes are relatively frequent. The ADI of counties in the central and eastern regions decreases by an average of 91.4% during 2035-2065, the ADI of many counties in the Northwest increases by 17.2%. The ADI level of the central and eastern regions gradually increases during 2065-2095, with a significant 29.3% decrease in many counties in the northern region. In SSP585 scenario, the ADI level in the central and eastern regions are high, and there are many counties with a low ADI in the entire southern region of the MYRB. The ADI of many counties in the central, eastern, and southern regions decreases significantly, with an average increase of 26.2% in the North during 2050-2080. By 2095, the ADI levels will increase in many counties in the central and eastern regions, while the ADI in the Northwest will not recover to 2035 levels despite significant increases.
Figure 7. Area and density index under different scenarios in the MYRB based on the simulation of PLUS.
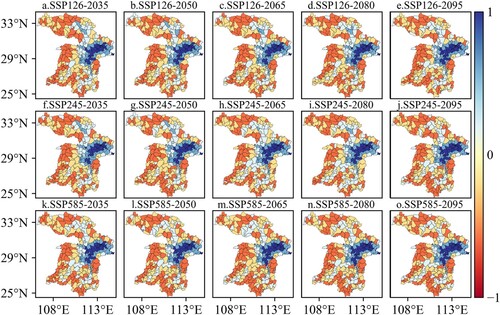
presents the WCI under different future scenarios. In general, under different scenarios, counties with high WCI are mainly concentrated in the central and eastern regions, and counties in the Northwest and Southwest have low WCI levels. In SSP126 scenario, the WCI changes are mainly concentrated in the northern region. The WCI of several counties in the North and Northwest will increase significantly in 2035–2050. The WCI in northwestern counties decreases by 14.5%. Compared to 2035, the WCI of individual counties in the northern region will decrease by 2095. In SSP245 scenario, the spatial change in the WCI is similar to that in SSP126. The WCI increases by an average of 9.9% in several northern counties during 2035–2050 and decreases by an average of 41.0% in many northern counties during 2050–2095. In general, compared to 2035, the WCI in many northern counties decreases significantly, and the reduction range is less than that in SSP126. In SSP585 scenario, the WCI of many counties in the Northwest increases and decreases in a fluctuating manner during 2035–2095, but the WCI of many counties in the North will be significantly higher in 2095 than in 2035.
Figure 8. Wetland connectivity index in the MYRB under different scenarios in the future.
4.4. Prediction results and change analysis
The accuracy of the future RSEI in the simulation using random forest method is displayed in . The training accuracy was 0.9857 and the test accuracy was 0.9200. The high accuracy shows that using the selected factors to predict RSEI under different future scenarios has good reliability and authenticity.
Table 2. RF classification method training and test accuracy.
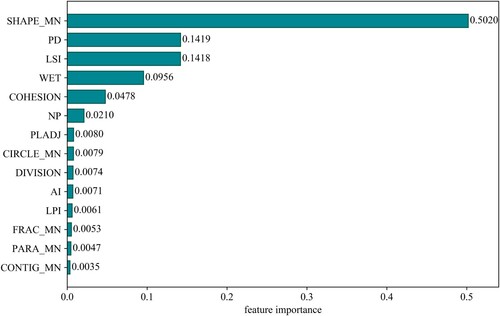
The importance of various factors when simulating future RSEI is shown in . When simulating the RSEI of different counties under different future scenarios, it is clear that the mean shape index (SHAPE_ MN), patch density (PD), landscape shape index (LSI), proportion of wetlands (WET), and number of patches (NP) account for a high proportion. Among them, one of the SHAPE_MN, which had the same shape index as LSI, was significantly higher than the other factors, which also indicates that the shape index had the greatest influence on the variation in RSEI during the simulation. NP and PD constitute the density index, and their high proportion also shows that the number and density of blocks had a high impact on the change in RSEI. In addition, the proportion of wetlands in each county is an important factor affecting RSEI.
Figure 9. Importance of future simulation features.
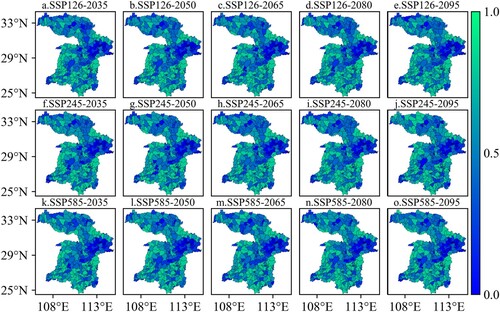
The simulated RSEI values under different scenarios are shown in . Overall, counties with high RSEI were mainly distributed in the South and Northeast, while counties in the Center, South, and Southwest had low RSEI. In SSP126, the RSEI of individual counties in the Northwest and South increased by an average of 8.3% in 2035-2050, and continued to improve in 2050-2080, but the change was small. By 2095, the level of the RSEI in several counties in the northwest declined to levels below those in 2035. In SSP245, the RSEI level of many counties in the Northwest decreased by 13.3% during 2035-2080, and the RSEI of individual counties in the South increased. In SSP585, the distribution of different RSEI was similar to that in other scenarios, but the changes in northwest counties were more intense during 2035-2095. The RSEI in the Northwest increased by 2.6% in 2035–2050, decreased by 4.0% in 2065, and improved by 2065–2080. By 2095, the RSEI in many counties in the Northwest decreased by 2.2%, but the RSEI in the Northwest increased overall compared to 2035.
Figure 10. Future simulation RSEI.
5. Discussion
5.1. Wetland and ecological changes analysis
According to the proportion of wetlands, ADI, and WCI, regions with high index values were mainly concentrated near the mainstream of the Yangtze River in the twentieth century and the early twenty-first century, wetlands were disappearing at a faster rate. Numerous studies have indicated high wetland loss, as much as 64–71%, since 1900 (Davidson Citation2014; Hu et al. Citation2017; Li et al. Citation2018). Losses in inland wetland are greater and faster than those of coastal natural wetlands, especially in Asia. The large-scale and rapid transformation of coastal and inland natural wetlands continues (An et al. Citation2007). The wetlands in the MYRB area have undergone a similar transformation. The wetland level in many counties decreased in the MYRB during 2000–2020, and the percentage of consistent wetlands was low. The significant reduction in wetlands also seriously affects the change in area ecological quality (Sileshi et al. Citation2020).
From 2001 to 2020, China's rapid economic, industrial, and urban development affected the quality of wetlands and the original environment, with a 27.9% wetland decline from 2013 to 2017 in the northwest region (Dai et al. Citation2020). Li et al. (Citation2009) reported that the ecological quality of the Hanjiang River basin improved in 2009. However, after 2009, the river basin was moderately polluted, which is similar to the substantial decline in RSEI in the central MYRB region in our study, with the continuous development of the economy and the continuous expansion of urban agglomeration. In addition, the ecological quality of densely populated areas in the Center and South of the MYRB has been deteriorating, but many counties in the North have improved (Wang, Yao, and Zhou Citation2014). The water quality of the major lakes and reservoirs in Hubei and Hunan provinces has been moderately polluted by 2020 (Lu et al., Citation2021). In this study, the ecological quality of counties in the Hubei region decreased on average by 31.0% in 2001–2020, the ecological service value in Hubei Province also showed a large decrease (Jiu Citation2021). Concerned by the increasingly serious environmental problems in the MYRB, the Ministry of Water Resources drafted the Yangtze River Protection Law in July 2018 and implemented it on March 1, 2021 (Chen et al. Citation2021a). This policy has also included a plan to improve the ecological quality of the MYRB (Zhang et al. Citation2022a).
5.2. Analysis of environmental index simulation results
The wetland situation will differ depending on the future scenarios (Peng et al. Citation2020). Counties with high wetland levels were concentrated near the main stream and tributaries of the Yangtze River under various scenarios, whereas the higher proportion of wetlands under the SSP585 scenario was near the main stream of the Yangtze River. Zhai et al. (Citation2021b) also illustrated that areas with higher ecological risks are mainly concentrated in suburban areas. Under the SSP126 and SSP245 scenarios, the number of counties with relatively high wetland proportions will increase significantly in 2035–2095 as various policies are implemented and people become conscious of conservation (Chen et al. Citation2021a). MYRB is known as the ‘land of thousands of lakes’. With environmental protection, the numerous rivers and lakes would also increase the area of wetlands (Yin et al. Citation2007). In addition, the transformation of other land types was also an important reason for the increase in wetlands (Harmáčková and Vačkář Citation2015; Nelson et al. Citation2009).
The ADI changed significantly under different scenarios. The protection of wetlands under the SSP126 scenario resulted in an average increase of 10.2% in wetland area during 2035–2095, as well as a denser and less fragmented wetlands (Zhang et al. Citation2022b), which has long been shown to be far less threatened under environmental protection scenarios than under other scenarios (Zhai et al. Citation2021b). In contrast, the fragmentation of wetlands was high and there was no centralized distribution in the SSP245 scenario. Liu et al. (Citation2017) showed that wetlands began to transform into other land types; a large number of wetlands were occupied by farmland (Liu et al. Citation2017; Zheng et al. Citation2016). In the SSP585 scenario, rapid economic development and expansion of urban agglomerations caused a decline in the ADI due to damage to the integrity of wetlands (Liu et al. Citation2020b; Rehmani et al. Citation2021). Similar results were found for the significant increase in built-up areas (from 9.06% to 76.16%) in the region, which also caused a significant decrease in wetland areas, from 58.6% to 20.7% (Mind’je, Mindje, and Kayumba Citation2021).
5.3. Analysis of ecological situation simulation results
The RF method was used to simulate the future ecological quality of different scenarios. The results show that RF has a training accuracy of 0.98 and a testing accuracy of 0.92. The RF method is often used to simulate ecological and land type changes, and often shows good simulation accuracy (Peng et al. Citation2020). Although there are different classifier choices for different requirements, RF produces accurate results in various scenarios and requirements (Shetty Citation2019). In recent years, RF has become a popular and effective land classification method (Gislason, Benediktsson, and Sveinsson Citation2004). Among the different indicators, the shape, density, and proportion of wetlands have a great impact on the changes in ecological quality in different future scenarios, which is also related to the unique geographical environment of the MYRB. Liu et al. (Citation2020a) revealed that cities in the MYRB region became more compact and differentiated, which is also consistent with the results of our research (Liu et al. Citation2020a). Changes in wetlands have a significant impact on the ecological situation of the region (Verhoeven et al. Citation2006).
The ecological conditions under the different scenarios varied. In general, counties with poor ecology were mainly concentrated in the central region and near the main stream of the Yangtze River, resulting from the rapid regional economic development of the MYRB (Rehmani et al. Citation2021). Building expansion has led to the destruction of natural ecology and low ecological quality (Fu et al. Citation2018; Li et al. Citation2021). In the SSP126 scenario, the ecological change was not dramatic, and the ecological quality improved, which was closely related to the ecological protection policy (He et al. Citation2020). In the SSP245 scenario, regional changes in ecological quality were more frequent, and regional changes in wetlands also affected the changes in ecological conditions. Overall, ecology has improved, which is similar to the results of ecological restoration under the normal development of Anhui Province (Hu et al. Citation2020). Under the SSP585 scenario, the building clusters have increased and concentrated in areas with poor ecological quality, with a high proportion of wetlands, but serious fragmentation and low connectivity. This has always been one of the main causes of wetland loss and ecological damage in different studies (Gong et al. Citation2010; Hubacek et al. Citation2009).
In addition, simulation studies of future ecological changes are important for the ecological security and sustainable development aspects of wetland ecosystems. In the SSP585 scenario, economic development is accompanied by the destruction of the natural environment and human activities seriously affect the ecological security of wetlands (An et al. Citation2007). While in the SSP126 scenario, issuing coping strategies and focusing on ecological protection do effectively reduce the threats and pressures on wetlands (Moomaw et al. Citation2018), the practice of routine ecological supervision and the promulgation of laws and regulations are effective means to protect the ecological health of wetlands (Sun et al. Citation2015).
6. Conclusions
In this study, we used Landsat satellite data, the RF method to classify the land, and the PLUS model to simulate future wetland changes under different scenarios. We calculated a variety of indicators at the county level, simulated the ecological situation under various future scenarios, and analyzed the change characteristics. The results of this analysis are as follows:
From 2001 to 2020, regions with a high wetland proportion, ADI, and WCI were mainly concentrated in the central and eastern areas of the MYRB. Counties with high ecological quality were mainly concentrated in the Southwest. The overall change was small, and the main changes occurred between 2001–2005 and 2013–2017.
Increase in wetland area under different future scenarios. The ADI varies considerably under different scenarios. Under the SSP126 scenario, the protection of wetlands resulted in an average increase of 10.2% in wetland area between 2035 and 2095. In contrast, under the SSP245 scenario, wetlands are highly fragmented and not concentrated. In the SSP585 scenario, rapid economic development and expansion of urban agglomerations lead to a decline in ADI as the integrity of wetlands is compromised.
Among different future scenarios, the differences were mainly concentrated in the changes at the northern boundary. The largest changes were observed in the SSP245 scenario (decreased by 13.3% in the Northwest in 2035–2080). The most frequent changes, but smaller changes were obtained in the SSP585 scenario. Human activities and economic development pose a great threat to the safety of wetlands. Effective monitoring of wetland ecology and enactment of policies to protect wetlands are effective means to protect wetland ecology and improve the ecological health of wetlands.
Supplemental Material
Download MS Word (16.5 KB)Acknowledgements
Remote sensing image data used to calculate NDVI, NDBI, and MNDWI band were derived from https://developers.google.com/earth-engine/datasets/catalog/landsat. The SSPs scenario data were derived from Professor Jiang Tong's team at the Institute of Disaster Risk Management, Nanjing University of Information Engineering. The PLUS model was downloaded from https://github.com/HPSCIL/Patch-generating_Land_Use_Simulation_Model. We would like to express our sincere thanks to all data supporters and websites.
Disclosure statement
No potential conflict of interest was reported by the author(s).
Additional information
Funding
References
- Ahmed, F. 2014. “Cumulative Hydrologic Impact of Wetland Loss: Numerical Modeling Study of the Rideau River Watershed, Canada.” Journal of Hydrologic Engineering 19 (3): 593–606. https://doi.org/10.1061/(ASCE)HE.1943-5584.0000817.
- Amoros, C., and G. Bornette. 2002. “Connectivity and Biocomplexity in Waterbodies of Riverine Floodplains.” Freshwater Biology 47 (4): 761–776. https://doi.org/10.1046/j.1365-2427.2002.00905.x.
- An, S., H. Li, B. Guan, C. Zhou, Z. Wang, Z. Deng, Y. Zhi, et al. 2007. “China's Natural Wetlands: Past Problems, Current Status, and Future Challenges.” AMBIO: A Journal of the Human Environment 36 (4): 335–342. 8 https://doi.org/10.1579/0044-7447(2007)36[335:CNWPPC]2.0.CO;2.
- Breiman, L., J. Friedman, R. Olshen, C. Stone, R. Olsen, L. Breimann, et al. 1984. “Classification and Regression Tress.” Encyclopedia of Ecology 40: 582–588. http://doi.org/10.2307/2530946.
- Cai, Y., J. Liang, P. Zhang, Q. Wang, Y. Wu, Y. Ding, H. Wang, C. Fu, J. Sun, et al. 2021. “Review on Strategies of Close-to-Natural Wetland Restoration and a Brief Case Plan for a Typical Wetland in Northern China.” Chemosphere 285: 131534. https://doi.org/10.1016/j.chemosphere.2021.131534.
- Cao, M., Ga. Tang, Q. Shen, and Y. Wang. 2015. “A new Discovery of Transition Rules for Cellular Automata by Using Cuckoo Search Algorithm.” International Journal of Geographical Information Science 29 (5): 806–824. https://doi.org/10.1080/13658816.2014.999245.
- Chaplin-Kramer, R., R. P. Sharp, L. Mandle, S. Sim, J. Johnson, I. Butnar, L. Milà i Canals, et al. 2015. “Spatial Patterns of Agricultural Expansion Determine Impacts on Biodiversity and Carbon Storage.” Proceedings of the National Academy of Sciences 112 (24): 7402–7407. https://doi.org/10.1073/pnas.1406485112.
- Chen, Z., M. Huang, D. Zhu, and O. Altan. 2021a. “Integrating Remote Sensing and a Markov-FLUS Model to Simulate Future Land Use Changes in Hokkaido, Japan.” Remote Sensing 13: 2621. https://doi.org/10.3390/rs13132621.
- Chen, K. J., C. H. Wen, and Y. C. Luo. 2021b. “Yangtze River Protection Law Opening a new Chapter of Mother River Protection.” China Environment News, 003.
- Chen, W., H. Zhao, J. Li, L. Zhu, Z. Wang, and J. Zeng. 2020. “Land use Transitions and the Associated Impacts on Ecosystem Services in the Middle Reaches of the Yangtze River Economic Belt in China Based on the geo-Informatic Tupu Method.” Science of the Total Environment 701: 134690. https://doi.org/10.1016/j.scitotenv.2019.134690.
- Cohen, M. J., I. F. Creed, L. Alexander, N. B. Basu, A. J. K. Calhoun, C. Craft, E. D’Amico, et al. 2016. “Do Geographically Isolated Wetlands Influence Landscape Functions?” Proceedings of the National Academy of Sciences 113 (8): 1978–1986. https://doi.org/10.1073/pnas.1512650113.
- Dai, X., L. Wang, C. Huang, L. Fang, S. Wang, and L. Wang. 2020. “Spatio-temporal Variations of Ecosystem Services in the Urban Agglomerations in the Middle Reaches of the Yangtze River, China.” Ecological Indicators 115: 106394. http://doi.org/10.1016/j.ecolind.2020.106394.
- Davidson, N. C. 2014. “How Much Wetland has the World Lost? Long-Term and Recent Trends in Global Wetland Area.” Marine and Freshwater Research 65 (10): 934–941. https://doi.org/10.1071/MF14173.
- Foody, G. M. 2007. “Editorial: Ecological Applications of Remote Sensing and GIS.” Ecological Informatics 2 (2): 71–72. https://doi.org/10.1016/j.ecoinf.2007.06.001.
- Foti, R., Jesus M. del, A. Rinaldo, and I. Rodriguez-Iturbe. 2012. “Hydroperiod Regime Controls the Organization of Plant Species in Wetlands.” Proceedings of the National Academy of Sciences 109 (48): 19596–19600. https://doi.org/10.1073/pnas.1218056109.
- Fu, Q., Y. Hou, B. Wang, X. Bi, B. Li, and X. Zhang. 2018. “Scenario Analysis of Ecosystem Service Changes and Interactions in a Mountain-Oasis-Desert System: A Case Study in Altay Prefecture, China.” Scientific Reports 8: 1–13. http://doi.org/10.1038/s41598-018-31043-y.
- Gao, P. W., A. Kasimu, Y. Y. Zhao, B. Lin, J. P. Chai, T. Ruzi, et al. 2020. “Evaluation of the Temporal and Spatial Changes of Ecological Quality in the Hami Oasis Based on RSEI.” Sustainability 12. http://doi.org/10.3390/su12187716.
- Gislason, P. O., J. A. Benediktsson, and J. R. Sveinsson. 2004. “Random Forest Classification of Multisource Remote Sensing and Geographic Data.” IEEE International Geoscience & Remote Sensing Symposium 1049–1052.
- Gong, P., Z. Niu, X. Cheng, K. Zhao, D. Zhou, J. Guo, Lu Liang, et al. 2010. “China’s Wetland Change (1990–2000) Determined by Remote Sensing.” Science China Earth Sciences 53 (7): 1036–1042. https://doi.org/10.1007/s11430-010-4002-3.
- Guha, S., H. Govil, N. Gill, and A. Dey. 2020. “A Long-Term Seasonal Analysis on the Relationship Between LST and NDBI Using Landsat Data.” Quaternary International 575: 249–258. http://doi.org/10.1016/j.quaint.2020.06.041.
- Güneralp, B., and K. C. Seto. 2013. “Futures of Global Urban Expansion: Uncertainties and Implications for Biodiversity Conservation.” Environmental Research Letters 8 (1): 0014025. https://doi.org/10.1088/1748-9326/8/1/014025.
- Gupta, K., P. Kumar, S. K. Pathan, and K. P. Sharma. 2012. “Urban Neighborhood Green Index – A Measure of Green Spaces in Urban Areas.” Landscape and Urban Planning 105 (3): 325–335. http://doi.org/10.1016/j.landurbplan.2012.01.003.
- Guy, E., W. Roger, V. Maarten, and H. Bernhard. 2002. Sustainable Developments of Islands: A Policy Support Framework for the Integrated Assessment of Socio-economic and Environmental Development: Sustainable Development for Island Societies: Taiwan and the World.
- Harmáčková, Z. V., and D. Vačkář. 2015. “Modelling Regulating Ecosystem Services Trade-Offs Across Landscape Scenarios in Třeboňsko Wetlands Biosphere Reserve, Czech Republic.” Ecological Modelling 295: 207–215. https://doi.org/10.1016/j.ecolmodel.2014.10.003.
- He, J., X. Shi, Y. Fu, and Y. Yuan. 2020. “Evaluation and Simulation of the Impact of Land use Change on Ecosystem Services Trade-Offs in Ecological Restoration Areas, China.” Land Use Policy 99: 105020. https://doi.org/10.1016/j.landusepol.2020.105020.
- Hu, S., L. Chen, L. Li, T. Zhang, L. Yuan, L. Cheng, J. Wang, M. Wen, et al. 2020. “Simulation of Land Use Change and Ecosystem Service Value Dynamics Under Ecological Constraints in Anhui Province, China.” International Journal of Environmental Research and Public Health 17: 4228. https://doi.org/10.3390/ijerph17124228.
- Hu, S., Z. Niu, Y. Chen, L. Li, and H. Zhang. 2017. “Global Wetlands: Potential Distribution, Wetland Loss, and Status.” Science of The Total Environment 586: 319–327. https://doi.org/10.1016/j.scitotenv.2017.02.001.
- Hu, X., and H. Xu. 2018. “A new Remote Sensing Index for Assessing the Spatial Heterogeneity in Urban Ecological Quality: A Case from Fuzhou City, China.” Ecological Indicators 89: 11–21. https://doi.org/10.1016/j.ecolind.2018.02.006.
- Hubacek, K., D. Guan, J. Barrett, and T. Wiedmann. 2009. “Environmental Implications of Urbanization and Lifestyle Change in China: Ecological and Water Footprints.” Journal of Cleaner Production 17 (14): 1241–1248. https://doi.org/10.1016/j.jclepro.2009.03.011.
- Jiang, T., B. Su, Y. Wang, et al. 2022. “Shared Socioeconomic Pathways (SSPs) Demographic and Economic Gridded Dataset.” Advances in Climate Change Research 18: 381–383. http://doi.org/10.12006/j.issn.1673-1719.2022.106.
- Jiu, J. 2021. Study on the Implication of Land Use Change on Ecosystem Services in Hubei Province. Wuhan: Huazhong University of Science and Technology.
- Kim, Y., G. Newman, and B. Güneralp. 2020. “A Review of Driving Factors, Scenarios, and Topics in Urban Land Change Models.” Land 9: 246. https://doi.org/10.3390/land9080246.
- Li, H. 2011. “Status of Nature Reserve Construction and Ecological Protection in Yangtze River Basin.” Yangtze River Basin Resources and Environment 20: 150–155. CNKI:SUN:CJLY.0.2011-02-005.
- Li, X., R. Bellerby, C. Craft, and S. E. Widney. 2018. “Coastal Wetland Loss, Consequences, and Challenges for Restoration.” Anthropocene Coasts 1: 1–15. https://doi.org/10.1139/anc-2017-0001.
- Li, Z., W. Jiang, W. Wang, Z. Chen, Z. Ling, and J. Lv. 2020. “Ecological Risk Assessment of the Wetlands in Beijing-Tianjin-Hebei Urban Agglomeration.” Ecological Indicators 117: 106677. https://doi.org/10.1016/j.ecolind.2020.106677.
- Li, L., ZH Shi, W. Yin, D. Zhu, Ng Sai Leung, CF Cai, and AL Lei. 2009. “A fuzzy analytic hierarchy process (FAHP) approach to eco-environmental vulnerability assessment for the danjiangkou reservoir area, China.” Ecological Modelling 220: 3439–3447. http://doi.org/10.1016/j.ecolmodel.2009.09.005.
- Li, C., Y. Wu, B. Gao, K. Zheng, Y. Wu, and C. Li. 2021. “Multi-scenario Simulation of Ecosystem Service Value for Optimization of Land use in the Sichuan-Yunnan Ecological Barrier, China.” Ecological Indicators 132: 108328. https://doi.org/10.1016/j.ecolind.2021.108328.
- Liang, X., Q. Guan, K. C. Clarke, S. Liu, B. Wang, and Y. Yao. 2021. “Understanding the Drivers of Sustainable Land Expansion Using a Patch-Generating Land use Simulation (PLUS) Model: A Case Study in Wuhan, China.” Computers, Environment and Urban Systems 85: 101569. https://doi.org/10.1016/j.compenvurbsys.2020.101569.
- Liao, W., X. Liu, D. Li, M. Luo, D. Wang, S. Wang, et al. 2018. “Stronger Contributions of Urbanization to Heat Wave Trends in wet Climates.” Geophysical Research Letters 45 (11): 310–311. 317.
- Liu, L., X. Chen, W. Chen, and X. Ye. 2020a. “Identifying the Impact of Landscape Pattern on Ecosystem Services in the Middle Reaches of the Yangtze River Urban Agglomerations, China.” International Journal of Environmental Research and Public Health 17: 5063. https://doi.org/10.3390/ijerph17145063.
- Liu, D., N. Chen, X. Zhang, C. Wang, and W. Du. 2020b. “Annual Large-Scale Urban Land Mapping Based on Landsat Time Series in Google Earth Engine and OpenStreetMap Data: A Case Study in the Middle Yangtze River Basin.” ISPRS Journal of Photogrammetry and Remote Sensing 159: 337–351. https://doi.org/10.1016/j.isprsjprs.2019.11.021.
- Liu, Z., P. H. Verburg, J. Wu, and C. He. 2017. “Understanding Land System Change Through Scenario-Based Simulations: A Case Study from the Drylands in Northern China.” Environmental Management 59 (3): 440–454. https://doi.org/10.1007/s00267-016-0802-3.
- Lu , J., H. Cai, X. Zhang, and Y. Fu. 2021. “Water quality in relation to land use in the Junshan Lake watershed and water quality predictions.” Water Science & Technology Water Supply 21 (2). https://doi.org/10.2166/ws.2021.123.
- Luck, G. W., T. H. Ricketts, G. C. Daily, and M. Imhoff. 2004. “Alleviating Spatial Conflict Between People and Biodiversity.” Proceedings of the National Academy of Sciences 101 (1): 182–186. https://doi.org/10.1073/pnas.2237148100.
- Mind’je, R., M. Mindje, and P. M. Kayumba. 2021. “The Influence of Anthropogenic Activities on Wetland Integrity Dynamics: A Case Study of the Rwampara Wetland in Rwanda.” Environmental Sustainability 4 (4): 833–849. https://doi.org/10.1007/s42398-021-00209-2.
- Moomaw, W. R., G. L. Chmura, G. T. Davies, C. M. Finlayson, B. A. Middleton, S. M. Natali, J. E. Perry, N. Roulet, A. E. Sutton-Grier, et al. 2018. “Wetlands In a Changing Climate: Science, Policy and Management.” Wetlands 38 (2): 183–205. https://doi.org/10.1007/s13157-018-1023-8.
- Nelson, E., G. Mendoza, J. Regetz, S. Polasky, H. Tallis, D. Cameron, K. M. Chan, et al. 2009. “Modeling Multiple Ecosystem Services, Biodiversity Conservation, Commodity Production, and Tradeoffs at Landscape Scales.” Frontiers in Ecology and the Environment 7 (1): 4–11. https://doi.org/10.1890/080023.
- Ochoa-Gaona, S., C. Kampichler, B. H. J. de Jong, S. Hernandez, V. Geissen, and E. Huerta. 2010. “A Multi-Criterion Index for the Evaluation of Local Tropical Forest Conditions in Mexico.” Forest Ecology And Management 260 (5): 618–627. https://doi.org/10.1016/j.foreco.2010.05.018.
- Peng, K., W. Jiang, Y. Deng, Y. Liu, Z. Wu, and Z. Chen. 2020. “Simulating Wetland Changes Under Different Scenarios Based on Integrating the Random Forest and CLUE-S Models: A Case Study of Wuhan Urban Agglomeration.” Ecological Indicators 117: 106671. https://doi.org/10.1016/j.ecolind.2020.106671.
- Pijanowski, B. C., D. G. Brown, B. A. Shellito, and G. A. Manik. 2002. “Using Neural Networks and GIS to Forecast Land use Changes: A Land Transformation Model.” Computers, Environment and Urban Systems 26 (6): 553–575. https://doi.org/10.1016/S0198-9715(01)00015-1.
- Quesnelle, P. E., L. Fahrig, and K. E. Lindsay. 2013. “Effects of Habitat Loss, Habitat Configuration and Matrix Composition on Declining Wetland Species.” Biological Conservation 160: 200–208. https://doi.org/10.1016/j.biocon.2013.01.020.
- Rashid, I., and S. Aneaus. 2020. “Landscape Transformation of an Urban Wetland in Kashmir Himalaya, India Using High-Resolution Remote Sensing Data, Geospatial Modeling, and Ground Observations Over the Last 5 Decades (1965–2018).” Environmental Monitoring and Assessment 192 (10): 635. https://doi.org/10.1007/s10661-020-08597-4.
- Rehmani, M. I. A., C. Ding, G. Li, S. T. Ata-Ul-Karim, A. Hadifa, M. A. Bashir, M. Hashem, S. Alamri, F. Al-Zubair, Y. Ding, et al. 2021. “Vulnerability of Rice Production to Temperature Extremes During Rice Reproductive Stage in Yangtze River Valley, China.” Journal of King Saud University - Science 33 (8): 101599. https://doi.org/10.1016/j.jksus.2021.101599.
- Shao, Z. F., L. Ding, D. R. Li, O. Altan, M. E. Huq, and C. M. Li. 2020. “Exploring the Relationship Between Urbanization and Ecological Environment Using Remote Sensing Images and Statistical Data: A Case Study in the Yangtze River Delta, People’s Republic of China.” Sustainability 12. http://doi.org/10.3390/su12145620.
- Shetty, S. 2019. Analysis of Machine Learning Classifiers for LULC Classification on Google Earth Engine. Enschede: University of Twente.
- Shi, L. N., X. D. Zhao, and F. Han. 2010. “Application and Development Prospect of Remote Sensing Technology in Environment Monitoring.” Guizhou Agricultural Sciences 38 (01): 175–178.
- Sileshi, A., A. Awoke, A. Beyene, I. Stiers, and L. Triest. 2020. “Water Purifying Capacity of Natural Riverine Wetlands in Relation to Their Ecological Quality.” Frontiers in Environmental Science 8), https://doi.org/10.3389/fenvs.2020.00039.
- Simioni, J., L. A. Guasselli, and C. B. Etchelar. 2017. “Connectivity among Wetlands of EPA of Banhado Grande, RS.” Rbrh 22 (0), https://doi.org/10.1590/2318-0331.011716096.
- Soltanian FK., Abbasi M., Bakhtyari H. 2019. Flood Monitoring Using NDWI AND MNDWI Spectral Indices: A Case Study of AGHQALA Flood-2019, Golestan Province: Elsevier. http://doi.org/10.5194/ISPRS-ARCHIVES-XLII-4-W18-605-2019.
- Sullivan, C. A., M. S. Skeffington, M. J. Gormally, and J. A. Finn. 2010. “The Ecological Status of Grasslands on Lowland Farmlands in Western Ireland and Implications for Grassland Classification and Nature Value Assessment.” Biological Conservation 143 (6): 1529–1539. https://doi.org/10.1016/j.biocon.2010.03.035.
- Sun, Y., Q. Cheng, Y. Li, and J. Fu. 2014. “Evaluation of Sustainable Development of Ecosystem in Liaoning Province Based on Energy Value Analysis.” Journal of Applied Ecology 25: 188–194. http://doi.org/10.13287/j.1001-9332.2014.01.026.
- Sun, Z., W. Sun, C. Tong, C. Zeng, X. Yu, X. Mou, et al. 2015. “China's Coastal Wetlands: Conservation History, Implementation Efforts, Existing Issues and Strategies for Future Improvement.” Environment International 79: 25–41. https://doi.org/10.1016/j.envint.2015.02.017.
- Tobler, W. 1979. Cellular geography [M]. Philosophy in geography, 379–386. Springer.
- Verheijen, B. H. F., D. M. Varner, and D. A. Haukos. 2018. “Effects of Large-Scale Wetland Loss on Network Connectivity of the Rainwater Basin, Nebraska.” Landscape Ecology 33 (11): 1939–1951. https://doi.org/10.1007/s10980-018-0721-1.
- Verhoeven, J. T. A., B. Arheimer, C. Yin, and M. M. Hefting. 2006. “Regional and Global Concerns Over Wetlands and Water Quality.” Trends in Ecology & Evolution 21 (2): 96–103. https://doi.org/10.1016/j.tree.2005.11.015.
- Wang, Y., X. Gu, G. Yang, J. Yao, and N. Liao. 2021. “Impacts of Climate Change and Human Activities on Water Resources in the Ebinur Lake Basin, Northwest China.” Journal of Arid Land 13 (6): 581–598. https://doi.org/10.1007/s40333-021-0067-4.
- Wang, S.-X., Y. Yao, and Y. Zhou. 2014. “Analysis of Ecological Quality of the Environment and Influencing Factors in China During 2005–2010.” International Journal of Environmental Research and Public Health 11: 1673–1693. https://doi.org/10.3390/ijerph110201673.
- Willis, K. S. 2015. “Remote Sensing Change Detection for Ecological Monitoring in United States Protected Areas.” Biological Conservation 182: 233–242. https://doi.org/10.1016/j.biocon.2014.12.006.
- Wohlfart, C., C. Kuenzer, C. Chen, and G. Liu. 2016. “Social–Ecological Challenges in the Yellow River Basin (China): A Review.” Environmental Earth Sciences 75 (13): 1066. https://doi.org/10.1007/s12665-016-5864-2.
- Xia, Y., C. Fang, H. Lin, H. Li, and B. Wu. 2021. “Spatiotemporal Evolution of Wetland Eco-Hydrological Connectivity in the Poyang Lake Area Based on Long Time-Series Remote Sensing Images.” Remote Sensing 13: 4812. https://doi.org/10.3390/rs13234812.
- Xiao, X., C. H. Liu, H. M. Tsai, and A. P. Program. 2002. Sustainable Development for Island Societies: Taiwan and the World: Sustainable Development for Island Societies: Taiwan and the World.
- Xu, H. 2006. “Modification of Normalised Difference Water Index (NDWI) to Enhance Open Water Features in Remotely Sensed Imagery.” International Journal of Remote Sensing 27 (14): 3025–3033. https://doi.org/10.1080/01431160600589179.
- Xu, L., Y. Xie, and X. Wang. 2022. “Ecological and Environmental Problems and Research Prospect of Flood Wetlands of Yangtze River-Connected Lake in the Middle Reaches of Yangze River China.” Science Foundation 36: 406–411. http://doi.org/10.16262/j.cnki.1000-8217.2022.03.008.
- Yang, B., X. Chen, Z. Wang, W. Li, C. Zhang, and X. Yao. 2020. “Analyzing Land use Structure Efficiency with Carbon Emissions: A Case Study in the Middle Reaches of the Yangtze River, China.” Journal of Cleaner Production 274: 123076. https://doi.org/10.1016/j.jclepro.2020.123076.
- Yin, H., G. Liu, J. Pi, G. Chen, and C. Li. 2007. “On the River–Lake Relationship of the Middle Yangtze Reaches.” Geomorphology 85 (3-4): 197–207. https://doi.org/10.1016/j.geomorph.2006.03.017.
- Zhai, H., C. Lv, W. Liu, C. Yang, D. Fan, Z. Wang, et al. 2021a. “Understanding Spatio-Temporal Patterns of Land Use/Land Cover Change Under Urbanization in Wuhan, China, 2000–2019.” Remote Sensing 13: 3331. http://doi.org/10.3390/rs13163331.
- Zhai, T., J. Wang, Y. Fang, J. Liu, L. Huang, K. Chen, C. Zhao, et al. 2021b. “Identification and Prediction of Wetland Ecological Risk in Key Cities of the Yangtze River Economic Belt: From the Perspective of Land Development.” Sustainability 13: 411. https://doi.org/10.3390/su13010411.
- Zhang, M., and X. Wu. 2018. “Changes in Hydrological Connectivity and Spatial Morphology of Baiyangdian Wetland Over the Last 20 Years.” Acta Ecologica Sinica 38: 4205–4213.
- Zhang, S., P. Yang, J. Xia, W. Wang, W. Cai, N. Chen, S. Hu, X. Luo, J. Li, C. Zhan, et al. 2022a. “Land use/Land Cover Prediction and Analysis of the Middle Reaches of the Yangtze River Under Different Scenarios.” Science of The Total Environment 833: 155238. https://doi.org/10.1016/j.scitotenv.2022.155238.
- Zhang, J., J. Zhao, Q. wang, and Z. Zhai. 2022b. “Discussion About the Scientific Foundations of the Yangtze River Protection law.” People’s Republic of China Water Resources, 38–41.
- Zhao, G., B. Pang, Z. Xu, J. Yue, and T. Tu. 2018. “Mapping Flood Susceptibility in Mountainous Areas on a National Scale in China.” Science of The Total Environment 615: 1133–1142. https://doi.org/10.1016/j.scitotenv.2017.10.037.
- Zheng, H., Y. Li, B. E. Robinson, G. Liu, D. Ma, F. Wang, F. Lu, Z. Ouyang, G. C. Daily, et al. 2016. “Using Ecosystem Service Trade-Offs to Inform Water Conservation Policies and Management Practices.” Frontiers in Ecology and the Environment 14 (10): 527–532. https://doi.org/10.1002/fee.1432.
- Zheng, Y., H. Zhang, Z. Niu, and P. Gong. 2012. “Protection Efficacy of National Wetland Reserves in China.” Chinese Science Bulletin 57 (10): 1116–1134. https://doi.org/10.1007/s11434-011-4942-9.
- Zhu, Z., and C. E. Woodcock. 2014. “Continuous Change Detection and Classification of Land Cover Using all Available Landsat Data.” Remote Sensing of Environment 144: 152–171. https://doi.org/10.1016/j.rse.2014.01.011.