
 ?Mathematical formulae have been encoded as MathML and are displayed in this HTML version using MathJax in order to improve their display. Uncheck the box to turn MathJax off. This feature requires Javascript. Click on a formula to zoom.
ABSTRACT
Floods remain one of the most devastating weather-induced disasters worldwide, resulting in numerous fatalities each year and severely impacting socio-economic development and the environment. Therefore, the ability to predict flood-prone areas in advance is crucial for effective risk management. The objective of this research is to assess and compare three convolutional neural networks, U-Net, WU-Net, and U-Net++, for spatial prediction of pluvial flood with a case study at a tropical area in the north of Vietnam. They are relative new convolution algorithms developed based on U-shaped architectures. For this task, a geospatial database with 796 historical flood locations and 12 flood indicators was prepared. For training the models, the binary cross-entropy was employed as the loss function, while the Adaptive moment estimation (ADAM) algorithm was used for the optimization of the model parameters, whereas, F1-score and classification accuracy (Acc) were used to assess the performance of the models. The results unequivocally highlight the high performance of the three models, achieving an impressive accuracy rate of 96.01%. The flood susceptibility maps derived from this research possess considerable utility for local authorities, providing valuable insights and information to enhance decision-making processes and facilitate the implementation of effective risk management strategies.
1. Introduction
Floods remain a pressing global concern due to their occurrence in diverse regions worldwide. A report by the United Nations in 2015 pointed out that the estimated average global losses reached 104 billion USD per year (Desai et al. Citation2015) and these losses continue to increase (Paprotny et al. Citation2018; Winsemius et al. Citation2015). Thus, floods present a great risk among the natural hazards to our society both at the economic level (Bui et al. Citation2020), affecting crops or infrastructures, and at the health level, with the potential to cause epidemics or even deaths (Nkwunonwo, Whitworth, and Baily Citation2020). The projected outlook indicates an exacerbation of flood problems in the future due to the adverse effects of global warming and climate changes, which result in extreme rainfall events worldwide (Barnes et al. Citation2018; Konapala et al. Citation2020; Papalexiou and Montanari Citation2019; Schiermeier Citation2011; Troncoso et al. Citation2018; Xie et al. Citation2010). According to Rentschler, Salhab, and Jafino (Citation2022), an estimated 1.81 billion people are directly exposed to 1-in-100-year floods, i.e. approximately 23% of the world population. In addition, it is anticipated that around 68% of the population is expected to live in urban areas by 2050 (O'Donnell and Thorne Citation2020). Therefore, investing in research and innovation to advance flood prediction techniques and develop robust flood management strategies is of paramount importance.
Literature review shows that flood modeling and prediction is becoming a well-studied topic. In 2013, a strategic approach for the flood study was published by Sayers et al. (Citation2013) where UNESCO and the World Wide Fund for Nature (WWF), among others, collaborated. Extensive reviews of models and methods for flood predictions can be seen in Mudashiru et al. (Citation2021), Santiago-Collazo, Bilskie, and Hagen (Citation2019) and Zounemat-Kermani et al. (Citation2021). Essentially, flood prediction models can be categorized into three main groups: statistical analysis (McCuen Citation2016), rainfall-runoff models (Bennett et al. Citation2016), and ‘on-off’ classification models (Bui et al. Citation2016). The first group relies on conducting regression analysis of time series data at gauged stations. In contrast, the second group employs mathematical equations to simulate the spreading of floods and extrapolate their impact to surrounding areas. Both of these groups possess the capability to yield accurate predictions with high levels of accuracy. However, long time series data at gauged stations with return periods are required for the reliability of the flood prediction (Read and Vogel Citation2015). The last group represents a relatively novel approach to flood modeling that does not rely on measured data from gauged stations. Consequently, this approach does not incorporate the concept of return periods, which is a requirement in traditional modeling approaches. The concept of ‘on-off’ or binary classification was employed. Here, ‘on’ signifies flood locations that have occurred in the past or present, while ‘off’ refers to non-flood locations within the region under consideration (Tien Bui and Hoang Citation2017). This has proven a powerful approach, allowing the incorporation of a large number geo-environment data (Nguyen et al. Citation2020). For example, the flash-flood event in October 2018 in Mallorca, Spain was studied through an integrated approach with rainfall radar images, meteorological, hydrological, geomorphological, damage and risk data analysis of the area (Estrany et al. Citation2019). In Martins et al. (Citation2023), a Brazilian flash-flood event was analyzed with images and news of the event and social perception through surveys of residents of the area.
In this context, machine learning has to be key tools to help characterize flood susceptibility areas with promising results, i.e. support vector machines (Youssef et al. Citation2022), random forest (Hasanuzzaman et al. Citation2022), decision trees (Abedi et al. Citation2022), neural networks (Cui et al. Citation2023), ensemble machine learning (Fang et al. Citation2022). In recent years, deep learning has emerged as a potent technique for flood susceptibility mapping, offering significant potential to enhance our comprehension and management of flood-prone regions. As the capabilities of flood prediction continue to advance through deep learning (Bui et al. Citation2020; Li and Hong Citation2023; Youssef et al. Citation2022), its application holds immense promise in enabling more precise assessments and facilitating the development of effective strategies to mitigate flood risks. However, despite the abundance of deep learning algorithms, their exploration in the context of flood susceptibility studies remains limited. Therefore, further research is necessary to draw reasonable conclusions and unlock the full potential of deep learning in this domain. This research aims to partly fill this gap in the literature by evaluating and comparing the potential application of U-Net, WU-Net, and U-Net++ for fluvial flood susceptibility in tropical area.
The rest of the article is structured as follows: First, Section 2 introduces the previous studies of the deep learning methodologies in flood prediction problems. Then, Section 3 describes the study area. Afterwards, the developed flood prediction methodologies and the presentation and discussion of the obtained results are presented in Section 4 and in Section 5, respectively. Finally, Section 6 summarizes the conclusions obtained in this research.
2. Related works
In recent decades, artificial intelligence techniques have become an essential tool for managing natural disasters (Martínez-Álvarez and Morales-Esteban Citation2019). In this type of phenomenon, it is crucial to understand not only the phenomenon itself but also its relationship with exogenous factors. In Taromideh et al. (Citation2022), traditional machine learning algorithms such as classification and regression trees, random forest, or support vector machines, among others, were implemented to create an urban flood-risk map of a city in Iran. The vulnerability and hazard of the areas were analyzed and significant parameters were discovered for each of them, such as population density or distance to rivers, respectively. In Hosseini et al. (Citation2021) a decision-making trial and evaluation laboratory (DEMATED), an analytical network process (ANP) and fuzzy methods were conducted to address the flood vulnerability of watershed in a severely flooded area of Iran. The authors found that the two most important variables in the model were the land use and the distance to the stream.
Several spatial models of flood events are being analyzed to obtain accurate flood maps. In Rahman et al. (Citation2021) authors created multi-type flood maps, i.e. fluvial, flash, pluvial and surge floods, in Bangladesh using machine learning algorithms, for instance, the LWLR or locally weighted linear regression model. They included flood data, remote sensing images, topography, hydrogeology and environmental datasets. The same information was utilized by Baig et al. (Citation2022) to create a flood probability map of the area of the Koshi River basin in the Himalayas. Traditional machine learning algorithms with multiple kernel functions were developed.
Along with traditional machine learning methods, deep learning techniques are also an interesting approach to modeling flood problems. A state-of-the-art review of the application of deep learning models to flood mapping was published in 2022 (Bentivoglio et al. Citation2022). Convolutional neural networks (CNN) were identified as the leading and most accurate deep learning models considering all the reviewed research articles. CNN were trained in Ullah et al. (Citation2022) to produce multi-hazard susceptibility maps, i.e. prediction of the probability of flash-floods, debris flows and landslides. The proposed CNN model performed better than several traditional machine learning algorithms with which it was compared. In Kabir et al. (Citation2020), a CNN method for real-time fluvial flood forecast was presented demonstrating, once again, its superiority over other traditional machine learning methods.
Convolutional neural networks are composed of different layers that can be adapted depending on the objective of the problem. In Minaee et al. (Citation2022), authors stated that CNN are often involved in image segmentation tasks. They conducted a literature review in this field and defined semantic segmentation as a classification problem of pixels with semantic labels. In this survey, authors mentioned the encoder-decoder technique as a class of image segmentation models. Some of the best known encoder-decoder models follow the u-shaped architecture, i.e. a contraction path for capturing context and a symmetric expansion path for localization.
All the convolutional neural networks used in our study to predict areas sensitive to pluvial flood follow u-shaped architectures. In particular, the three algorithms implemented in our research are: U-Net, WU-Net and U-Net++. They are defined in detail in Section 4.2. These three algorithms were originally used in biomedical applications. A survey of the different usages of the u-shaped networks in medical images segmentation was presented in Liu et al. (Citation2020). The following paragraphs review current applications of these three algorithms in other fields.
U-Net was firstly proposed in 2015 with the goal of obtaining a better segmentation of biomedical images (Ronneberger, Fischer, and Brox Citation2015). However, this algorithm and its applications in different areas have evolved. For example, in Flood, Watson, and Collett (Citation2019) U-Net was used to map the presence or absence of trees and shrubs in Australia. In Zhuang, Zhang, and Wang (Citation2020) it was used to segment small-scale residential solar panels. Regarding flooding, U-Net along with PSPNet and DeepLapV3 (two other encoder-decoder techniques), were developed by Andrew et al. (Citation2023) for automatic flood mapping image segmentation. The U-Net algorithm behaved more accurately, in terms of accuracy and f1-score compared to the other two deep learning algorithms. In Li and Demir (Citation2023) U-Net was modified to capture water bodies at the 2019 Central US flooding. Their modification of the U-Net outperformed the traditional benchmark models. In Zhao et al. (Citation2022) near-real-time urban flood mapping was accomplished using an urban-aware U-Net model.
At present, U-Net is being used as a base model to develop improved and more specific algorithms. WU-Net is one of these new versions of the traditional U-Net. WU-Net was introduced by Muralikrishnan, Kim, and Chaudhuri (Citation2018). Since its implementation, WU-Net was mostly used in the biomedical area. An application of the WU-Net to hyperspectral imagery simulated from the HyMap data over Munich, Germany, was conducted in Hong et al. (Citation2019). To the best of our knowledge, there is no specific article in the literature in which a WU-Net model was applied to analyze a natural flood catastrophe.
The last deep learning algorithm implemented in our research work is U-Net++ which is a very recent algorithm (Zhou et al. Citation2020) based, as well, on U-Net. As the previous mentioned models, U-Net++ is mainly used in detection and segmentation of biomedical images. In Yang et al. (Citation2020), authors focused on a new application of this algorithm, in particular, in the detection of seismic fault using a 3D U-Net++ model. In Helleis et al. (Citation2022) five different CNN architectures, including U-Net and U-Net++, were applied to Sentinel-1 data to map water and floods. Authors reported that all CNN algorithms performed similarly on the flooding dataset and that attention needed to be paid in arid or mountainous environments. They ended the article by enhancing the need for further optimization of the CNN architectures. In Khan and Basalamah (Citation2023) flood segmentation using aerial images from the 2017 hurricane landfall in Texas and Louisiana was carried out with several deep learning algorithms. Two of them were U-Net and U-Net++. U-Net++ outperformed U-Net by redesigning the skip-connection, i.e. feature maps of the encoder part of the U-Net++ were pre-enriched.
3. Study area and flood data
This Section presents the area of Vietnam subject of this research. More specifically, Section 3.1 details the spatial and environmental characteristics of the area. The specific flash-flood data used in this study is described in Section 3.2, focusing in Section 3.2.1 on the flood inventory maps and in Section 3.2.2 on the indicators considered.
3.1. Description of the study area
The study area is the Phu Tho province, locating in the northwest region of Vietnam, approximately 70 km from Hanoi City (). The province lies between latitudes of 2055'0” N and 21
43'0” N and between longitudes of 104
48'0” E and 105
27'0” E with an area and a population of 3534.6 km
and 1,463,726, respectively.
Figure 1. Location of the Phu Tho province and flooded locations.
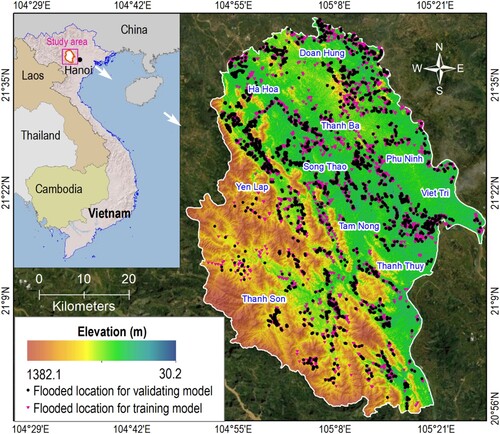
In term of morphometry, Phu Tho has a very complex terrain, consisting of mountains and hills in the West and South regions, valleys, and plains in the North and East regions with a wide variety of elevation ranging from 30.2 to 1382.1 m.a.m.sl. It was noted that a significant percentage (51.6%) of high slope area () may increase the possibility of the flash-flood occurrences in this study area. The hydrological system in the study area consists of a dense river and stream networks, which connect directly three main rivers including the Thao river, the Da river, and the Lo river.
Climatically, Phu Tho is located in the tropical monsoon climate region characterized by less rainfall and dry air in the northeast monsoon season (from April to October) and heavy rainfall and hot in the Southeast monsoon season (from November to March). Historical rainfall monitoring showed that yearly maximum and minimum rainfall amount in this area were approximately 3057.2 mm in 1980 and 1192.5 mm in 1977, respectively. The study area has an average temperature, humidity, and rainfall of 23, 85% and 700 mm per year, respectively. More noticeably, the complexity of the terrain and recent rapid land cover transformation, coupled with heavy rainfall in a short time in high slopes areas, may cause a high possibility of flash-flood occurrences in the study area.
3.2. Flash-flood data
3.2.1. Flood inventory map
Making a flash-flood inventory map is the first and essential step for mapping susceptibility (Costache et al. Citation2020; Hosseini et al. Citation2020; Razavi Termeh et al. Citation2018). A flash-flood inventory map presents a correlation between influencing factors and previous flash-flood events (Nguyen et al. Citation2020; Tien Bui et al. Citation2020). For this purpose, we collected more than 796 historical flash-flood locations that occurred between 2010 and 2019 from our field surveys, local authorities, newspaper, and literature. These data were randomly divided into two categories with 70% samples for training and 30% for testing models. The locations and distributions of the flash-flood events are shown in .
3.2.2. Flood indicators
The selection of influencing factors to flash-flood occurrences is an important stage to produce accurate and reliable flood susceptibility maps (Tehrany et al. Citation2018). The influencing factors were often selected based on the physical and statistical relationship between the previous flash-flood events and these factors. However, the occurrences of flash-flood events in a certain catchment are very complicated, therefore, we selected influencing factors based on the literature reviews, coupled with consideration of previous flash-flood characteristics and hydrometeorological and geological conditions in this study area (Hosseini et al. Citation2020; Nguyen et al. Citation2020; Tien Bui et al. Citation2020). Accordingly, a total of twelve influencing factors were selected including Land cover, NDVI, Land use, Lithology, Soil type, stream density, rainfall, Elevation. Aspect, Plan curvature, Profile curvature, and Slope.
Land use/Land cover (LULC): LULC plays an essential role in generating runoff processes and flash-flood occurrences in a certain catchment. In large areas, for instance, LULC may cause an increase or a decrease in soil moisture influencing the soil infiltration capacity (Pishvaei et al. Citation2020). Meanwhile, the modification of LULC in hillslopes can change runoff characteristics such as changing flow paths, velocity, flow connectivity and times of concentration within a watershed (Rogger et al. Citation2017). Therefore, LULC is always considered as an important factor in mapping flash-flood susceptibility (Costache and Tien Bui Citation2020; Hosseini et al. Citation2020; Yariyan et al. Citation2020). In the present study, LULC map is obtained from Sentinel-1 C band SAR data (Nguyen et al. Citation2020). In this study, there are eight land cover types, including water, urban and built-up, paddy rice, crops, grassland, orchard area, bare land, and forest ((a)) in which a significant percentage of low vegetable density areas such as urban and built-up, grassland, and crops may have a strong influence on the generation of flash-floods. Similarly, the study area consists of nine land cover types including built-up area, agricultural land, annual crop land, Pcland, Pdland, Ptland, water surface, NTRM, and unused hilly land ((c)). It was noted that significant land cover related to artificial activities such as intensive agricultural development and urbanization may have high potentiality of taking place flash-floods.
Figure 2. Flood indicators of the Phu Tho province. (a) Land cover; (b) NDVI; (c) Land use; (d) Lithology; (e) Soil type; (f) Stream density; (g) Rainfall; (h) Elevation; (i) Aspect; (j) Plan curvature; (k) Profile curvature and (l) Slope.
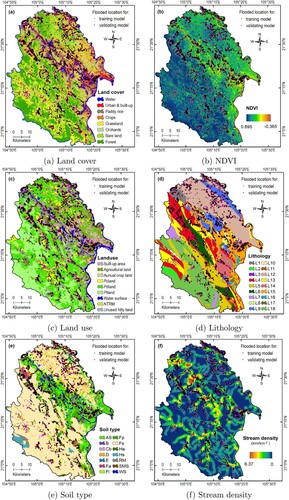
Normalized Difference Vegetation Index (NDVI): NDVI presents characteristics of vegetable coverage such as types of species, density, diversity and variation influencing on runoff flow processes (Kalisa et al. Citation2019). Many studies demonstrated the relationship between NDVI and flash-flood occurrences in which the higher NDVI areas showed a high probability of flash-flood occurrences compared to lower ones. Therefore, NDVI is often used as a crucial variable in predicting flash floods (Nguyen et al. Citation2020; Tien Bui et al. Citation2020). For the present study, Landsat-8 OLI imagery is used to prepare the NDVI map ((b)) (Tien Bui et al. Citation2020). The NDVI value is estimated using the Equation (Equation1(1)
(1) ):
(1)
(1) where NIR and RED indicate surface reflectance of the near-infrared band and the red band, respectively. The NDVI in the selected area is presented in (b). It varies widely from −0.365 to 0.895 indicating a large difference in vegetable coverages. High NDVI values are located in the western region which has high slopes while low NDVI values are in the transmission regions between mountains and plains along the Thao river.
Lithology: The lithological factor is an important variable in predicting flash-flood susceptibility because its characteristics effect on processes of filtration, runoff generation and flood occurrences. For example, each type of rock has different in grain size composition, moisture content, plasticity, porosity, and volume influencing capability of water holding, absorption capacity, infiltration, and storage capacity (Myslinska Citation1983). These hydraulic properties have a strong effect on increasing or decreasing the magnitude of water flow. For this study, the lithological map ((d)) is prepared from the Phu Tho Geological and Mineral Resources Map in a scale of 1:50,000 obtained from Vietnam Institute of Geosciences and Mineral Resource. Accordingly, there are eighteen lithological types in this study area, in which six lithologies including L2, L4, L5, L12, L13, and L18 covered more than 82.7% of total area. It can be tracked that high density of previous flash-flood events are recorded in L4 and L15 groups indicating a high probability of flash-flood occurrences.
Soil type: Physical characteristics of soil type influence the infiltration rates, and therefore, it often regulates runoff generation and flash-flood processes taking place in a watershed (Nguyen et al. Citation2020; Tien Bui et al. Citation2020). The impermeable and permeable soil types have the different capability of absorbing water, it can increase or reduce runoff flow and concentration times of flow from a certain catchment or watershed to outfall. For the present study, soil map is created using the soil texture map 1:50,000 scale from Vietnam Soil Map. A total of 14 soil types are identified in this study area, in which Fs, AS, and Fp account for approximately 89.6% of the total area ((e)).
Stream density (SD): Streams or drains are a conveyable route of water flow from hillslopes to valleys and plains. Stream density (SD) is a representative factor showing the magnitude flow concentration in a watershed. Previous studies also indicated that high density of streams can produce more prone to flash-flood occurrences (Nguyen et al. Citation2020; Tien Bui et al. Citation2020; Yariyan et al. Citation2020). Therefore, the SD is often considered as a crucial influencing factor for mapping flash-flood susceptibility (Glenn et al. Citation2012). Stream density in this study area is prepared from a digital elevation model (DEM) with a scale of and Vietnamese river network system database. As shown in the (f), relatively high stream density (
km/km
) located in small valleys along the streams and rivers while more frequent historical flash-flood records are found in the high elevation areas. This fact indicates that the occurrences of flash-flood events in this study area depend not only on the SD but also on other influencing factors.
Rainfall: Rainfall is characterized by intensity, duration and frequency which have a strong influence on the runoff generation and flash-flood occurrences within a certain watershed. Although each rainfall event may have different impacts on flash-flood magnitude, flash-flood often takes place immediately after heavy rainfall within a short time in the steep slopes areas (Nguyen et al. Citation2020; Tien Bui et al. Citation2020). Hence, rainfall is an essential influencing factor in flood prediction. For this study, we obtained the maximum 10-day rainfall during the last 5 years at 50 stations in and around case study to generate the rainfall pattern map using Kriging Interpolation Method. Accordingly, the rainfall varied from 453.4 to 1162.5 mm ((g)), in which high rainfall intensity ( mm) is observed in the southwest and northeast region where many flash-flood records occurred previously.
Elevation: Elevation has a strong influence on local and regional climate system which controls the development of plants and vegetation (Moradi, Fattorini, and Oldeland Citation2020). Also, high elevation and wide derivatives produce more energy speeding up flow generation and its movement from higher elevation area to lowland areas (Tien Bui et al. Citation2020). The elevation map in this study area is created using a DEM with a grid size of . High elevation areas are mainly located in the southwest region of the study area with the maximum of 1382.1 m, whilst low elevation areas extend from the northwest to southeast regions with a minimum of −93.1 m ((h)).
Aspect: Aspect is an important influencing factor for making flood-flash susceptibility because it can impact on local climate, physiographic conditions, soil moisture content and vegetation growth in a watershed (Costache, Hong, and Wang Citation2019; Florinsky Citation2016b). As shown in (i), the study area was dominantly covered by N, NE, E, and SE aspect with more previous flash-flood occurrences.
Plan curvature: Plan curvature is defined as the perpendicular to the slope influencing the convergence and divergence of flow across the surface (Florinsky Citation2016a) which is a crucial factor in flash-flood prediction (Costache, Hong, and Wang Citation2019; Nguyen et al. Citation2020). The plan curvature is often classified into concavity (positive), convexity (negative), and flat (zero). In this study, the plan curvature map is created by intersecting the horizontal plane and the surface on the DEM model with a resolution of . As a result, approximately 85% of the total area in this province is covered by concave zones ((j)).
Profile curvature: Profile curvature is parallel to the direction of the maximum slope, indicating the downhill or uphill rate in the changes of gradient direction. Similar to plan curvature, the profile curvature has three classes including concavity (positive), convexity (negative), and flat (zero) (Florinsky Citation2016a). Profile curvature has a strong effect on accelerating or decelerating the flow across the surface within a certain watershed (Nguyen et al. Citation2020). Therefore, the combination of plan and profile curvature could help to understand the characteristics of flow across the surface in this study area. For this purpose, the profile curvature map is prepared based on the DEM map with a resolution of m. The profile curvature in this area shows a wide variation ranging from −11.03 to 11.29 with approximately 82.6% of the total area covered by concave zones ((k)). It was tracked that most of previous flash-flood records in this area are in plains which have very low values indicating the high potentiality of future flash-flood occurrences in these areas.
Slope: The slope is an extremely important flash-flood predictor because high slopes can speed up water flow velocity while low slopes may reduce the water flow to downstream (Costache and Tien Bui Citation2020; Nguyen et al. Citation2020). In this study area, the slope shows a large range varying from 0 to 68.6 degrees ((h)). High slope values are found in the mountainous areas from the southwest region, whilst low slope values are in small valleys and plains with a high density of historical flash-floods. This fact indicates that next flash-flood events may occur in low slope areas with high possibility compared to high slopes areas.
4. Proposed modeling approach based on convolutional networks for tropical cyclone-induced flood susceptible mapping
This Section presents the dataset, the three convolutional networks used in this research and the metrics used to evaluate the performance of the models and predicted results.
4.1. Flood database
The experimentation of this research is done with a dataset of 1412 input images and its corresponding 1412 target images. Every image chip is made up of pixels. As shows, every pixel of an input image has 12 flood indicators, i.e. input images are designed as raster with 12 bands. On the other hand, target images are binary raster where ‘1’ means flood and ‘0’ means non-flood. Therefore, in summary, one input image corresponds to
pixels and one target image to
pixels. During the training phase of the convolutional networks, the dataset is split into a training set with 692 images (approximately a 49% of the whole dataset) for training, a validation set with 296 images (approximately a 21% of the whole dataset) for tuning of parameters and a test set with 424 images (the remaining 30%) to evaluate the models.
Once a model is successfully trained and tested, it is ready to predict the whole study area image. The whole study area is represented with an image of pixels. This whole image is separated into image chips of
with an identification number. Considering that the dimensions of the image to predict are not divisible by 32, the empty pixels to complete the partial chips are filled with
, the value for the out of the boundary of the original image. When prediction is done, all predicted images chips of
are merged (considering the identification number) to get the prediction of the original full image. This is the final susceptibility map.
4.2. Convolutional networks for flood modeling
Since the late 1980s, convolutional neural networks, also known as CNN, have been used in many visual tasks. Traditionally, when a CNN is applied in classification problems, the complete output of an input image is a single class label (Rawat and Wang Citation2017). Nevertheless, some visual tasks need localization, i.e. assignation of a class label to each pixel. In this section, the three convolutional networks selected to predict flood in our study area are presented:
4.2.1. U-Net model
U-Net (Ronneberger, Fischer, and Brox Citation2015) uses as base architecture the fully convolutional network (Long, Shelhamer, and Darrell Citation2015) and applies some modifications with the objective of getting a fast and precise segmentation of images. The architecture of U-Net is divided into two paths: a contracting path and a symmetric expanding path, which are represented with a u-shaped architecture, hence its name. The total architecture has 23 convolutional layers: 22 in these phases and 1 in the last final layer to get the requested number of classes. During the first path, the context of the image is captured using a typical convolutional network, i.e. two convolutions followed by Rectifier Linear Unit (ReLU) activations and a max-pooling operator after which the number of feature channels is increased by two. Afterwards, the U-Net starts the expansion path to precise localization creating high-resolution segmentation maps. This second path is made up of up-convolutions, concatenations with the corresponding feature maps of the first path and, again, two convolutions followed by ReLU activations.
This architecture contains a special strategy, called overlap-tile strategy, to get the most accurate prediction of the pixels in the borders of the images. Other characteristics of this network are the possibility of using data augmentation and the separation of the touching objects of the same class. Both are interesting tasks in biomedical image segmentation as introduced in Ronneberger, Fischer, and Brox (Citation2015). The energy function used in the final output segmentation map with probabilities (near to ‘1’ for flood and to ‘0’ for non-flood) is a pixel-wise soft-max combined with the cross-entropy loss function (Ronneberger, Fischer, and Brox Citation2015).
4.2.2. WU-Net model
The architecture WU-Net (Muralikrishnan, Kim, and Chaudhuri Citation2018) is built upon the U-Net adding new characteristics to increase its possibilities. Basically, WU-Net is made up of three u-shaped structures of U-Net linked in sequence that creates a w-shaped architecture followed by an u-shaped. All u-shaped structures are also connected among them (respecting their order), i.e. the concatenation exists not only in the high-resolution paths (as in U-Net) but also in the low ones. This added symmetry lets data wind back and forth in two directions. In this way, the convolutional filters of the later layers have a high effective field of view and localization of segments is improved.
In addition, the weakly supervised model is trained in two phases to get more accurate results. The first training phase removes the final segmentation branches and adds a simple classifier layer. This first phase is trained with cross-entropy loss until accuracy is higher than 95%. The first training phase does not output any segmentation map in contrast with the second phase that trains the completely original network (with the segmentation branches and without the classification layer) and outputs a final segmentation map. This architecture is able to detect parts from weak shape-level tags and finds large consistent regions in shapes of differentiating parts.
4.2.3. U-Net++ model
U-Net++ appears as a new architecture to overcome two limitations of the fully convolutional networks, U-Net and variants of U-Net for image segmentation. These limitations are: the optimal depth of the network is not known and the design of the skip connections is restrictive. U-Net++ is an ensemble architecture made up of several U-Nets with different depths. This is an important improvement over the fixed-depth of U-Net that sometimes needs several trainings of the same model or an inefficient ensemble of models with different depths.
In addition, the decoders of U-Net++ are designed in such a way that the skip connections are densely joined allowing flexibility feature fusion in decoders, not like the restrictive connections of U-Net. U-Net++ includes as well a scheme to prune a trained model where only one segmentation branch is selected and so, its output. The level of pruning is studied in each specific case evaluating the performance of the model in the test set. The inference speed of U-Net++ is accelerated thanks to this pruning scheme. Besides the above-mentioned improvements of U-Net++, Zhou et al. (Citation2020) prove that the performance of the segmentations of U-Net++ is much higher. It also allows the possibility of aggregating image features in the network horizontally and vertically.
4.3. Prediction performance evaluation
The performance of the models is evaluated differently depending on its phase. During the tuning phase, where the optimal parameters are found, the training and validation phases are evaluated with the accuracy and the loss value. These metrics are used as well to evaluate the test data. However, the prediction of the whole study area cannot be assessed with accuracy and loss as the real probabilities (flood or not) of this image are not known. In this case, the predicted results are shown and discussed using susceptibility maps.
5. Results and discussion
This section presents the results obtained from the application of the selected three networks in the flood dataset. In particular, the selection of the parameters of each network and the training, validation and prediction results are discussed including their susceptibility maps.
5.1. Model performance and comparison
The experimentation of this research work is done in a GPU NVIDIA-SMI TITAN V with 12 Gb. The grid search strategy is used to tune the models and obtain the optimal network structure. The following parameters are tuned within these ranges (based on the literature review Torres et al. Citation2021): number of initial filters (from 8 to 64), learning rate (0.001, 0.003, 0.01, 0.03, 0.1 and 0.3), batch size (from 10 to 30), number of epochs (from 1 to 10) and dropout rate to relieve overfitting in the training phase (from 0.0 to 0.5). The Adam algorithm helps to optimize the parameters efficiently.
After the tuning process, the models with the highest accuracy are selected and so, the following are the selected parameters of each of them. The U-Net architecture with the most accurate performance in the validation set is a model trained with 16 initial filters, a learning rate of 0.01, a batch size of 30, 10 epochs and a dropout rate of 0.0. The WU-Net network selected has 16 initial filters, a learning rate of 0.01, a batch size of 30, 10 epochs and a dropout rate of 0.2. The selected U-Net++ architecture has 32 initial filters, a learning rate of 0.003, a batch size of 20, 7 epochs and a dropout rate of 0.2.
shows the accuracy and loss results for the selected parameters for each model in the tuning phase. shows the accuracy and loss results of the evaluation of the models with the above-mentioned selected parameters, when they are trained using the training+validation set, that represents the 70% of the data, and evaluated using the test set, that represents the remaining 30%. These results prove an accurate performance of the models considering that each model has to predict localized pixels.
Table 1. Accuracy and loss results for the selected parameters for each model.
Table 2. Accuracy and loss results obtained for each model in the evaluation phase.
5.2. Flash-flood susceptibility map
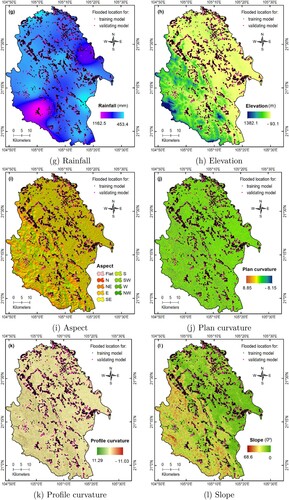
The selected models, specified in the above section, are used to predict the whole study area image. Firstly, as mentioned in Section 4.1, this image needs to be divided into image chips of as these are the dimensions of the training and validation images. The models predict the possibility of flood providing probability values of each specific pixel in the interval [0,1] where ‘1’ means flood and ‘0’ means non-flood. These localized probabilities are represented in susceptibility maps. The flood susceptibility map of the U-Net, WU-Net, U-Net++ models are shown in (a–c), respectively.
Figure 3. Flash-flood susceptibility map using deep learning methods. (a) U-Net model; (b) WU-Net model and (c) U-Net++ model.
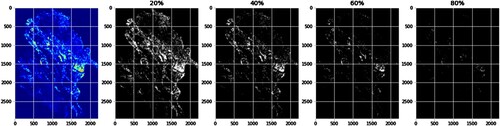
In addition, to easily visualize the flood probability predicted by each model we split the maps into four ranges (more than 20%, 40%, 60% and 80% of probability) taken from 0 to the maximum value of the probability in each case. The 80% figures represent the locations most susceptible to damage, i.e. locations where the highest predicted values (more than 80%) are reached. The 100% figure would correspond to the location where the maximum predicted value is reached. These susceptibility maps divided by probabilities are presented for U-Net in , for WU-Net in and for U-Net++ in . In the particular case of the U-Net network, some specific probability values are too high and so, they are not representative for the rest of the values predicted by the model. Due to this reason, the representation with 20% of probability to 80% is not very representative for U-Net, therefore, represents ranges from 5% to 20% to see similar behaviors.
Figure 4. Flood susceptibility map of U-Net divided in four ranges of probability (20%, 40%, 60% and 80%).
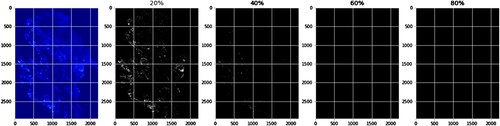
Figure 5. Flood susceptibility map of U-Net divided in four ranges of probability (5%, 10%, 15% and 20%).
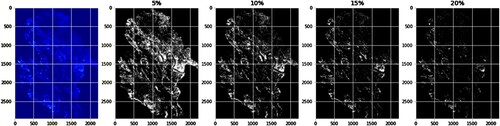
Figure 6. Flood susceptibility map of WU-Net divided in four ranges of probability (20%, 40%, 60% and 80%).
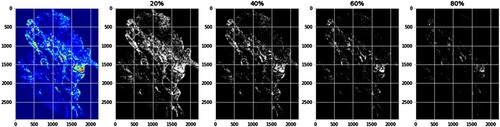
Figure 7. Flood susceptibility map of U-Net++ divided in four ranges of probability (20%, 40%, 60% and 80%).
Even if the real probabilities of the predicted models are not known, when comparing the results of the models, it is clear that the physical areas with higher probability of flood are very similar. These areas are the nearest to the water areas inside land (see (a,c)) and are close to the soil type Fp (see (e)).
These flood susceptibility maps are of great interest for evaluating areas prone to flood hazards. The division by probability ranges allows for the ranking and identification of the different areas susceptible to damage. Mitigation strategies and management plans in the Pho Tho province can be drawn up based on these susceptibility maps. Locations with similar characteristics could benefit from the u-shaped models already trained to create their own susceptibility map. Therefore, automatic flood map prediction could be implemented.
6. Concluding remarks
In this study, flood susceptibility prediction has been carried out for a particular province in northwest Vietnam. The province corresponds to Phu Tho, which has a very complex terrain in terms of mountains, hills, valleys, plains, variety of elevation and rapid transformation of land cover. In addition, in Phu Tho heavy rainfall in a short time usually occurs in high slopes areas. The objective of predicting which areas have a high possibility of flash-flood in this province can prevent it from management risks.
The experimentation has been performed with 1412 images correctly labeled with ‘1’ for flood and ‘0’ for non-flood. Each image has been associated with 12 flood indicators. These indicators are factors influencing flash-flood events according to the literature. They match the factors of previous flash-flood and the hydrometeorological and geological conditions of Phu Tho. Three prediction models have been used: U-Net, WU-Net and U-Net++. These models are deep learning algorithms based on semantic segmentation. To our knowledge, they have never been used before to predict areas sensitive to pluvial flood but they have demonstrated accurate performance in related study domains. The optimal parameters of each model have been found with a tuning process. Afterwards, models have been trained providing good loss and accuracy metrics with the test set. Finally, the prediction over the study area has been performed and each localized probability of flood has been represented in a susceptibility map. The three susceptibility maps from U-Net, WU-Net and U-Net++ models have shown very similar areas as having the highest probability of flood. Comparing with Phu Tho flood indicator maps, these areas are water zones within the land and close to the Fp soil type.
Future work will focus on two aspects of relevance at present. Firstly, explainable artificial intelligence (XAI) techniques will be used to understand more clearly the factors that most influence the different areas of the predicted susceptibility maps. Secondly, susceptibility maps will be created with multi-classes going beyond the binary classification (flooding or non-flood).
Data availability statement
The data that support the findings of this study are available from the corresponding author upon reasonable request.
Disclosure statement
No potential conflict of interest was reported by the author(s).
Additional information
Funding
References
- Abedi, Rahebeh, Romulus Costache, Hossein Shafizadeh-Moghadam, and Quoc Bao Pham. 2022. “Flash-Flood Susceptibility Mapping Based on XGBoost, Random Forest and Boosted Regression Trees.” Geocarto International 37 (19): 5479–5496. https://doi.org/10.1080/10106049.2021.1920636.
- Andrew, Ogbaje, Armando Apan, Dev Raj Paudyal, and Kithsiri Perera. 2023. “Convolutional Neural Network-Based Deep Learning Approach for Automatic Flood Mapping Using NovaSAR-1 and Sentinel-1 Data.” ISPRS International Journal of Geo-Information 12 (5): 194. https://doi.org/10.3390/ijgi12050194.
- Baig, Muhammad, Donghong Xiong, Md Mahfuzur Rahman, M. M. Islam, Ahmed Elbeltagi, Belayneh Mengesha, Dil Rai, Muhammad Tayyab, and Ashraf Dewan. 2022. “How Do Multiple Kernel Functions in Machine Learning Algorithms Improve Precision in Flood Probability Mapping?” Natural Hazards 113 (3): 1543–1562. https://doi.org/10.1007/s11069-022-05357-0.
- Barnes, Christopher J., Christopher J. van der Gast, Niall P. McNamara, Rebecca Rowe, and Gary D. Bending. 2018. “Extreme Rainfall Affects Assembly of the Root-associated Fungal Community.” The New Phytologist 220 (4): 1172–1184. https://doi.org/10.1111/nph.14990.
- Bennett, James C., David E. Robertson, Phillip G. D. Ward, H. A. Prasantha Hapuarachchi, and Quan J. Wang. 2016. “Calibrating Hourly Rainfall-Runoff Models with Daily Forcings for Streamflow Forecasting Applications in Meso-Scale Catchments.” Environmental Modelling & Software 76: 20–36. https://doi.org/10.1016/j.envsoft.2015.11.006.
- Bentivoglio, Roberto, Elvin Isufi, Sebastian Jonkman, and Riccardo Taormina. 2022. “Deep Learning Methods for Flood Mapping: A Review of Existing Applications and Future Research Directions.” Hydrology and Earth System Sciences 26 (16): 4345–4378. https://doi.org/10.5194/hess-26-4345-2022.
- Bui, D. T., N.-D. Hoang, F. Martínez-Álvarez, P.-T. T. Ngo, P. V. Hoa, T. D. Pham, P. Samui, and R. Costache. 2020. “A Novel Deep Learning Neural Network Approach for Predicting Flash Flood Susceptibility: A Case Study at a High Frequency Tropical Storm Area.” Science of the Total Environment 701: 134413. https://doi.org/10.1016/j.scitotenv.2019.134413.
- Bui, Quang-Thanh, Quoc-Huy Nguyen, Xuan Linh Nguyen, Vu Dong Pham, Huu Duy Nguyen, and Van-Manh Pham. 2020. “Verification of Novel Integrations of Swarm Intelligence Algorithms into Deep Learning Neural Network for Flood Susceptibility Mapping.” Journal of Hydrology 581: 124379. https://doi.org/10.1016/j.jhydrol.2019.124379.
- Bui, Dieu Tien, Biswajeet Pradhan, Haleh Nampak, Quang-Thanh Bui, Quynh-An Tran, and Quoc-Phi Nguyen. 2016. “Hybrid Artificial Intelligence Approach Based on Neural Fuzzy Inference Model and Metaheuristic Optimization for Flood Susceptibilitgy Modeling in a High-Frequency Tropical Cyclone Area Using GIS.” Journal of Hydrology 540: 317–330. https://doi.org/10.1016/j.jhydrol.2016.06.027.
- Costache, Romulus, Haoyuan Hong, and Yi Wang. 2019. “Identification of Torrential Valleys Using GIS and a Novel Hybrid Integration of Artificial Intelligence, Machine Learning and Bivariate Statistics.” CATENA 183: 104179. https://doi.org/10.1016/j.catena.2019.104179.
- Costache, Romulus, Quoc Bao Pham, Ehsan Sharifi, Nguyen Thi Thuy Linh, S. I. Abba, Matej Vojtek, Jana Vojteková, Pham Thi Thao Nhi, and Dao Nguyen Khoi. 2020. “Flash-Flood Susceptibility Assessment Using Multi-Criteria Decision Making and Machine Learning Supported by Remote Sensing and GIS Techniques.” Remote Sensing 12 (1): 106. https://doi.org/10.3390/rs12010106.
- Costache, Romulus, and Dieu Tien Bui. 2020. “Identification of Areas Prone to Flash-Flood Phenomena Using Multiple-Criteria Decision-Making, Bivariate Statistics, Machine Learning and Their Ensembles.” Science of The Total Environment 712: 136492. https://doi.org/10.1016/j.scitotenv.2019.136492.
- Cui, Hao, Hechun Quan, Ri Jin, and Zhehao Lin. 2023. “Flood Susceptibility Mapping Using Novel Hybrid Approach of Neural Network with Genetic Quantum Ensembles.” KSCE Journal of Civil Engineering 27 (1): 431–441. https://doi.org/10.1007/s12205-022-0559-6.
- Desai, Bina, Andrew Maskrey, Pascal Peduzzi, Andrea de Bono, and Christian Herold. 2015. “Making Development Sustainable: The Future of Disaster Risk Management.” In Global Assessment Report on Disaster Risk Reduction. GAR 2015.
- Estrany, Joan, Mauricio Ruiz, Raphael Mutzner, Josep Fortesa, Beatriz Nácher-Rodríguez, Miquel Tomàs-Burguera, Julián García-Comendador, et al. 2019. “Hydrogeomorphological Analysis and Modelling for a Comprehensive Understanding of Flash-Flood Damaging Processes: The 9th October 2018 Event in North-Eastern Mallorca.” Natural Hazards and Earth System Sciences 20 (8): 2195–2220. https://doi.org/10.5194/nhess-20-2195-2020.
- Fang, Lei, Jinliang Huang, Juntao Cai, and Vilas Nitivattananon. 2022. “Hybrid Approach for Flood Susceptibility Assessment in a Flood-Prone Mountainous Catchment in China.” Journal of Hydrology 612: 128091. https://doi.org/10.1016/j.jhydrol.2022.128091.
- Flood, Neil, Fiona Watson, and Lisa Collett. 2019. “Using a U-net Convolutional Neural Network to Map Woody Vegetation Extent from High Resolution Satellite Imagery Across Queensland, Australia.” International Journal of Applied Earth Observation and Geoinformation 82: 101897. https://doi.org/10.1016/j.jag.2019.101897.
- Florinsky, I. V. 2016a. “Chapter 2 – Topographic Surface and Its Characterization.” In Digital Terrain Analysis in Soil Science and Geology. (Second Edition), edited by I. V. Florinsky, 7–76. London, UK: Academic Press, Elsevier.
- Florinsky, I. V. 2016b. “Chapter 9 – Influence of Topography on Soil Properties.” In Digital Terrain Analysis in Soil Science and Geology. (Second Edition), edited by I. V. Florinsky, 265–270. London, UK: Academic Press, Elsevier.
- Glenn, E. P., K. Morino, P. L. Nagler, R. S. Murray, S. Pearlstein, and K. R. Hultine. 2012. “Roles of Saltcedar (Tamarix Spp.) and Capillary Rise in Salinizing a Non-Flooding Terrace on a Flow-Regulated Desert River.” Journal of Arid Environments 79: 56–65. https://doi.org/10.1016/j.jaridenv.2011.11.025.
- Hasanuzzaman, Md, Aznarul Islam, Biswajit Bera, and Pravat Kumar Shit. 2022. “A Comparison of Performance Measures of Three Machine Learning Algorithms for Flood Susceptibility Mapping of River Silabati (Tropical River, India).” Physics and Chemistry of the Earth, Parts A/B/C 127: 103198. https://doi.org/10.1016/j.pce.2022.103198.
- Helleis, Max, Marc Wieland, Christian Krullikowski, Sandro Martinis, and Simon Plank. 2022. “Sentinel-1-Based Water and Flood Mapping: Benchmarking Convolutional Neural Networks Against an Operational Rule-Based Processing Chain.” IEEE Journal of Selected Topics in Applied Earth Observations and Remote Sensing 15: 2023–2036. https://doi.org/10.1109/JSTARS.2022.3152127.
- Hong, Danfeng, Jocelyn Chanussot, Naoto Yokoya, Uta Heiden, Wieke Heldens, and Xiao Xiang Zhu. 2019. “WU-Net: A Weakly-Supervised Unmixing Network for Remotely Sensed Hyperspectral Imagery.” In IGARSS 2019 – 2019 IEEE International Geoscience and Remote Sensing Symposium, 373–376. Yokohama, Japan.
- Hosseini, Farzaneh Sajedi, Bahram Choubin, Amir Mosavi, Narjes Nabipour, Shahaboddin Shamshirband, Hamid Darabi, and Ali Torabi Haghighi. 2020. “Flash-Flood Hazard Assessment Using Ensembles and Bayesian-Based Machine Learning Models: Application of the Simulated Annealing Feature Selection Method.” Science of The Total Environment 711: 135161. https://doi.org/10.1016/j.scitotenv.2019.135161.
- Hosseini, Farzaneh Sajedi, Shahram Khalighi Sigaroodi, Ali Salajegheh, Alireza Moghaddamnia, and Bahram Choubin. 2021. “Towards a Flood Vulnerability Assessment of Watershed Using Integration of Decision-Making Trial and Evaluation Laboratory, Analytical Network Process, and Fuzzy Theories.” Environmental Science and Pollution Research 28 (44): 62487–62498. https://doi.org/10.1007/s11356-021-14534-w.
- Kabir, Syed, Sandhya Patidar, Xilin Xia, Qiuhua Liang, Jeffrey Neal, and Gareth Pender. 2020. “A Deep Convolutional Neural Network Model for Rapid Prediction of Fluvial Flood Inundation.” Journal of Hydrology 590: 125481. https://doi.org/10.1016/j.jhydrol.2020.125481.
- Kalisa, Wilson, Tertsea Igbawua, Malak Henchiri, Shahzad Ali, Sha Zhang, Bai Yun, and Jia-Hua Zhang. 2019. “Assessment of Climate Impact on Vegetation Dynamics over East Africa from 1982 to 2015.” Scientific Reports 9 (1): 16865. https://doi.org/10.1038/s41598-019-53150-0.
- Khan, Sultan Daud, and Saleh Basalamah. 2023. “Multi-Scale and Context-Aware Framework for Flood Segmentation in Post-Disaster High Resolution Aerial Images.” Remote Sensing 15 (8). https://doi.org/10.3390/rs15082208.
- Konapala, Goutam, Ashok K. Mishra, Yoshihide Wada, and Michael E. Mann. 2020. “Climate Change Will Affect Global Water Availability Through Compounding Changes in Seasonal Precipitation and Evaporation.” Nature Communications 11 (1): 3044. https://doi.org/10.1038/s41467-020-16757-w.
- Li, Zhouyayan, and Ibrahim Demir. 2023. “U-net-Based Semantic Classification for Flood Extent Extraction Using SAR Imagery and GEE Platform: A Case Study for 2019 Central US Flooding.” Science of The Total Environment 869: 161757. https://doi.org/10.1016/j.scitotenv.2023.161757.
- Li, Yuting, and Haoyuan Hong. 2023. “Modelling Flood Susceptibility Based on Deep Learning Coupling with Ensemble Learning Models.” Journal of Environmental Management 325: 116450. https://doi.org/10.1016/j.jenvman.2022.116450.
- Liu, Liangliang, Jianhong Cheng, Quan Quan, Fang-Xiang Wu, Yu-Ping Wang, and Jianxin Wang. 2020. “A Survey on U-shaped Networks in Medical Image Segmentations.” Neurocomputing 409: 244–258. https://doi.org/10.1016/j.neucom.2020.05.070.
- Long, Jonathan, Evan Shelhamer, and Trevor Darrell. 2015. “Fully Convolutional Networks for Semantic Segmentation.” In 2015 IEEE Conference on Computer Vision and Pattern Recognition (CVPR), 3431–3440. Boston, MA, USA.
- Martins, Lenise Farias, Ticiana Marinho de Carvalho Studart, João Dehon Pontes Filho, Victor Costa Porto, Francisco de Assis de Souza Filho, and Francisco Railson da Silva Costa. 2023. “Flash Flood Reconstruction and Analysis – A Case Study Using Social Data.” Climate 11 (1): 20. https://doi.org/10.3390/cli11010020.
- Martínez-Álvarez, F., and A. Morales-Esteban. 2019. “Big Data and Natural Disasters: New Approaches for Temporal and Spatial Massive Data Analysis.” Computers and Geosciences 129: 38–39. https://doi.org/10.1016/j.cageo.2019.04.012.
- McCuen, Richard H. 2016. Modeling Hydrologic Change: Statistical Methods. Boca Raton: CRC Press.
- Minaee, Shervin, Yuri Boykov, Fatih Porikli, Antonio Plaza, Nasser Kehtarnavaz, and Demetri Terzopoulos. 2022. “Image Segmentation Using Deep Learning: A Survey.” IEEE Transactions on Pattern Analysis and Machine Intelligence 44 (7): 3523–3542.
- Moradi, Halime, Simone Fattorini, and Jens Oldeland. 2020. “Influence of Elevation on the Species–Area Relationship.” Journal of Biogeography 47 (9): 2029–2041. https://doi.org/10.1111/jbi.v47.9.
- Mudashiru, Rofiat Bunmi, Nuridah Sabtu, Ismail Abustan, and Waheed Balogun. 2021. “Flood Hazard Mapping Methods: A Review.” Journal of Hydrology 603: 126846. https://doi.org/10.1016/j.jhydrol.2021.126846.
- Muralikrishnan, Sanjeev, Vladimir G. Kim, and Siddhartha Chaudhuri. 2018. “Tags2Parts: Discovering Semantic Regions from Shape Tags.” In 2018 IEEE/CVF Conference on Computer Vision and Pattern Recognition, 2926–2935. Salt Lake City, UT, USA.
- Myslinska, E. 1983. “Lithology of Flood Deposits as a Criterion for the Evaluation of Changes in a Drainage Basin.” Bulletin of the International Association of Engineering Geology 28 (1): 251–255. https://doi.org/10.1007/BF02594822.
- Nguyen, Viet-Nghia, Peyman Yariyan, Mahdis Amiri, An Dang Tran, Tien Dat Pham, Minh Phuong Do, Phuong Thao Thi Ngo, et al. 2020. “A New Modeling Approach for Spatial Prediction of Flash Flood with Biogeography Optimized CHAID Tree Ensemble and Remote Sensing Data.” Remote Sensing 12 (9): 1373.
- Nkwunonwo, U. C., M. Whitworth, and B. Baily. 2020. “A Review of the Current Status of Flood Modelling for Urban Flood Risk Management in the Developing Countries.” Scientific African 7: e00269. https://doi.org/10.1016/j.sciaf.2020.e00269.
- O'Donnell, Emily C., and Colin R. Thorne. 2020. “Drivers of Future Urban Flood Risk.” Philosophical Transactions of the Royal Society A: Mathematical, Physical and Engineering Sciences 378 (2168): 20190216. https://doi.org/10.1098/rsta.2019.0216.
- Papalexiou, Simon Michael, and Alberto Montanari. 2019. “Global and Regional Increase of Precipitation Extremes Under Global Warming.” Water Resources Research 55 (6): 4901–4914. https://doi.org/10.1029/2018WR024067.
- Paprotny, Dominik, Antonia Sebastian, Oswaldo Morales Napoles, and S. N. Jonkman. 2018. “Trends in Flood Losses in Europe over the Past 150 Years.” Nature Communications 9 (1). https://doi.org/10.1038/s41467-018-04253-1.
- Pishvaei, M. H., T. Sabzevari, S. Noroozpour, and R. Mohammadpour. 2020. “Effects of Hillslope Geometry on Spatial Infiltration Using the TOPMODEL and SCS-CN Models.” Hydrological Sciences Journal 65 (2): 212–226. https://doi.org/10.1080/02626667.2019.1686636.
- Rahman, Mahfuzur, Ningsheng Chen, Ahmed Elbeltagi, Md Monirul Islam, Mehtab Alam, Hamid Reza Pourghasemi, Wang Tao, et al. 2021. “Application of Stacking Hybrid Machine Learning Algorithms in Delineating Multi-Type Flooding in Bangladesh.” Journal of Environmental Management 295: 113086. https://doi.org/10.1016/j.jenvman.2021.113086.
- Rawat, Waseem, and Zenghui Wang. 2017. “Deep Convolutional Neural Networks for Image Classification: A Comprehensive Review.” Neural Computation 29 (9): 2352–2449. https://doi.org/10.1162/neco_a_00990.
- Razavi Termeh, Seyed Vahid, Aiding Kornejady, Hamid Reza Pourghasemi, and Saskia Keesstra. 2018. “Flood Susceptibility Mapping Using Novel Ensembles of Adaptive Neuro Fuzzy Inference System and Metaheuristic Algorithms.” Science of The Total Environment 615: 438–451. https://doi.org/10.1016/j.scitotenv.2017.09.262.
- Laura K. Read, and Richard M. Vogel. 2015. “Reliability, Return Periods, and Risk Under Nonstationarity.” Water Resources Research 51 (8): 6381–6398. https://doi.org/10.1002/2015WR017089.
- Rentschler, Jun, Melda Salhab, and Bramka Arga Jafino. 2022. “Flood Exposure and Poverty in 188 Countries.” Nature Communications 13 (1). https://doi.org/10.1038/s41467-022-30727-4.
- Rogger, M., M. Agnoletti, A. Alaoui, J. C. Bathurst, G. Bodner, M. Borga, V. Chaplot, et al. 2017. “Land Use Change Impacts on Floods at the Catchment Scale: Challenges and Opportunities for Future Research.” Water Resources Research 53 (7): 5209–5219. https://doi.org/10.1002/2017WR020723.
- Ronneberger, Olaf, Philipp Fischer, and Thomas Brox. 2015. “U-Net: Convolutional Networks for Biomedical Image Segmentation..Medical Image Computing and Computer-Assisted Intervention – MICCAI 2015. MICCAI 2015. Lecture Notes in Computer Science, vol 9351. Springer, Cham. Munich, Germany.
- Santiago-Collazo, Félix L., Matthew V. Bilskie, and Scott C. Hagen. 2019. “A Comprehensive Review of Compound Inundation Models in Low-Gradient Coastal Watersheds.” Environmental Modelling & Software 119: 166–181. https://doi.org/10.1016/j.envsoft.2019.06.002.
- Sayers, Paul, Li Yuanyuan, Gerald Galloway, Edmund Penning-Rowsell, Shen Fuxin, Wen Kang, Chen Yiwei, and Tom Le Quesne. 2013. Flood Risk Management: A Strategic Approach. Paris: Asian Development Bank, GIWP, UNESCO and WWF-UK.
- Schiermeier, Quirin. 2011. “Increased Flood Risk Linked to Global Warming.” Nature 470 (7334): 316. https://doi.org/10.1038/470316a.
- Taromideh, Fereshteh, Ramin Fazloula, Bahram Choubin, Alireza Emadi, and Ronny Berndtsson. 2022. “Urban Flood-Risk Assessment: Integration of Decision-Making and Machine Learning.” Sustainability 14 (8): 4483. https://doi.org/10.3390/su14084483.
- Tehrany, Mahyat, Lalit Kumar, Mustafa Jebur, and Farzin Shabani. 2018. “Evaluating the Application of the Statistical Index Method in Flood Susceptibility Mapping and Its Comparison with Frequency Ratio and Logistic Regression Methods.” Geomatics, Natural Hazards and Risk 10: 79–101.
- Tien Bui, Dieu, and Nhat-Duc Hoang. 2017. “A Bayesian Framework Based on a Gaussian Mixture Model and Radial-Basis-Function Fisher Discriminant Analysis (BayGmmKda V1. 1) for Spatial Prediction of Floods.” Geoscientific Model Development 10 (9): 3391–3409. https://doi.org/10.5194/gmd-10-3391-2017.
- Tien Bui, Dieu, Nhat-Duc Hoang, Francisco Martínez-Álvarez, Phuong-Thao Thi Ngo, Pham Viet Hoa, Tien Dat Pham, Pijush Samui, and Romulus Costache. 2020. “A Novel Deep Learning Neural Network Approach for Predicting Flash Flood Susceptibility: A Case Study at a High Frequency Tropical Storm Area.” Science of The Total Environment 701: 134413. https://doi.org/10.1016/j.scitotenv.2019.134413.
- Torres, José F., Dalil Hadjout, Abderrazak Sebaa, Francisco Martínez-Álvarez, and Alicia Troncoso. 2021. “Deep Learning for Time Series Forecasting: A Survey.” Big Data 9 (1): 3–21. https://doi.org/10.1089/big.2020.0159.
- Troncoso, A., P. Ribera, G. Asencio-Cortés, I. Vega, and D. Gallego. 2018. “Imbalanced Classification Techniques for Monsoon Forecasting Based on a New Climatic Time Series.” Environmental Modelling & Software 106: 48–56. Special Issue on Environmental Data Science. Applications to Air quality and Water cycle. https://doi.org/10.1016/j.envsoft.2017.11.024.
- Ullah, Kashif, Yi Wang, Zhice Fang, Lizhe Wang, and Mahfuzur Rahman. 2022. “Multi-Hazard Susceptibility Mapping Based on Convolutional Neural Networks.” Geoscience Frontiers 13 (5): 101425. https://doi.org/10.1016/j.gsf.2022.101425.
- Winsemius, Hessel, Ludovicus P. H. Beek, M. F. P. Bierkens, A. Bouwman, Brenden Jongman, Jaap Kwadijk, Willem Ligtvoet, et al. 2015. “Global Drivers of Future River Flood Risk.” Nature Climate Change 6: 381–385.
- Xie, Shang-Ping, Clara Deser, Gabriel A. Vecchi, Jian Ma, Haiyan Teng, and Andrew T. Wittenberg. 2010. “Global Warming Pattern Formation: Sea Surface Temperature and Rainfall.” Journal of Climate23 (4): 966–986. https://doi.org/10.1175/2009JCLI3329.1.
- Yang, Dun, Yufei Cai, Guangmin Hu, Xingmiao Yao, and Wen Zou. 2020. “Seismic Fault Detection Based on 3D Unet++ Model. In Society of Exploration Geophysicists, SEG Technical Program Expanded Abstracts 2020, 1631–163. Online.
- Yariyan, Peyman, Saeid Janizadeh, Phong Tran, Huu Nguyen, Duy Nguyen, Romulus-Dumitru Costache, Hiep Van Le, et al. 2020. “Improvement of Best First Decision Trees Using Bagging and Dagging Ensembles for Flood Probability Mapping.” Water Resources Management 34 (9): 3037–3053. https://doi.org/10.1007/s11269-020-02603-7.
- Youssef, Ahmed M., Biswajeet Pradhan, Abhirup Dikshit, and Ali M. Mahdi. 2022. “Comparative Study of Convolutional Neural Network (CNN) and Support Vector Machine (SVM) for Flood Susceptibility Mapping: A Case Study At Ras Gharib, Red Sea, Egypt.” Geocarto International 37 (26): 11088–11115. https://doi.org/10.1080/10106049.2022.2046866.
- Zhao, Jie, Yu Li, Patrick Matgen, Ramona Pelich, Renaud Hostache, Wolfgang Wagner, and Marco Chini. 2022. “Urban-Aware U-Net for Large-Scale Urban Flood Mapping Using Multitemporal Sentinel-1 Intensity and Interferometric Coherence.” IEEE Transactions on Geoscience and Remote Sensing 60: 1–21.
- Zhou, Zongwei, Md Mahfuzur Rahman Siddiquee, Nima Tajbakhsh, and Jianming Liang. 2020. “UNet++: Redesigning Skip Connections to Exploit Multiscale Features in Image Segmentation.” IEEE Transactions on Medical Imaging 39 (6): 1856–1867. https://doi.org/10.1109/TMI.42.
- Zhuang, Li, Zijun Zhang, and Long Wang. 2020. “The Automatic Segmentation of Residential Solar Panels Based on Satellite Images: A Cross Learning Driven U-Net Method.” Applied Soft Computing 92: 106283. https://doi.org/10.1016/j.asoc.2020.106283.
- Zounemat-Kermani, Mohammad, Okke Batelaan, Marzieh Fadaee, and Reinhard Hinkelmann. 2021. “Ensemble Machine Learning Paradigms in Hydrology: A Review.” Journal of Hydrology 598: 126266. https://doi.org/10.1016/j.jhydrol.2021.126266.