
 ?Mathematical formulae have been encoded as MathML and are displayed in this HTML version using MathJax in order to improve their display. Uncheck the box to turn MathJax off. This feature requires Javascript. Click on a formula to zoom.
ABSTRACT
Building pattern recognition is important for understanding urban forms, automating map generalization, and visualizing 3D city models. However, current approaches based on object-independent methods have limitations in capturing all visually aware patterns due to the part-based nature of human vision. Moreover, these approaches also suffer from inefficiencies when applying proximity graph models. To address these limitations, we propose a framework that leverages multi-scale data and a knowledge graph, focusing on recognizing C-shaped building patterns. We first employ a specialized knowledge graph to represent the relationships between buildings within and across various scales. Subsequently, we convert the rules for C-shaped pattern recognition and enhancement into query conditions, where the enhancement refers to using patterns recognized at one scale to enhance pattern recognition at other scales. Finally, rule-based reasoning is applied within the constructed knowledge graph to recognize and enrich C-shaped building patterns. We verify the effectiveness of our method using multi-scale data with three levels of detail (LODs) collected from AMap, and our method achieves a higher recall rate of 26.4% for LOD1, 20.0% for LOD2, and 9.1% for LOD3 compared to existing methods with similar precision rates. We also achieve recognition efficiency improvements of 0.91, 1.37, and 9.35 times, respectively.
1. Introduction
In the context of urban environments, buildings often exhibit high-level patterns such as alphabetical shapes or linear arrangements, influenced by various socio-political, economic, cultural, or natural factors. Recognizing these patterns is essential for comprehending urban forms (Du, Shu, and Wang Citation2019; Yan et al. Citation2019), visualizing 3D city models (Hu, Fan, and Noskov Citation2018; Mao, Harrie, and Ban Citation2012), and automating map generalization (Renard and Duchêne Citation2014; Shen et al. Citation2022).
Numerous methods have been proposed to recognize building patterns automatically, which can be broadly categorized into shape recognition and arrangement recognition. Shape recognition methods employ techniques such as turning functions (Arkin et al. Citation1991), shape contexts (Belongie, Malik, and Puzicha Citation2002), Fourier descriptors (Ai et al. Citation2013), graph convolutional autoencoder models (Yan et al. Citation2021), or rectangular encodes (Wei et al. Citation2021) to represent and classify buildings into cognitively enhanced shapes like C-shaped or E-shaped ones. In contrast, arrangement recognition methods focus on identifying regularly arranged building clusters, such as alphabetical or linear patterns, using approaches like template matching (Rainsford and Mackaness Citation2002; Xing et al. Citation2021), structural rules (Du, Shu, and Feng Citation2015; Pilehforooshha and Karimi Citation2019; Wang and Burghardt Citation2020; Zhang, Ai, and Stoter Citation2013), or machine learning techniques (He, Zhang, and Xin Citation2018; Yan et al. Citation2019; Zhao et al. Citation2020). It is worth noting that, in some instances, arrangement recognition is synonymous with pattern recognition. To avoid confusion, in this work, pattern recognition will only refer to both shape recognition and arrangement recognition, while arrangement recognition solely refers to recognizing regularly arranged building clusters.
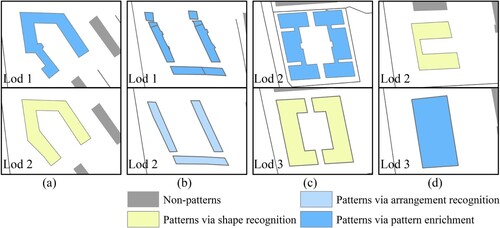
However, the majority of existing pattern recognition methods are object-independent and rely on proximity graph models, leading to two significant challenges. Firstly, object-independent methods may fail to capture all visually apparent patterns. This limitation arises from the fact that human vision operates as a part-based system, where shapes sometimes need to be decomposed into parts or grouped into clusters to accomplish visual tasks (Singh, Seyranian, and Hoffman Citation1999). For instance, shape recognition methods can only detect the C-shaped building in (d), while arrangement recognition methods can solely identify the C-shaped arrangement in (b). However, the buildings in (a) and (c) also exhibit visually C-shaped patterns, which cannot be recognized by the aforementioned object-independent methods. Secondly, pattern recognition based on proximity graph models can be time-consuming due to the extensive searching and matching operations involved. This leads to inefficiencies in the pattern recognition process, hampering efficient analysis of large-scale datasets.
Figure 1. An example to illustrate the limitations of existing pattern recognition methods and the potential benefits of integrating multi-scale data. (a), (c) The patterns cannot be recognized using existing methods. (b) The pattern can be recognized using arrangement recognition; (d) The pattern can be recognized using shape recognition.
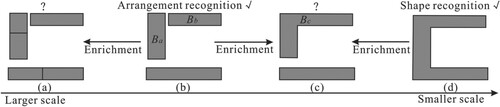
Multi-scale data reflects users’ understanding of how buildings can be clustered or divided at different levels (Zhang et al. Citation2018). Considering the part-based nature of human vision, recognizing patterns at one scale can enhance pattern recognition at other scales when integrating multi-scale data with an awareness of the corresponding relationships between buildings. For instance, if the C-shaped pattern in (b) has been recognized, it becomes possible to recognize the buildings in (c) as a pattern by identifying the one-to-many relations between buildings Ba, Bb in (b) and building Bc in (c). Recently, knowledge graphs have emerged as powerful tools for modeling relations between entities and facilitating the integration of multi-scale data (Huang and Harrie Citation2020; Wei et al. Citation2023). By storing entities and relationships as key-value pairs, knowledge graphs enable efficient reasoning to acquire new knowledge. Therefore, if we utilize a knowledge graph to represent the properties and relationships of buildings within and across different scales, the resulting building patterns as a form of new knowledge could also be efficiently and effectively recognized.
Motivated by the ideas mentioned above, we aim to enhance the efficiency and effectiveness of building pattern recognition by integrating multi-scale data through a knowledge graph. Our approach involves two main steps: first, recognizing C-shaped patterns at various scales, and second, enriching the C-shaped building patterns across scales based on the identified patterns. To achieve this, we construct a specialized knowledge graph that represents the properties and relationships of buildings within and across different scales. By converting the rules for C-shaped pattern recognition and enrichment into query conditions on the knowledge graph, we can effectively and efficiently recognize the C-shaped patterns by executing graph queries. It is important to note that C-shaped buildings, as single entities, need to be recognized beforehand as they cannot be directly identified through knowledge graphs.
In summary, our contributions, achieved through the integration of multi-scale data using a knowledge graph, can be categorized into two folds: (1) Enhanced efficiency in building pattern recognition at specific scales through rule reasoning within the constructed knowledge graph; (2) Implementation of pattern enrichments based on the recognized patterns at each scale within the constructed knowledge graph, leading to the identification of a wider range of patterns. It is important to note that previous approaches lack the incorporation of such an enrichment process.
2. Related works
2.1. Building shape recognition
Building shape recognition aims to classify buildings into cognitively enhanced shapes like C-shaped or E-shaped ones, relying on effective shape representation. There are two primary methods for shape representation: region-based and boundary-based. Region-based methods involve measuring the overall characteristics of a building's region, such as compactness (Li, Goodchild, and Church Citation2013) or, the equal area circle (Basaraner and Cetinkaya Citation2017). The European Agent program also conducted a detailed analysis of the measures for building characteristics. Among them, Duchêne, Bard, and Barillot (Citation2003) focused on building orientation measures, while Burghardt and Steiniger (Citation2005) investigated the principal components of a building's spatial features. Wei et al. (Citation2018) analyzed 24 measures for describing building geometric features and proposed a measure set for building geometry analysis. Boundary-based methods approximate building shapes as strings or functions, such as turning functions (Arkin et al. Citation1999), shape contexts (Belongie, Malik, and Puzicha Citation2002), Fourier descriptors (Ai et al. Citation2013), and rectangular encodes (Wei et al. Citation2022). Additionally, artificial intelligence algorithms, including graph convolutional autoencoder models and CNN-based polygon encoders, have also been introduced for shape representation (Mai et al. Citation2023; Yan et al. Citation2021). Using these shape representation methods, buildings can then be classified into standard shapes, which are commonly used in building typification and 3D city model visualization (Yan, Ai, and Yang Citation2016).
In summary, existing approaches have been able to effectively recognize building shapes. However, these standard shapes represent only a part of building patterns. To achieve a more comprehensive method of pattern recognition, it is necessary to consider other information, such as patterns recognized using arrangement recognition methods at the same scale or patterns recognized at other scales.
2.2. Building arrangement recognition
Building arrangement patterns refer to the regular arrangement of buildings, and recognizing such patterns requires defining their regularity. This can be accomplished through template-based, structural rule-based, or machine learning-based methods.
Template-based methods formalize building patterns using predefined templates. For instance, Rainsford and Mackaness (Citation2002) employed templates to detect linear patterns in rural buildings, while Xing et al. (Citation2021) used templates to identify combined collinear patterns. Similarly, Yang (Citation2011) and Gong and Wu (Citation2018) introduced templates for stair-shaped, Z-shaped, and H-shaped patterns based on structural parameters. Nonetheless, these methods have limitations in recognizing all potential patterns due to their rigid formalization. Alternatively, machine learning-based methods employ intelligent algorithms such as graph convolutional networks and random forest algorithms to learn pattern recognition rules (He, Zhang, and Xin Citation2018; Yan et al. Citation2019; Zhao et al. Citation2020). However, these methods may require a large and diverse training dataset to enhance their accuracy. Additionally, an examination of the reasons why these algorithms are effective may also be necessary.
Structural rule-based methods define patterns as groups of buildings based on perceptual rules. Compared to the aforementioned methods, structural rule-based methods provide greater flexibility in defining patterns, making them widely used in current research. They typically utilize proximity graphs to represent building properties and relationships, and rules are subsequently defined to detect patterns. For example, Zhang, Ai, and Stoter (Citation2013) recognized collinear and curvilinear patterns based on the minimum spanning tree (MST) and Gestalt principles. Similarly, Wei et al. (Citation2018) detected linear patterns using four proximity graphs, where the relative nearest graph (RNG) proved to be the most accurate. Pilehforooshha and Karimi (Citation2019) proposed a framework for detecting linear building patterns based on a defined similarity index, which was then refined by a pattern interaction index. Wang and Burghardt (Citation2020) employed stroke principles to detect linear building patterns based on a proximity graph. As different linear building patterns may share the same buildings, Gong et al. (Citation2014) detected multi-connected linear patterns by deleting edges from a DT-like proximity graph, grid patterns were then recognized based on these multi-connected linear patterns. Recognizing the part-based nature of human vision, Du, Shu, and Feng (Citation2015) developed a three-level relational method based on spatial reasoning to detect collinear patterns and alphabetical-shaped patterns. Additionally, Wei et al. (Citation2022) recognized linear building patterns combining convex polygon decomposition, where a building could be decomposed into sub-buildings for pattern recognition. However, these methods based on proximity graphs often require numerous searching and matching operations, resulting in inefficiencies, making them inefficient.
In summary, structural rule-based approaches are popular in current research due to their flexibility in meeting personalized user needs. However, their efficiency is limited by the graph traversal strategy, which hinders their application in large-scale regions. Moreover, recent studies have demonstrated that incorporating data at lower or higher levels can enhance building pattern recognition, suggesting that integrating multi-scale data could improve the effectiveness of pattern recognition.
2.3. Knowledge graph representation and rule-based reasoning
The property graph model is widely used for representing knowledge graphs (Wang et al. Citation2019), and in this approach, we use it to replace the proximity graph models for building pattern recognition. To store the resulting knowledge graph, we utilize Neo4j, a popular graph database. The Cypher query language in Neo4j is then applied to express the rules governing building pattern recognition. Consequently, in this section, we introduce the utilization of the property graph model in Neo4j for knowledge graph representation and rule-based reasoning. It should be noted that alternative graph models such as the resource description framework (RDF) and other graph databases can also be employed for this purpose.
A property graph in Neo4j can be represented as ,
is an entity set,
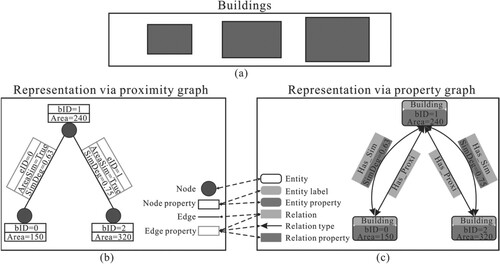
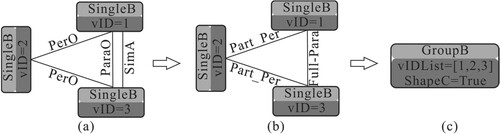
is a relationship set. Each entity, denoted by vm, can possess zero or more labels indicating its type, while each relationship between entities vi and vj, denoted by e(vi,vj), must be assigned a type to define the nature of the relationship. Both entities and relationships have properties (key-value pairs), which further describe them. In , the right part illustrates demonstrates how a property graph can represent proximity relations (Has_Proxi), area similarity relations (Has_Sim), and the area similarity degree (SimDeg) among three buildings. Compared to the representation using a proximity graph (the left part of ), e(vi,vj) in a property graph can represent various relations, while e(vi,vj) in a proximity graph can only represent a proximity relation. It is worth noting that proximity graphs and property graphs can have different expressions according to practical requirements, is presented solely to provide examples.
Figure 2. Comparison of representing buildings and their relationships using proximity graph and property graph. (a) Buildings; (b) Proximity graph representation; (c) Property graph representation.
Once a knowledge graph is constructed and stored, new knowledge can be inferred by formulating rules as query conditions using the Cypher language. For example, to identify buildings with exactly two neighbors, the rules can be defined as depicted in . By converting these rules into Cypher query conditions, we can retrieve buildings that satisfy the specified criteria. In this case, the building with bID 1 can be obtained.
Table 1. Rules via Cypher language to identify buildings with exactly two neighbors.
3. The knowledge graph representation
As per the illustrations in the introduction, the primary focus of our method is using a knowledge graph to recognize the C-shaped building arrangements initially, and enrich the C-shaped building patterns across scales subsequently. Hence, knowledge graph representation encompasses two key aspects. Firstly, it involves representing the relations between buildings, specifically targeting the recognition of C-shaped building arrangements at a particular scale. Secondly, it entails representing the corresponding relations between buildings across various scales.
3.1. Defining the building relations at a particular scale
According to Du, Shu, and Feng (Citation2015) and Gong and Wu (Citation2018), a C-shaped building arrangement comprises three adjacent buildings, with one building in the middle and two buildings on either side that form the wings of the C shape. The wing buildings are fully parallel to each other and partially perpendicular to the middle building. Therefore, to recognize a C-shaped building arrangement, it is necessary to define the ‘proximity relation’, ‘fully parallel relation’, and ‘partially perpendicular relation’, and establishing ‘interval relations’ is the first step in defining the latter two (Du, Shu, and Feng Citation2015).
(1) Proximity relation
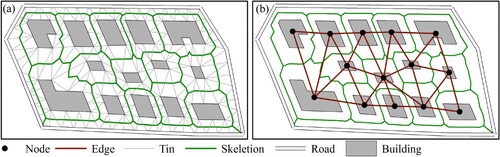
The proximity relation between two buildings in topological maps is typically determined by adjacency or shared borders or corners. Because buildings separated by roads are not considered adjacent, we propose using the constrained Delaunay triangulation (CDT) skeleton, which takes roads into account, for detecting proximity relations between buildings based on the work of Liu et al. (Citation2014). As shown in (a), buildings that share the same CDT skeleton are considered to be in proximity to each other, and a proximity graph can then be built to represent the proximity relations between buildings, as shown in (b).
is the node set, where pvm represents building Bm.
is the edge set, where pe(pvi, pvj) indicates that buildings Bi and Bj are in proximity to each other. The proximity relation between Bi and Bj, denoted as P(Bi, Bj), is symmetric, which means P(Bi, Bj)
P(Bj, Bi).
Figure 3. Proximity relations between buildings. (a) The constrained Delaunay triangulation (CDT) skeleton; (b) The proximity graph.
(2) Interval relation
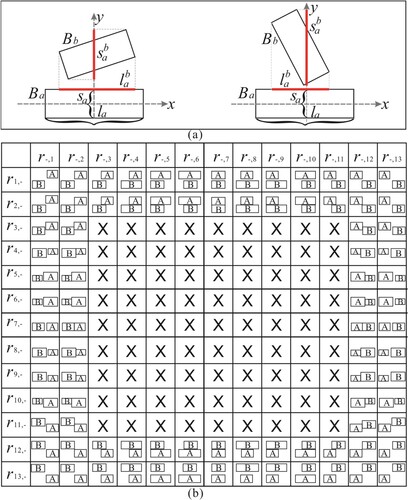
We approximate the buildings by their smallest bounding rectangles (SBRs) to define the interval relation between two buildings, as proposed by Du, Shu, and Feng (Citation2015). Suppose two buildings Ba (the referent one) and Bb (the target one), their SBRs are SBR(Ba) and SBR(Bb). The long and short axes of SBR(Ba) are represented as la and sa, respectively. The interval relation between Ba and Bb (as shown in (a)) can be defined by projecting SBR(Bb) onto la and sa, denoted as r(la, ) and r(sa,
), and form a relation
, where
and
are the projections. Based on the interval algebra introduced by Allen (Citation1983),
or
can be modeled as 13 basic relations. Thus,
can be defined as 169 basic relations, as shown in (b). It is worth noting that non-overlapped relations are more prevalent in reality, and we exclude overlapped interval relations (indicated by × in ) in this proposed approach. To prevent excessive over-approximation or overlapped interval relations, we incorporate the rectangularity (Srec) to determine whether a building can be approximated by its SBR, where Srec is defined as Equation (1).
(1)
(1) A is the area of the building, and Asbr is the area of its SBR. If a building is with
, we approximate it using its SBR; else it indicates a complex shape that is less likely to form a regular arrangement (Du, Shu, and Feng Citation2015; Zhang, Ai, and Stoter Citation2013), and we represent it as-is, without considering interval relations for such buildings in our approach. Consequently, buildings with complex shapes are excluded from the C-shaped arrangement recognition process.
Figure 4. The interval relations between two buildings.
To further measure the facing degree between two buildings (Ba and Bb) in an interval relation, the facing ratio (Fd) is defined as Equation (2).
(2)
(2) where Overlap means an intersection, and Merge means a union.
(3) Fully parallel relation
Two buildings, Ba and Bb, are considered fully parallel (Full_Para) if they have a similar size (SimA), parallel directions(ParaO), their long axes overlap over a certain degree and two buildings fully overlap on long axes only, and is defined as Equation (3) (Du, Shu, and Feng Citation2015).
(3)
(3) where A is the building area, O is the orientation of the SBR of a building,
,
, and
are thresholds.
(4) Partially perpendicular relation
A buildings Bb is considered partially perpendicular (Part_Per) to building Ba if they have perpendicular directions (PerO) and the projections of Bb onto Ba either partly overlap with the axes of Ba, and is defined as Equation (4).
(4)
(4) where O is the orientation of the SBR of a building.
3.2. Defining the corresponding building relations across various scales
When buildings are represented at smaller scales, they may undergo simplification, elimination, aggregation with others, or collapse into points. This leads to coarser or more abstract representations of buildings at larger scales. Depending on the level of detail, six relations can occur between buildings across different scales, as detailed in (Fan et al. Citation2014; Memduhoglu and Basaraner Citation2022). These relations encompass one-to-one, one-to-many, many-to-one, and many-to-many matches between corresponding buildings at different scales. However, in some cases, a building at one scale may not have a corresponding match at the other scale, resulting in either a one-to-none or none-to-one relation.
Table 2. The definition for corresponding building relations across various scales.
3.3. Representing the buildings and their relations in a knowledge graph
We utilize the property graph model to construct the knowledge graph, representing the buildings and building relations within the knowledge graph as , where
refers to the entity set,
is the relation set, V and E are defined as follows.
(1) Entities
The entities are individual buildings or building groups, each of which possesses a property as ‘Scale’ that designates the scale of the associated building data. To differentiate between individual buildings and building groups, entities are assigned labels as ‘SingleB’ and ‘GroupB’. As defined in Equations (3) and (4) for fully parallel relation (Full_Para) and partially perpendicular relation (Part_Per), building area and orientation are involved. Therefore, the area and orientation are represented as the property of a building entity. Because we aim to recognize C-shaped patterns, a property ‘ShapeC’ is given to indicate whether an entity is a C-shaped one. Based on the above analysis, the entities in a knowledge graph are represented in .
Table 3. The entity representation in the knowledge graph.
(2) Relations
Recognizing C-shaped building patterns involves several types of relations at a particular scale, including proximity, interval, Full_Para, and Part_Per, as well as matching relations across scales. In addition, a ‘Belong_To’ relation needs to be included to indicate that an individual building entity is part of a group building entity.
To represent relations at a particular scale, Full_Para, and Part_Per relations can be derived from size, orientation, proximity, and interval relations between buildings. Since the area and orientation of a building are already represented as properties of a building entity, we focus on representing proximity and interval relations in the knowledge graph. Full_Para and Part_Per relations will be obtained through rule-based reasoning within the constructed knowledge graph. To distinguish between proximity and interval relations, we assign the ‘Has_Proxi’ and ‘Has_Interval’ types to these relations. The basic type of an interval relation is denoted by a property as ‘Inter_T’. For instance, if buildings Bi and Bj, represented as entity vi and vj, are proximate to each other, a relation e(vi,vj) is established with the type ‘Has_Proxi’, indicating that e(vi,vj) is a proximity relation.
The corresponding relationships between two buildings across scales, including one-to-one, one-to-many, many-to-one, and many-to-many, can be represented as ‘Has_Match’ with a property ‘Match_T’, where ‘Match_T’ values correspond to the relationship types. For instance, if two entities, vi and vj, have a ‘Has_Match’ relation with property ‘Match_T’ of one-to-many, this implies a one-to-many relationship between vi and vj. Additionally, none-to-one and one-to-none relationships can be explicitly expressed if they are not represented in a knowledge graph.
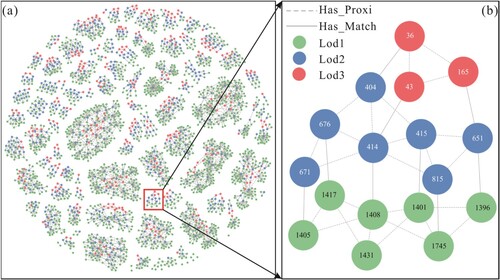
Based on the above analysis, illustrates the representation of relations within a knowledge graph. Using this representation of entities and relations, we can construct and store a knowledge graph in Neo4j, an example of a constructed knowledge graph is shown in . It is important to note that different knowledge graphs can be built for this task, and we will discuss building a different knowledge graph in Section 6.1.
Figure 5. The constructed knowledge graph for multi-scale building data in Neo4j. (a) The multi-scale building data; (b) The query window; (c) The constructed knowledge graph; (d) Detailed information about a selected entity or relation.
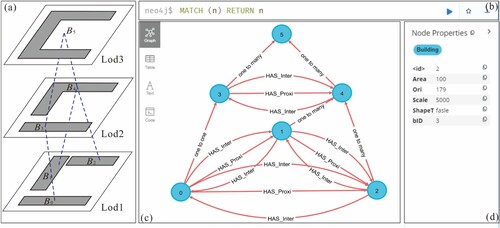
Table 4. The relation representation in the knowledge graph.
4. C-shaped building pattern recognition using rule-based reasoning
C-shaped building pattern recognition via rule-based reasoning within the built knowledge graph in our proposed approach involves two steps: recognizing C-shaped building arrangements at a particular scale and enriching the patterns across different scales. It is important to note that C-shaped buildings have been recognized beforehand.
4.1. Recognizing C-shaped building arrangements at a particular scale
A C-shaped building arrangement consists of three adjacent buildings, with one building in the middle (BM) and two wing buildings (BW1 and BW2) on either side. The wing buildings are fully parallel to each other, while also being partially perpendicular to the middle building, and a C-shaped building arrangement is defined as Equation (5).
(5)
(5) To recognize a C-shaped building arrangement within the constructed knowledge graph, the definition needs to be converted into rules that are suitable for rule-based reasoning. Since we store the knowledge graph in a Neo4j database, we utilize the Cypher language to define rules for deriving the C-shaped building arrangement. As defined in Equation (5), Full_Para and Part_Per relations need to be obtained because they are not represented in the knowledge graph. Additionally, similar size (SimA), parallel directions(ParaO), and perpendicular directions (PerO) relations need to be determined for establishing Full_Para and Part_Per relations, as defined in Equations (3) and (4). Therefore, the rule-based reasoning process for C-shaped building arrangement recognition consists of three steps: (1) verify the SimA, ParaO, and PerO relations; (2) verify the Full-Para and Part_Per relations; (3) recognize the C-shape building arrangements. The overall process is illustrated in .
Figure 6. The flowchart for recognizing C-shaped building arrangements. (a) Verify the SimA, ParaO, and PerO relations; (b) Verify the Full-Para and Part_Per relations; (c) Recognize the C-shape building arrangements.
4.2. Enriching C-shaped building patterns across various scales
Our method considers two types of enrichments, as identified by Wei et al. (Citation2022) and Xing et al. (Citation2021). Wei et al. (Citation2022) proposed decomposing a building into sub-buildings for pattern recognition. Buildings at larger scales represent potential subdivisions of the buildings at a smaller scale, allowing structural patterns recognized at a larger scale to enrich those recognized at a smaller scale (i.e. bottom-up enrichment). In contrast, Xing et al. (Citation2021) suggested grouping buildings into clusters for pattern recognition. Buildings at smaller scales represent potential building groups at a larger scale, enabling structural patterns recognized at a smaller scale to enrich those recognized at a larger scale (i.e. Top-down enrichment).
(1) Bottom-up enrichment
For bottom-up enrichment, suppose three buildings (Ba, Bb, Bc) as a group at a larger scale (Sb) are recognized as a C-shaped pattern. Their corresponding buildings at a smaller scale (Su) are . As proposed by Wei et al. (Citation2022), a building at a smaller scale can be decomposed into sub-buildings for building pattern recognition. If Ba, Bb, and Bc are part of Bi (i.e. have a many-to-one or one-to-one relation), then
can potentially form a C-shaped pattern. Take the C-shaped building pattern (B0, B1, B2) in (a) as an example, B3 at a larger scale has a one-to-one relation with B0, B4 at a larger scale has a one-to-many relation to B1, and B2, then B3 and B4 can potentially form a C-shaped pattern. The process for bottom-up enrichment is shown in (b).
Figure 7. The example process for building pattern enrichments across various scales. (a) The multi-scale building data; (b) The bottom-up enrichment; (c) The top-down enrichment.
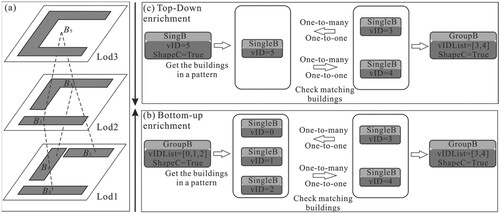
(2) Top-down enrichment
For top-down enrichment, suppose a building or a building group is recognized as a C-shaped pattern at a smaller scale (Su). Their corresponding building groups at a larger scale (Sb) are. As proposed by Xing et al. (Citation2021), buildings can be grouped into clusters for pattern recognition. If
are parts of Ba, (i.e. have a one-to-many or one-to-one relation), then
can potentially form a C-shaped pattern. Take the C-shaped building B5 in (a) as an example, B3 and B4 at a larger scale have a one-to-many relation to B5, then B3 and B4 can potentially form a C-shaped pattern. The process for top-down enrichment is shown in (c).
5. Experiments
5.1. Benchmark dataset and experimental environment
5.1.1. Benchmark dataset
The AMap offers spatial data across 20 different levels of detail. Since buildings are predominantly displayed at larger scales, we utilized a building dataset obtained from the AMap, focusing specifically on three levels of detail (levels 8–11) that served as our benchmark dataset. These levels of detail correspond to different scales: approximately 1:5000, 1:10000, and 1:20000 for levels 8, 9, and 10, respectively. This dataset was sourced from a specific area in Nanjing, China, as illustrated in . The spatial characteristics of buildings within the benchmark dataset including building count (Bc), average area (Ave_A), average edge count (Ave_Ed), the rate of buildings with edge count fewer than eight (), average rectangularity (Ave_Srec), and the rate of buildings with rectangularity greater than 0.6 (
) are presented in (Wei et al. Citation2022). From the table, we can make the following observations. Firstly, the majority of the buildings exhibit simple shapes, as indicated by the high values of
(>0.64) and
(>0.78). This implies that the buildings in this benchmark dataset can be reasonably approximated with their SBRs for C-shaped arrangement recognition. Secondly, as the scale decreases, there is a corresponding increase in Ave_Area, while
, Ave_Srec, and
decrease. This suggests that the buildings become more complex in shape, and shape recognition is also a crucial factor for enriching C-shaped building patterns as the scale decreases.
Figure 8. Benchmark dataset.
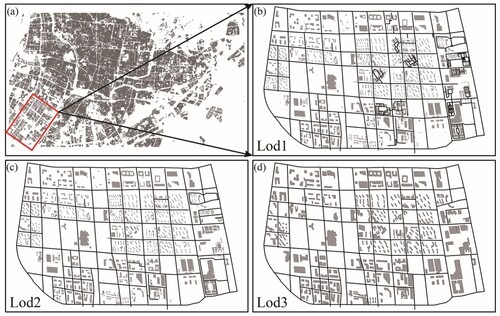
Table 5. Analysis of the spatial characteristics of buildings in the study area.
5.1.2. Experimental environment
We utilized the C# code to compute the measures for spatial characteristics of buildings and their relationships based on ArcEngine 10.2. The resulting knowledge graph was stored in Neo4j 1.4.12, and rule-based reasoning was implemented using Cypher language. The experiments were conducted on a personal computer equipped with an Intel® Core™ 1.60 GHz i5-8265U CPU and 8G RAM.
5.2. Constructing the knowledge graph and its visualization
(1) Deriving the building relations at a particular scale
Section 3.1 outlines the derivation process of building relations at a particular scale. Initially, a proximity graph was proposed to represent proximity relations between buildings. Based on these proximity relations, we derived the interval relations, fully parallel relations (Full_Para), and partially perpendicular relations (Part_Per) between buildings. To define the Full_Para and Part_Per relations, we used the thresholds in Equations (3) and (4) according to Du, Shu, and Feng (Citation2015) and Wei et al. (Citation2022), as follows: ,
, and
.
(2) Deriving the corresponding relations between buildings at various scales
To identify the corresponding relations between buildings at various scales, a geometric matching process can be performed. However, since geometric matching is not the primary focus of our approach, we employed a simple but efficient method proposed by Fan et al. (Citation2014) and Memduhoglu and Basaraner (Citation2022) and identified corresponding buildings (Bref and Btar) based on their overlapping areas, as defined in Equation (6). Specifically, if , Bref and Btar were considered to be corresponding buildings. To ensure more accurate identification of corresponding relations, manual adjustments were made to refine the identified relations between buildings following the aforementioned process.
(6)
(6) Aref and Atar are areas of Bref and Btar, and
is the overlapping area of Bref and Btar.
(3) The knowledge graph and visualization
Building upon the illustrations presented in Section 3.3, we can represent the building relations within and across various scales as a knowledge graph, as depicted in . (a) visualizes the proximity relations at a particular scale (Has_Proxi) and the corresponding relations across various scales (Has_Match), which was implemented via EChart, and a force-direct method was applied to avoid crosses and overlaps between nodes and edges as much as possible (Li et al. Citation2018). (a) demonstrates that the defined proximity relations result in the formation of different clusters of building entities. Moreover, (b) provides a more detailed view of the constructed knowledge graph, effectively showcasing how the inter-building relationships in a local area can be accurately represented as a knowledge graph.
Figure 9. (a) The constructed knowledge graph; (b) An enlarged view.
5.3. Pattern recognition results
5.3.1. Effectiveness evaluation
(1) Implement details
Pattern enrichments, as introduced in Section 4.2, represent a novel addition to our proposed approach, allowing for the recognition of a wider range of C-shaped building patterns compared to previous methods. To evaluate the effectiveness of our approach, we conducted a comparative experiment comprising two distinct parts: (1) the recognition of C-shaped buildings and building arrangements without pattern enrichments (SP + PP), and (2) the recognition of C-shaped buildings and building arrangements with pattern enrichments (SP + PP + EP). C-shaped buildings were initially identified through manual shape recognition, while C-shaped building arrangements were recognized within the constructed knowledge graph using the rules defined in Section 4.1. Furthermore, C-shaped pattern enrichments were implemented within the constructed knowledge graph using the rules defined in Section 4.2.
To evaluate the performance, we adopted two metrics, Precision and Recall, as proposed by Du, Shu, and Feng (Citation2015). Precision and Recall values were determined by comparing the recognized patterns with those manually identified by three experienced graduate students specializing in cartography and geographic information science. These students independently annotated the C-shaped patterns, being aware that the buildings could be organized into groups or decomposed to facilitate pattern recognition. In cases where the annotated results were inconsistent, a voting system was implemented to reach a consensus. Recognized patterns that were consistent with those identified by the students were denoted as true positives (tp), while inconsistent patterns were denoted as false positives (fp). Patterns that went unnoticed by the proposed method were denoted as false negatives (fn). Precision and Recall values were calculated using Equations (7) and (8).
(7)
(7)
(8)
(8)
(2) Results
The C-shaped patterns obtained through our proposed method are illustrated in , while the corresponding statistics are presented in . Examining and , it is evident that the implementation of pattern enrichments leads to improved Recall values. Specifically, for Lod1, the Recall value increases by 26.4%, for Lod2 it increases 20.0%, and for Lod3 it increases 9.1% when compared to the results obtained without pattern enrichments. These findings indicate that the pattern enrichments can help recognize more C-shaped building patterns. This difference can be attributed to the fact that human vision is a part-based system, and object-independent pattern recognition is insufficient to recognize all potential patterns. For example, the C-shaped arrangements P1 and P2 (Area A in ) can only be partially recognized, and P3, P4, P5, and P6 can’t be recognized with the existing method (Area A and Area B in ). However, all of these patterns can be recognized using the proposed approach, and these patterns are also visually aware patterns by users. Particularly, P1, P2, P3, P4, and P5 are recognized with top-down pattern enrichments, and P6 is recognized with bottom-up pattern enrichments.
Figure 10. C-shaped building pattern recognition results.
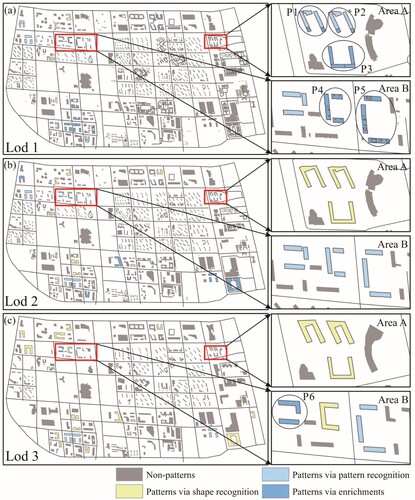
Table 6. Evaluation of the effectiveness.
Regarding Precision, we can observe that high Precision values can be achieved if pattern enrichments are implemented. Specifically, the Precision value for Lod1 is 84.2%, for Lod2 it is 92.9%, and for Lod3 it is 97%. However, it is important to note that implementing pattern enrichments may also lead to a decrease in Precision. The Precision values decrease amounts to 1.0% for Lod1, 7.1% for Lod2, and 3% for Lod3. These indicate that while pattern enrichments assist in recognizing more patterns, they may also introduce misrecognitions, such as those shown in . Such misrecognitions occur since patterns are only stable within certain scale ranges or periods, and patterns at different scales can be altered through map generalization or changes in geographical features (Tenerelli and Ehrlich Citation2011). For example, the C-shaped building in 10(d) can be recognized via shape recognition, but its corresponding building at higher levels is more likely to have a rectangular shape, which will lead to a misrecognition in a bottom-up pattern enrichment. In Section 6.3, we will delve into a detailed analysis of the underlying factors that contribute to misrecognition and discuss potential strategies to address this issue .
Figure 11. C-shaped building pattern misrecognition results.
5.3.2. Efficiency evaluation
(1) Implement details
A key innovation of our proposed approach is the efficient recognition of C-shaped building patterns through the utilization of a knowledge graph, in contrast to the predominant reliance on proximity graphs in previous works. To evaluate the efficiency of our proposed approach, we performed a comparative experiment wherein we separately recognized C-shaped building arrangements using both a proximity graph and a knowledge graph. Both methods applied the same rules, as defined in Section 4.1, to recognize the C-shaped building arrangements. To ensure the robustness of the results, each method underwent testing in 10 experiments. In evaluating the efficiency, we considered the entity count (vc), minimum time (Min_t), maximum time (Max_t), and average time (Ave_t).
(2) Results
The efficiency results are presented in . Notably, the Ave_t value for our proposed method is 1.368s for Lod1, 0.558s for Lod2, and 0.351s for Lod3. Comparing these values to the method utilizing a proximity graph, our proposed approach achieves speeds that are 9.35, 1.37, and 0.91 times faster, respectively. These results indicate that our method offers improved efficiency. Moreover, the Ave_t values exhibit an approximately linear increase with the growth in vc. This observation suggests that the average time required does not sharply escalate with larger data sizes, indicating that our method is well-suited for handling large areas. This efficiency can be attributed to the utilization of a knowledge graph, which stores entity relations as key-value pairs, eliminating the need for extensive computing resources to establish entity matching. In summary, our method not only offers improved efficiency compared to the proximity graph-based methods but also provides significant enhancements in efficiency as the data size increases.
Table 7. Evaluation of the efficiency.
6. Discussions
6.1. Constructing a different knowledge graph
The extensibility of the knowledge graph is a key advantage that we leverage to construct the knowledge graph in a flexible and scalable bottom-up manner, tailored to the specific application requirements. In practice, different knowledge graphs can be constructed based on diverse needs. For instance, we have represented building size, orientation, proximity, and interval relations in the knowledge graph, while Full_Para and Part_Per are obtained through rule-based reasoning. Alternatively, we can directly represent Full_Para and Part_Per relations to build a different knowledge graph, as shown in . This would simplify the rules for pattern recognition. However, obtaining Full_Para and Part_Per before constructing the knowledge graph would take a longer time. Despite this, it would also enable recognition of the C-shaped building patterns.
Table 8. The elements of knowledge graph for C-shaped building pattern recognition.
6.2. Recognizing other kinds of structural patterns
To facilitate the recognition of C-shaped building patterns, we represent the underlying relations as a knowledge graph and formulate the rules for pattern recognition and enrichment as query conditions on the graph. This methodology can also be extended to identify other types of building patterns, such as the E-shaped building patterns. For our experimental analysis, we utilized two levels of data, namely nominal scales of approximately 1:5000 and 1:20000, containing a total of 5014 and 778 buildings, respectively, collected from the AMap dataset. The rules used for recognizing E-shaped building arrangements were consistent with those outlined by Du, Shu, and Feng (Citation2015). The corresponding outcomes are presented in and . The results indicate that our proposed method achieves comparable recognition outcomes for E-shaped building patterns, albeit with a slightly lower Precision (9.5% decrease and 6.2% decrease) but higher Recall (47.6% increase and 5.2% increase). Notably, the patterns depicted in (c)−(f) require cross-scale enrichments for accurate recognition, which existing approaches fail to accomplish.
Figure 12. Recognition of other kinds of structural patterns.
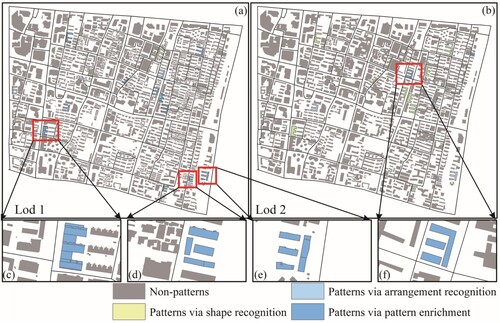
Table 9. Evaluation of the effectiveness.
6.3. Analyzing misrecognition results and potential strategies
Our proposed approach integrates multi-scale data using a knowledge graph to enhance the recognition of building patterns in a more effective and efficient manner. However, it is important to note that this approach may occasionally misrecognize certain patterns. This occurs due to the dynamic nature of buildings, which can change at different scales. Chen, Zhang, and Lin (Citation2018) identified two primary factors contributing to changes in map objects within multi-scale data: map generalization and real changes in geographical features.
Firstly, buildings at a smaller scale are typically derived through map generalization based on data from a larger scale. As a result of map generalization, buildings may undergo significant changes such as deletion. Then the patterns containing these buildings at a smaller scale may also be altered. For example, in (a), left part, three buildings are recognized as a H-shaped structure at a larger scale. However, at a smaller scale, the corresponding buildings are more likely to form a parallel pattern due to the removal of a small building. Similarly, in the right part of (a), a C-shaped building at a larger scale may be simplified into a rectangular shape at a smaller scale. Both of these scenarios can lead to the misrecognition of building patterns. To address this problem, studying the variation law of building patterns with respect to scale may be necessary. These findings can then be incorporated into rules within our pattern enrichment process to enhance its effectiveness.
Figure 13. Causes contributing to misrecognition of building patterns: (a) Map generalization and (b) Real changes.
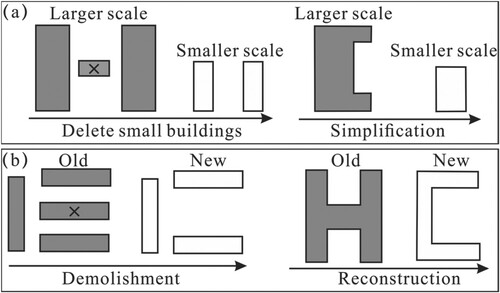
Second, multi-scale data may be acquired at different points in time, and buildings can change during this period. For example, buildings may be demolished or reconstructed, as depicted in (b). Consequently, the associated patterns can also be altered. In the left part of (b), four buildings can be recognized as an E-shaped pattern, but at a later time, they are more likely to form a C-shaped pattern due to the demolition of a building during the period. Likewise, in the right part of (b), an H-shaped building at an earlier time may change into a C-shaped building at a later time due to reconstruction. These scenarios can also result in the misrecognition of building patterns. To address this problem, it is essential to analyze the differences between changes caused by map generalization and those resulting from real changes. By identifying these real changes, and pattern enrichments may not be suitable for areas exhibiting such changes.
7. Conclusion
To improve the efficiency and effectiveness of recognizing building patterns in topographical maps, we proposed a method that integrates multi-scale data using a knowledge graph. As a case study, we focused on the C-shaped building pattern and represented the relationships between buildings within and across different scales in a knowledge graph. We then used rule-based reasoning to recognize and enrich patterns across scales within the built knowledge graph. Our results demonstrated that our method achieved higher recall and efficiency compared to existing approaches, with a recall of 26.4% for LOD1, 20.0% for LOD2, and 9.1% for LOD3, and an efficiency improvement of 0.91, 1.37, and 9.35 times. Additionally, our proposed approach was capable of recognizing other building patterns, such as E-shaped patterns.
However, we also found that patterns were only stable within a certain scale range or period. The patterns at different scales could change due to map generalization or realistic changes in geographical features, leading to misrecognition. Therefore, future work will focus on understanding the variation law of building patterns with scales or periods to enable more effective pattern recognition across scales.
Data and code availability statement and data deposition
The data and code that support the findings of this study are all openly available, website is: https://github.com/TrentonWei/Linear-Building-Pattern-Recognition-.git
Acknowledgments
The authors would like to thank the anonymous reviewers for their helpful and constructive comments that greatly contributed to improving the manuscript.
Disclosure statement
No potential conflict of interest was reported by the author(s).
Additional information
Funding
References
- Ai, T., X. Cheng, P. Liu, M. Yang. 2013. “A Shape Analysis and Template Matching of Building Features by the Fourier Transform Method.” Computers, Environment and Urban Systems 41: 219–233. https://doi.org/10.1016/j.compenvurbsys.2013.07.002
- Allen, J. F. 1983. “Maintaining Knowledge about Temporal Interval.” Communications of the ACM 26 (11): 832–843. https://doi.org/10.1145/182.358434
- Arkin, E. M., L. P. Chew, D. P. Huttenlocher, K. Kedem. 1991. “An Efficiently Computable Metric for Comparing Polygonal Shapes.” IEEE Transactions on Pattern Analysis and Machine Intelligence 13 (2): 209–216. https://doi.org/10.1109/34.75509
- Basaraner, M., and S. Cetinkaya. 2017. “Performance of Shape Indices and Classification Schemes for Characterizing Perceptual Shape Complexity of Building Footprints in GIS.” International Journal of Geographical Information Science 31 (10): 1952–1977. https://doi.org/10.1080/13658816.2017.1346257
- Belongie, S., J. Malik, and J. Puzicha. 2002. “Shape Matching and Object Recognition Using Shape Contexts.” IEEE Transactions on Pattern Analysis and Machine Intelligence 24 (4): 509–522. https://doi.org/10.1109/34.993558
- Burghardt, D., and S. Steiniger. 2005. “Usage of Principal Component Analysis in the Process of Automated Generalisation”. In Proceedings of the 22nd International Cartographic Conference, A Coruña, Spain.
- Chen, L., X. Zhang, and H. Lin. 2018. “ChangeAnalysisand DecisionTree Based Detection Model for Residential Objects across Multiple Scales.” Acta Geodaetica et Cartographica Sinica 47 (3): 403–412.
- Du, S., M. Shu, and C. Feng. 2015. “Representation and Discovery of Building Patterns: A Three-level Relational Approach.” International Journal of Geographical Information Science 30 (6): 1161–1186. https://doi.org/10.1080/13658816.2015.1108421
- Du, S., M. Shu, and Q. Wang. 2019. “Modelling Relational Contexts in GEOBIA Framework for Improving Urban Land-Cover Mapping.” GIScience & Remote Sensing 56 (2): 184–209. https://doi.org/10.1080/15481603.2018.1502399
- Duchêne, C., S. Bard, and X. Barillot. 2003. “Quantitative and Qualitative Description of Building Orientation”. 5th Workshop on Progress in Automated Map Generalization, Paris.
- Fan, H., A. Zipf, Q. Fu, P. Neis. 2014. “Quality Assessment for Building Footprints Data on OpenStreetMap.” International Journal of Geographical Information Science 28 (4): 700–719. https://doi.org/10.1080/13658816.2013.867495
- Gong, X., and F. Wu. 2018. “A Graph Match Approach to Typical Pattern Recognition in Urban Building Groups.” Geomatics and Information Science of Wuhan University 43 (1): 159–166.
- Gong, X., F. Wu, H. Qian, K. Ma. 2014. “The Parameter Discrimination Approach to Multi-connected Linear Pattern Recognition in Building Groups.” Geomatics and Information Science of Wuhan University 39 (3): 335–339.
- He, X., X. Zhang, and Q. Xin. 2018. “Recognition of Building Group Patterns in Topographic Maps Based on Graph Partitioning and Random Forest.” ISPRS Journal of Photogrammetry and Remote Sensing 136: 26–40. https://doi.org/10.1016/j.isprsjprs.2017.12.001
- Hu, X., H. Fan, and A. Noskov. 2018. “Roof Model Recommendation for Complex Buildings Based on Combination Rules and Symmetry Features in Footprints.” International Journal of Digital Earth 11 (10): 1039–1063. https://doi.org/10.1080/17538947.2017.1373867
- Huang, W., and L. Harrie. 2020. “Towards Knowledge-based Geovisualisation Using Semantic Web Technologies: A Knowledge Representation Approach Coupling Ontologies and Rules.” International Journal of Digital Earth 13 (9): 976–997. https://doi.org/10.1080/17538947.2019.1604835
- Li, W., M. F. Goodchild, and R. Church. 2013. “An Efficient Measure of Compactness for Two-dimensional Shapes and Its Application in Regionalization Problems.” International Journal of Geographical Information Science 27 (6): 1227–1250. https://doi.org/10.1080/13658816.2012.752093
- Li, D., H. Mei, Y. Shen, S. Su, W. Zhang, J. Wang, ... & W. Chen. 2018. “ECharts: A Declarative Framework for Rapid Construction of Web-based Visualization.” Visual Informatics 2 (2): 136–146. https://doi.org/10.1016/j.visinf.2018.04.011
- Liu, Y., Q. Guo, Y. Sun, X. Ma. 2014. “A Combined Approach to Cartographic Displacement for Buildings Based on Skeleton and Improved Elastic Beam Algorithm.” Plos one 9 (12): e113953. https://doi.org/10.1371/journal.pone.0113953
- Mai, G., C. Jiang, W. Sun, R. Zhu, Y. Xuan, L. Cai, ... & N. Lao. 2023. “Towards General-purpose Representation Learning of Polygonal Geometries.” GeoInformatica 27 (2): 289–340. https://doi.org/10.1007/s10707-022-00481-2
- Mao, B., L. Harrie, and Y. Ban. 2012. “Detection and Typification of Linear Structures for Dynamic Visualization of 3D City Models.” Computers, Environment and Urban Systems 36 (3): 233–244. https://doi.org/10.1016/j.compenvurbsys.2011.10.001
- Memduhoglu, A., and M. Basaraner. 2022. “An Approach for Multi-scale Urban Building Data Integration and Enrichment Through Geometric Matching and Semantic Web.” Cartography and Geographic Information Science 49 (1): 1–17. https://doi.org/10.1080/15230406.2021.1952108
- Pilehforooshha, P., and M. Karimi. 2019. “An Integrated Framework for Linear Pattern Extraction in the Building Group Generalization Process.” Geocarto International 34 (9): 1000–1021. https://doi.org/10.1080/10106049.2018.1458253
- Rainsford, D., and W. Mackaness. 2002. “Template Matching in Support of Generalization of Rural Buildings.” In The 10th International Symposium on Spatial Data Handling, edited by D. Richardson, 137–151. Berlin: Springer.
- Renard, J., and C. Duchêne. 2014. “Urban Structure Generalization in Multi-agent Process by Use of Reactional Agents.” Transactions in GIS 18 (2): 201–218. https://doi.org/10.1111/tgis.12018
- Shen, Y., J. Li, Z. Wang, R. Zhao, L. Wang. 2022. “A Raster-based Typification Method for Multiscale Visualization of Building Features Considering Distribution Patterns.” International Journal of Digital Earth 15 (1): 249–275. https://doi.org/10.1080/17538947.2021.2023668
- Singh, M., G. D. Seyranian, and D. D. Hoffman. 1999. “Parsing Silhouettes: The Short-cut Rule.” Perception & Psychophysics 61 (4): 636–660. https://doi.org/10.3758/BF03205536
- Tenerelli, P., and D. Ehrlich. 2011. “Analysis of Built-up Spatial Pattern at Different Scales: Can Scattering Affect Map Accuracy?” International Journal of Digital Earth 4 (sup1): 107–116. https://doi.org/10.1080/17538947.2010.512431
- Wang, X., and D. Burghardt. 2020. “Using Stroke and Mesh to Recognize Building Group Patterns.” International Journal of Cartography 6 (1): 71–98. https://doi.org/10.1080/23729333.2019.1574371
- Wang, H., G. Qi, H. Chen, J. Pan, J. Ding, L. Ding,... & W. Zhang. 2019. Knowledge Graph. Beijing.: Publishing House of Electronics Industry.
- Wei, Z., S. Ding, L. Cheng, W. Xu, Y. Wang, L. Zhang. 2022. “Linear Building Pattern Recognition in Topographical Maps Combining Convex Polygon Decomposition.” Geocarto International 37 (26): 11365–11389. https://doi.org/10.1080/10106049.2022.2055794
- Wei, Z., Q. Guo, L. Cheng, Y. Liu, Y. Tong. 2021. “Shape Similarity Measurement Based on DNA Alignment for Buildings with Multiple Orthogonal Features.” Acta Geodaetica et Cartographica Sinica 50 (12): 1683–1693.
- Wei, Z., Q. Guo, L. Wang, F. Yan. 2018. “On the Spatial Distribution of Buildings for Map Generalization.” Cartography and Geographic Information Science 45 (6): 539–555. https://doi.org/10.1080/15230406.2018.1433068
- Wei, Z., Y. Xiao, Y. Tong, W. Xu, Y. Wang. 2023. “Linear Building Pattern Recognition via Spatial Knowledge Graph.” Acta Geodaetica et Cartographica Sinica, 52(8): 1355–1363.
- Xing, R., F. Wu, X. Gong, J. Du, C. Liu. 2021. “The Template Matching Approach to Combined Collinear Pattern Recognition in Building Groups.” Acta Geodaetica et Cartographica Sinica 50 (6): 800–811.
- Yan, X., T. Ai, and M. Yang. 2016. “A Simplification of Residential Feature by the Shape Cognition and Template Matching Method.” Acta Geodaetica et Cartographica Sinica 45 (7): 874–882.
- Yan, X., T. Ai, M. Yang, H. Yin. 2019. “A Graph Convolutional Neural Network for Classification of Building Patterns Using Spatial Vector Data.” ISPRS Journal of Photogrammetry and Remote Sensing 150: 259–273. https://doi.org/10.1016/j.isprsjprs.2019.02.010
- Yan, X., T. Ai, M. Yang, X. Tong. 2021. “Graph Convolutional Autoencoder Model for the Shape Coding and Cognition of Buildings in Maps.” International Journal of Geographical Information Science 35 (3): 490–512. https://doi.org/10.1080/13658816.2020.1768260
- Yang, W. 2011. “Identify Building Patterns”. The International Archives of Photogrammetry, Remote Sensing and Spatial Information Sciences. Göttingen: Copernicus GmbH, 391–398.
- Zhang, X., T. Ai, and J. Stoter. 2013. “Building Pattern Recognition in Topographic Data: Examples on Collinear and Curvilinear Alignments.” Geoinformatica 17 (1): 1–33. https://doi.org/10.1007/s10707-011-0146-3
- Zhang, X., W. Yin, M. Yang, T. Ai, J. Stoter. 2018. “Updating Authoritative Spatial Data from Timely Sources: A Multiple Representation Approach.” International Journal of Applied Earth Observation and Geoinformation 72: 42–56. https://doi.org/10.1016/j.jag.2018.05.022
- Zhao, R., T. Ai, W. Yu, Y. He, Y. Shen. 2020. “Recognition of Building Group Patterns Using Graph Convolutional Network.” Cartography and Geographic Information Science 47 (5): 400–417. https://doi.org/10.1080/15230406.2020.1757512