
 ?Mathematical formulae have been encoded as MathML and are displayed in this HTML version using MathJax in order to improve their display. Uncheck the box to turn MathJax off. This feature requires Javascript. Click on a formula to zoom.
ABSTRACT
Background
Secondary montane forests, covering 30% of forested lands in the Andes, play a crucial role in mitigating the impact of carbon release. However, the mechanisms responsible for carbon sequestration in the above-ground biomass of these forests are not well quantified.
Aims
Understanding the determinants of above-ground carbon (AGC) dynamics in secondary forests along a 3000-m elevational gradient in the Andes to assess their mitigation potential.
Methods
We assessed how abiotic and biotic conditions and past human disturbances were related to forest structure and composition, AGC stocks and productivity within sixteen 0.36-ha plots established in secondary forest stands of 30–35 years of age.
Results
Structural equation models revealed that changes in temperature conditions along the elevation gradient shaped leaf functional composition, which in turn controlled AGC dynamics. Productivity and temperature decreased with increasing elevation and decreased tree community leaf area. Disturbance legacy (Tree mortality) increased with competitive thinning and low soil fertility.
Conclusions
We show that temperature drives AGC dynamics by changing the functional trait composition. This highlights the importance of preserving these forests along elevation gradients and implies potentially strong future changes due to global warming.
Introduction
Tropical forests harbour a large proportion of global tree diversity and store a significant fraction of terrestrial carbon (C) stocks in their vegetation and soil (Pan et al. Citation2011; Sullivan et al. Citation2017; Requena Suarez et al. Citation2019). They contain between 40% and 50% of the global terrestrial vegetation C stocks and account for 30–40% of the global net primary productivity (Townsend et al. Citation2011; Phillips et al. Citation2019). Their capacity to fix large amounts of CO2, and store C in their biomass, exceeds that released by autotrophic and heterotrophic respiration (Malhi and Grace Citation2000; Malhi Citation2012). Furthermore, these ecosystems exhibit long continuity of forest cover and ecological processes, such as their role in the water cycle (Bruijnzeel et al. Citation2010), which results in unique assemblages of biota (Wirth et al. Citation2009) and make them important components of climate regulation (Artaxo et al. Citation2022).
Nearly half of the world’s tropical forests are secondary forests at different regrowth stages, and their species composition, structure and biomass C stocks and productivity are the product of past disturbances – natural and anthropogenic – and the local environment (Chazdon Citation2003; Marín-Spiotta et al. Citation2007). Notably, in the Neotropics, 55% (ca. 569 million ha) of the remaining forest area is considered degraded (Grantham et al. Citation2020), primarily due to logging and land conversion for cattle grazing (Armenteras et al. Citation2017). Since secondary forests comprise a quarter of all pantropical forests [ca. 763 million ha; Rutishauser et al. (Citation2015)], understanding the determinants of C dynamics in secondary forests and their potential contribution to climate change mitigation is important. In the Andes, the region has witnessed a complex interplay of forest regeneration and loss over the past decades. Aide et al. (Citation2019) have estimated a cumulative forest loss of 488,353 ha and regrowth of 988,790 ha, equalling a net increase of 500,437 ha between 2001 and 2014. The dynamics of forest loss and regrowth results in a patchwork of secondary forest stands of different successional stages of recovery or degradation, increasing the spatial variation of C in the biomass (Christmann et al. Citation2023).
Plot-based studies in tropical montane forests are few (but see Duque et al. (Citation2021) and Cuni-Sanchez et al. (Citation2021)), as researchers have primarily focused on C stocks in old-growth lowland rain forests (e.g. Brienen et al. Citation2015; Sullivan et al. Citation2017, Citation2020; Hubau et al. Citation2020). There have been some studies on C stocks in tropical secondary forests using permanent plots (Poorter et al. Citation2016, Citation2021; N’Guessan et al. Citation2019), but very few along elevation gradients in the Andes (Spracklen and Righelato Citation2016). Such studies, however, are essential to understand how ecosystem structure and function change over space and through time (Hérault and Piponiot Citation2018) and assess their long-term potential for C sequestration and storage (Mathez-Stiefel et al. Citation2017).
The rate of primary productivity and hence C sequestration tend to decrease with secondary forest age (Poorter et al. Citation2021). For example, mean annual accumulation of C in stem biomass (above-ground carbon [AGC] following Duque et al. (Citation2021)) between 1,000 and 2,250 m a.s.l. was 3.24 Mg C ha−1 for forests up to 12 years after pasture recovery in southern Ecuador as opposed to 0.70 Mg C ha−1 for forests between 15 and 40 years of age (Spracklen and Righelato Citation2016). Similarly, in the eastern Andes, a chronosequence study has reported annual AGC productivity of 6- to 8-year-old secondary forests at 3,000 m a.s.l. to be 6.79 Mg C ha−1 y−1 and 30-year-old forests at 2.98 Mg C ha−1 y−1 (Fehse et al. Citation2002). The differences described in these studies between young and intermediate-age secondary forests may be attributed to the rapid establishment and fast growth rate of species during early successional stages (Fehse et al. Citation2002) and the high light availability compared to more mature and slower-growing species during the later stages with lower light availability (Matsuo et al. Citation2021).
Studies along elevation gradients in Andean forests have shown that AGC stocks and productivity are related to both biotic (e.g. species richness [SR]) and abiotic (e.g. climate) conditions, alongside disturbance history (Girardin et al. Citation2014; Duque et al. Citation2021). Variations in AGC stocks and AGC productivity with elevation have been related to a decrease in temperature and tree SR (Lieberman et al. Citation1996; Duque et al. Citation2021), with their highest values typically found at low elevation (<1,100 m a.s.l.) at warmer temperatures (ca. 150 Mg C ha−1; Moser et al. (Citation2011); Phillips et al. (Citation2019)), and gradually decreasing with increasing elevation (ca. 99 Mg C ha−1 above 3,000 m a.s.l.; Girardin et al. (Citation2010); Moser et al. (Citation2011); Román-Cuesta et al. (Citation2011)) as temperature decreased. However, the determinants of AGC dynamics in secondary forests remain limited.
The ‘mass-ratio hypothesis’ (Grime Citation1998; Hooper et al. Citation2005) proposes that direct controls on ecosystem processes, such as AGC productivity and tree growth, could be determined by the traits and functional diversity of dominant plant species in a community (Fauset et al. Citation2015; Finegan et al. Citation2015). Research in lowland tropical forests has found support for this hypothesis and indicated that leave functional traits (LFTs), such as specific leaf area (SLA), were positively (Poorter et al. Citation2017) and negatively (van der Sande et al. Citation2017) related to AGC productivity, suggesting that plant traits are important AGC determinants.
Changes in environmental conditions with elevation, e.g. temperature, rainfall (Jarvis and Mulligan Citation2011; Fyllas et al. Citation2017), in montane forests are related to plant traits, community trait assembly and thus ecological functioning (Luo et al. Citation2019; van der Sande et al. Citation2021; Llerena-Zambrano et al. Citation2021). As elevation increases, LFTs change from acquisitive to conservative traits. Acquisitive traits (e.g. large leaf area) increase light interception and increase photosynthetic efficiency, resulting in higher AGC productivity. Conversely, conservative leaf traits (e.g. thick and small leaves) enhance nutrient retention, reduce transpiration and extend leaf lifetimes, slowing carbon gain but increasing survival (J. Ordoñez et al. unpublished). However, the relationship between plant functional traits and AGC dynamics throughout elevation has yet to be evaluated in secondary Andean forests.
Across large environmental gradients, SR has been found to be significantly related to AGC dynamics (Poorter et al. Citation2017). SR may enhance biomass stocks and dynamics through a variety of mechanisms. For example, niche complementarity or facilitation among species could increase biomass growth at the community level (Cardinale et al. Citation2011). Likewise, dilution of species-specific pathogens could reduce diseases and thus increase productivity (Schnitzer et al. Citation2011), ultimately increasing AGC stocks (Chisholm et al. Citation2013). Yet, in hyper-diverse tropical forests, the relevance of diversity varies due to SR saturation (Prado-Junior et al. Citation2016; van der Sande et al. Citation2017, Citation2017) or its impact on AGC stocks alone (Poorter et al. Citation2015). Few studies have simultaneously explored the independent effects of environmental conditions and diversity on AGC stocks and dynamics (Poorter et al. Citation2017), and none has examined these factors across extensive elevation gradients in secondary forests.
To our knowledge, no previous study in the Andes has simultaneously evaluated the relative importance of SR, trait composition, disturbance and microclimate conditions on carbon dynamics in tree communities along an elevation gradient. In this study, we assessed C stocks and productivity of the above-ground biomass (AGC following Duque et al. (Citation2021)) of secondary forests of intermediate age (30–35 years old) in the Ecuadorian Andes. We aimed to identify the primary determinants of AGC stocks and productivity along a 3,000-m elevational gradient. Based on three censuses between 2015 and 2019, we quantified tree SR, AGC stocks and productivity within sixteen 0.36-ha secondary forest plots. Our objective included the (1) quantification of SR, forest structure and AGC accumulation along the elevation gradient after 30–35 years of forest recovery, contrasting these findings with previous reports on mature Andean forests; (2) identification of the factors related to forest structure, composition, AGC stocks and productivity along the elevation gradient and (3) assessing how tree mortality related with AGC dynamics throughout the elevation gradient. First, we predicted that the rapid growth and high rate of recruitment of tree individuals would lead to similar SR, forest structure, AGC stocks and productivity as found in mature forests (Duque et al. Citation2021; Cuni-Sanchez et al. Citation2021). Second, we expected that SR and the dominance of species with acquisitive leaf traits (e.g. large SLA) would decrease with elevation because of strong environmental filtering caused by decreasing temperatures and as a physiological adaptation to reduce transpiration rates in leaves due to decrease in annual precipitation and increase UV radiation. The reduction in SR and increased dominance of conservative tree species (e.g. low SLA and high leaf dry matter content (LDMC)) would, in turn, lead to reduced biomass growth and accumulation because they invest more energy in developing leave tissue and allocate a lower proportion of resources in stem growth. Third, we expected that tree mortality and consequently carbon loss in the above-ground compartment (defined as AGC mortality) would decrease with elevation (Ceballos et al. Citation2021), driven by a decrease in temperature and a concomitant decrease in soil fertility (Poorter and Bongers Citation2006; Moser et al. Citation2011), causing a shift towards tree communities with conservative strategies, favouring survival over growth. Finally, we expected that past human disturbance (i.e. selective logging) could have altered this pattern by increasing mortality rates in secondary forests, overriding the effect of environmental conditions (Sheil and Bongers Citation2020).
Materials and methods
Study site and experimental design
Sixteen permanent plots, 60 m × 60 m in size, were established in 30- to 35-year-old secondary montane forests along the Pichincha Forest dynamic monitoring transect in 2015 (van Manen ML et al. Citation2019; Llerena-Zambrano et al. Citation2021). The transect is found on the western versant of the Ecuadorian Andes () along an elevation gradient of ca. 3,000 m (range: 632–3,507 m a.s.l.), covering four ecosystem types: piedmont, lower montane, montane and upper montane forest (Ministerio del Ambiente del Ecuador Citation2012). The plots were positioned in four elevation bands and separated by about 300 ± 100 m elevation from each other, each band containing four plots. Each plot was subdivided into nine subplots (20 m × 20 m) for the census of trees, palms and tree ferns to account for variation in forest structure (e.g. small vs. large trees, Chave et al. (Citation2003)). Annual precipitation, ranged from 2,700 mm at the lower section (1,200 m a.s.l.) to 1,250 mm in the upper section (3,100 m a.s.l.), with a bimodal distribution (van Manen ML et al. Citation2019).
Figure 1. The Pichincha forest dynamics monitoring transect on the western versant of the Ecuadorian Andes, located near Quito in the Andean Choco Biosphere Reserve, comprises 16 permanent plots (represented by coloured dots along the elevation gradient) spanning an elevation of ca. 3,000 m (represented in greyscale).
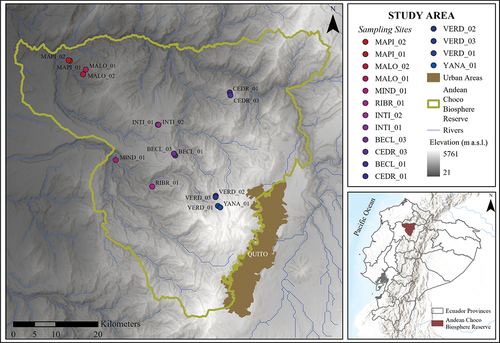
The plots were established in successional forests (Pain et al. Citation2021) that were selectively logged and burnt in the 1980s, defined as secondary forests (i.e. secondary forests sensu latto, given that no complete forest clearance has occurred in these plots). The plots were placed in forest fragments inside private reserves established in the 1980s where forest remnants have been recovering naturally since further human disturbance. By 2020, native forests covered nearly 68% (195,000 ha) of the study area and 12% (35,000 ha) corresponded to other native ecosystems (e.g. páramo and shrublands). The remaining 20% (57,000 ha) constitute pastures and agricultural land (Wiegant et al. Citation2020).
The plots were established in the middle of forest patches, which, based on Landsat 5 and 7 images, have grown from a patch size of 170.7 ± 154.4 ha (mean ± SD) in 1985 to 181.6 ± 158.3 ha (mean ± SD) by 2015. In the meantime, forest edge density was reduced from 65.1 ± 44.5 m ha−1 (mean ± SD) in 1985 to 59.8 ± 36.6 m ha−1 (mean ± SD) in 2015 (S1).
Estimations of AGC stocks and productivity
Tree censuses were conducted in 2015, 2017 and 2019. To estimate AGB, data were collected using standardised methods (Phillips et al. Citation2009; Pinto and Cuesta Citation2019). The diameter of every tree, palm, and tree fern with ≥5 cm of diameter at breast height (DBH), corresponding to 1.3 m of height, was measured and recorded, identified to the species level and tagged in 2015 and remeasured twice (Girardin et al. Citation2014). Tree total height (H) was estimated visually, and 10% of the population within each plot was randomly measured using clinometers (Suunto). These data were used to develop a tree H:DBH model at the plot level using the function model HD of the BIOMASS package in R (Réjou-Méchain et al. Citation2017). The generation of the H:DBH model serves two roles: (1) to avoid under- and over-estimations of tree height at lowlands and highlands, respectively, and (2) to homogenise AGB estimates along elevation gradients (Phillips et al. Citation2019). The function uses four models: two log-log polynomial models, a three-parameter Weibull model and the two-parameter Michaelis–Menten model (S2). The function with the lowest Residual Standard Error (RSE) and average bias was considered the best estimate for each respective plot (S2).
Carbon estimates were based on data integrated from all plots in the BIOMASS package (Réjou-Méchain et al. Citation2017). The BIOMASS package first corrects and uses the last validated taxonomic names and determines the wood density (WD) values per species using the getWoodDensity function, according to published WD datasets (Chave et al. Citation2006; Zanne et al. Citation2009). This function assigned WD values to each stem found in the plots. In cases where the WD value at the species level could not be assigned, the average value for the genus or family level was used. For stems without a taxonomic identification, the average WD value of all other stems found within the plot was used (Peña and Duque Citation2013). Finally, for AGB estimates at the individual and plot level, the BIOMASS package uses a pantropical forest allometric equation defined as (Chave et al. Citation2014). Tree values (kg) were summed to estimate the biomass at the plot level, which was then scaled the hectare level (Mg ha−1). To obtain AGC values, we multiplied the individual plot AGB value by a conversion constant of 0.456 that corresponds to wood C concentration estimated for pantropical forest species (Martin et al. Citation2018).
Three measures of productivity were used for this study. The AGC net change (AGCnc Mg ha−1 y−1) was calculated as the difference between the total AGC stocks in the last census (2019) and the total AGC stocks in the initial census (2015). This value was then divided by the elapsed period of 4 years (Duque et al. Citation2021). To estimate the AGC productivity (AGCp Mg ha−1 y−1) between 2015 and 2019, we considered the growth of living trees over 4 years, the growth of 2017 recruits over 2 years (2017–2019) and added AGC of the recruits at the time of the last census in 2019 (Phillips et al. Citation2019). To avoid overestimate the overall increase in AGC due to the inclusion of recruitment in 2019, we subtracted the AGC corresponding to a tree of 4.99 cm per recruit or individuals with DBH ≥5 cm; in this way, we considered only the increment over 5 cm as growth in recruits (e.g. for a recruit with 5.5 cm of DBH in the last census, only 0.50 cm was considered as growth; Talbot et al. (Citation2014)). The individual growth values were summed to obtain a per plot value of productivity, referred to as AGC growth of survivors and recruits. Values were then divided by the time interval between censuses and scaled to a per hectare value. AGC mortality (AGCk Mg ha−1 y−1) was calculated as the sum of the AGC contained in all individuals that died between censuses, divided by the time between censuses.
Climate and soil data
Two temperature sensors (TidbiT® v2 Temp Logger) were planted in each plot in 2015; one sensor was buried 10 cm below the ground surface (BG10 cm), and the other was positioned 10 cm above the ground surface (AG10 cm). A HOBO Pro v2 Temp/RH sensor was installed at 1 m above the ground surface to measure relative humidity as a complement to the temperature data; this sensor also provides an extra above-ground surface temperature record (AG1 m). From these sensors, we derived the following parameters, related to environmental filters that facilitate the assimilation of the nutrients in Andean forest species (Leuschner et al. Citation2007; Salinas et al. Citation2011): such as the minimum (minDT), mean (meanDT) and maximum (maxDT) daily temperatures, calculated across 2016–2020 (S3). Mean annual precipitation (AP) was extracted from the CHELSA bioclimatic datasets (Karger et al. Citation2017) at 30 arc second resolution (pixel size = 928 m × 921 m = 0.85 km2 at the equator).
Principal component analysis (PCA) was used to reduce the number of temperature variables to reduce the multicollinearity and better captures environmental variations along the elevational gradient (Báez et al. Citation2015). PCA summarises the nine temperature variables collected per plot along the transect, six above-ground temperatures at two different heights, three at 10 cm and three at 1 m and three at 10 cm below ground were used to derive temperature PCA axes (TEMPPCA1) (S3).
Soil pits of 1 m3 (1 m × 1 m × 1 m) were dug outside each plot, where soil horizons were identified and measured to determine the sampling depth along the gradient. Six soil samples were collected per plot within three of the nine subplots, at 16 and 32 cm depths, where the greatest amount of organic matter is concentrated (Zimmermann et al. Citation2010). The soil samples were collected using a soil borer, stored in hermetically sealed plastic bags to avoid moisture loss, and transported to the laboratory for processing. Soil samples were analysed for total C (%), N (%) and S (%) at the University of Amsterdam (UvA) using an Elementar-Organic Elemental Analysis. We collected undisturbed soil cores, using Kopecky rings (4 cm wide × 5 cm deep) in an area free of litter and fine woody debris to determine bulk density. Nine samples per plot were taken, one per subplot, and the soil that exceeded the upper and lower edges of the cylinders was carefully removed. Soil organic C (SOC) was determined as C content (Mg ha−1) = (ρ * h * C), where ρ is the bulk density of the soil measured in g cm−3, h is the depth at which the sample was taken (cm) and C is the percentage by weight of organic carbon in the soil (Hribljan et al. Citation2016).
Leaf functional traits
Mean-community leaf trait values weighted by basal area were estimated from the trait database (Llerena-Zambrano et al. Citation2021). The leaf functional traits (LFTs) database was updated in 2019 and 2020 with additional species information and linked to the ecological data associated with each plot. Specifically, the following LFTs were included: (1) leaf area (LA), (2) specific leaf area (SLA), (3) leaf blade thickness (LBT) and (4) leaf dry matter content (LDMC). Species were sampled considering the mass-ratio hypothesis (Grime Citation1998), i.e. we measured leaf traits for species that contributed 58–86% (mean ± SD = 76% ± 6.4%) of the total basal area of each plot (5–29 species per plot; S4). Overall, LFTs were determined for 125 tree species and then scaled to community level to generate community scores (Ackerly and Cornwell Citation2007).
Effects of disturbance on AGC stocks and productivity
Since the exact time of land use abandonment and thus the age was not known for our forest plots, possible successional stages were assessed using the framework of Coomes and Allen (Citation2007), in which a size-dependent mortality parameter β is used to describe how mortality of the community is related to DBH size by distinguishing three phases of forest development: (1) competitive thinning (i.e. early recovery after disturbance), (2) mature thinning and (3) mature forests. In the early stages of succession, mortality rates are mainly due to the death of small individuals and of fast-growing species. As forests mature, mortality rates become driven more by large adult individuals, i.e. the early-successional species that reached their maximum size and are being replaced by slower-growing species, and by random deaths (e.g. due to landslides) that create space and light gaps for recruits. To assess the effect of past human disturbances on C stocks and productivity, we used a size-dependent β in the General Linear Model (GLM) function, from the stats package in RStudio (RCoreTeam, Citation2016), with a binomial error structure (Coomes and Allen Citation2007). The β values reported derive from the logistic regression logit (pD) = a + bD, where pD is the probability of death and D is the initial stem size. Plots influenced by competitive thinning tend to have a small β, while plots more affected by the loss of large mature trees have a large β; finally, those influenced by mature thinning have intermediate values.
Data analyses
Forest composition and structure
We analysed patterns of tree community composition along the elevational gradient by constructing an abundance matrix for all tree species and plots for the last census. We used PRIMER 6 (Clarke and Gorley Citation2006) to create a between-plot Bray-Curtis similarity matrix as a similarity measure and performed a non-metric multidimensional scaling analysis [NMDS; Clarke and Gorley (Citation2006)]. Furthermore, we performed a hierarchical agglomerative cluster analysis using a group average linkage procedure. We assessed the significance of each group using the Similarity Profile routine, SIMPROF, which tests data against the null hypothesis of the absence of a structure (Clarke Citation1993). Lastly, we correlated the ordination matrix with environmental variables using Pearson’s correlation to address which variables contributed to the resulting groups (only correlations higher than 0.8 were included; collinear environmental variables were discarded).
To estimate tree SR while also accounting for differences along the elevational transect, we used observed SR and rarefied species richness [SRrarefied; Homeier et al. (Citation2010)]. We used the individual-based rarefaction method of Gotelli and Colwell (Citation2001), taking the number of species expected in a sample of 220 trees from a 3,600-m2 plot, where the value of 220 corresponds to the smallest number of trees found in any of the 16 plots. Subsequently, we performed bivariate linear regressions to assess SR and forest structure across the elevational gradient using JMP 8 (SAS Institute Inc. Citation2008) statistical software. Specifically, mean community tree height, DBH, the square root-transformed value of DBH (to provide equal representability to all diametric classes and reduce the biased effect of the largest and smallest tree diameters), mean community WD and mean community stem slenderness of trees with dbh >5 cm (ratio height:DBH) were quantified across the elevational gradient.
Above-ground carbon (AGC) stocks and productivity
We used simple bivariate linear regressions to relate individual environmental and ecological factors, as independent variables, to observed AGC stocks and productivity, as dependent variables, across the elevation gradient (S5). Independent variables included climate factors, community weighted mean for leaf functional traits (CWM_LFT), soil properties, SR and the β parameter. We tested four different metrics as dependent variables: (1) AGC stocks in the 2019 census (AGCfinal), (2) AGC net change in AGC stocks (AGCnc), (3) AGC productivity (AGCp) and (4) AGC mortality (AGCk) (, S6).
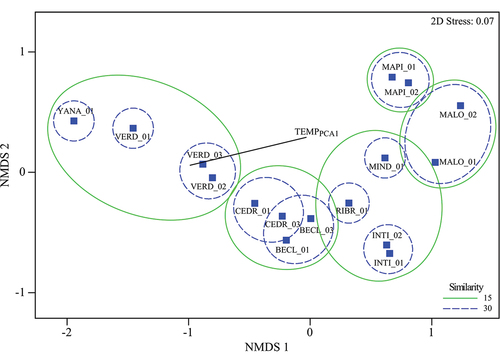
Figure 2. Non-metric multidimensional dimensional scaling analysis (NMDS) of 16 tree species assemblages (plots) along the Pichincha forest dynamics monitoring transect, Andean Choco Biosphere Reserve, Ecuador. The similarity distance used was that of Bray-Curtis with the abundance scores of the species (square-root transformed) as the main grouping criterion. The vector represents the Pearson correlation (> 0.8) of TEMPPCA1 with the first ordination axis (NMDS1). TEMPPCA1 equals the estimated air temperatures from dataloggers installed in each plot that integrates recorded mean, maximum and minimum temperatures. TEMPPCA1 has a 0.95 correlation with the first NMDS axis.
Subsequently, we built structural equation models (SEMs) to assess the relationship between ecological, environmental and disturbance factors on C stocks and their productivity along the gradient (van der Sande et al. Citation2017). The SEMs included climate, CWM_LFT, soil properties, SR and the β parameter as independent variables. We performed a series of pair-wise Spearman-correlation analyses to determine explanatory variables to be used in the SEMs: abiotic factors (temperature, precipitation, soil conditions, and disturbance parameter), and biotic factors (SR and CWM_LFT) (S7); AGC stocks and productivity metrics were described as endogenous variables (S8).
To determine significant sources of variation in AGC stocks and their dynamics across the gradient, we generated several SEMs to identify the most parsimonious model per AGC metric using SPSS AMOS 27 (Arbuckle Citation2006). The number of models for each AGC metric was related to the number of possible explanatory variables identified in the correlation analyses (S7). We selected the best model considering the Akaike information criterion (AIC) and the Root Mean Square Error (RMSE) together with the number of independent variables used per model (Grace Citation2006). Those with the lowest AIC, RMSE and smallest number of independent variables were considered the best models (S8).
Lastly, to assess the significant relationships of the total, direct and indirect effects among the endogenous and exogenous variables, we used a bootstrapping analysis to estimate the 95% confidence intervals (CI), of the selected AGC models (Duque et al. Citation2021). To assess the relative contribution of each group of variables to explaining variation in AGC stocks and productivity along the elevational gradient, we used estimates of the standardised coefficients in each path of the model and R2 for each of the AGC variable (S9-S12).
Results
Forest composition and structure
We measured 7,432 stems (DBH ≥5 cm) between 2015 and 2019, distributed across 82 families, 205 genera and 432 species; 90% of the stems were identified to species level, 7% to family or genus level, and 3% were unidentified. The most species-rich families were Lauraceae (32 spp.), Melastomataceae (31 spp.), Rubiaceae (29 spp.), Fabaceae (26 spp.), and Moraceae (26 spp.). Dussia lehmannii (632–2,492 m a.s.l.), Turpinia occidentalis (632–3,109 m a.s.l.), Critoniopsis occidentalis (1018–2932 m a.s.l.), Guarea kunthiana, Miconia clathrantha (653–3,109 m a.s.l.) and Miconia theaezans (1018–3109 m a.s.l.) were the most common species, present in at least in 50% of the plots across the transect. Forest composition gradually changed along the elevation gradient. The composition of the lowland forest (600–1,200 m a.s.l.) was dominated by Leguminosae (Inga), Moraceae, Rubiaceae, and Arecaceae, which gradually decreased as elevation increased and peaked between 1,000 and 1,200 m a.s.l. Above 2,000 m a.s.l., the composition consisted of species from the Lauraceae, Melastomataceae, and Rubiaceae families and tree ferns, such as Cyathea. Above 3,000 m elevation, vegetation was dominated by species from the Melastomataceae, Chloranthaceae, Primulaceae, Cyatheaceae, Actinidiaceae and Asteraceae families (S13).
The NMDS (stress: 0.07) segregated the forest plots into four groups along the elevation gradient (first ordination axis) – the low-elevation plots on the left-hand side of the diagram and the mid- to high-elevation plots, placed at the centre and on the right-hand side, respectively (). TEMPPCA1 was the main variable related to this distribution (R = −0.96; P ˂ 0.05). SR decreased as elevation increased (R2 adj= 0.75; P < 0.0001), at 800 m a.s.l., MALO_02, was the plot with the highest number of species (113 spp.), and at 3,500 m a.s.l., YANA_01, showed the lowest number (18 spp.) (). A similar negative trend was observed with mean daily temperature (R2 = 0.99; P < 0.0001) and mean annual precipitation (R2 = 0.69; P < 0.0001) (). We found the same pattern when using rarefied SR as the dependent variable, but the slopes were steeper than regression results for the observed SR ().
Table 1. Forest structure and climate of 16 permanent plots of 0.36 ha in size along an elevation gradient on the western versant of the Ecuadorian Andes, near Quito in the Andean Choco Biosphere Reserve.
Tree height across the gradient was 11.3 ± 1.7 m (mean ± SD), with the tallest trees present at lower elevations, 13.2 ± 6.6 m (mean ± SD), below 1,000 m a.s.l. (S2). Tree height significantly decreased as elevation increased () and the smallest trees, 9.6 ± 1.6 m (mean ± SD) were found above 2,900 m a.s.l. On average, trees had a higher height to DBH ratio in the lowest elevation plots. Across the elevation gradient, from 600 to 3,500 m a.s.l., the average height to DBH ratio (i.e. slenderness) per plot declined from 0.996 to 0.604 (). We found no trend in plot basal area, with values ranging between 6.9 and 12.1 m2 per 3,600 m2 or 19.1 and 33.5 m2 ha−1, respectively. The WD and DBH for all plots were 0.52 ± 0.1 g cm−3 (mean ± SD) and 13.87 ± 1.74 cm (mean ± SD), respectively. We did not observe significant differences along the elevation gradient for WD and DBH ().
Above-ground carbon (AGC) stocks and productivity
Mean AGC stock across the elevation gradient was 76.3 ± 24.4 Mg C ha−1 (mean ± SD) in 2015 and increased to 81.4 ± 26.0 Mg ha−1 (mean ± SD) in 2019, equivalent to a mean annual increase of 1.99 ± 0.99 Mg C ha−1 y−1 (mean ± SD) (, S6). AGC stocks declined significantly from 157.6 Mg C ha−1 at 800 m a.s.l. to 46.4 Mg C ha−1 at 3,500 m of elevation (, S6), following trends in temperature and precipitation ().
Figure 3. Relationships between above-ground carbon stocks and productivity with elevation, Pichincha forest dynamics monitoring transect, Andean Choco Biosphere Reserve, Ecuador. (A) above-ground carbon stock in 2015 (AGCinitial; Mg C ha−1), (B) above-ground carbon stock in 2019 (AGCfinal; Mg C ha−1), (C) above-ground carbon productivity (AGCp; Mg C ha−1 y−1), (D) above-ground carbon mortality (AGCk; Mg C ha−1 y−1), (E) above-ground carbon net change (AGCnc; Mg C ha−1 y−1). Solid lines represent bivariate relationships, and the elevation of each forest community (plot) is included in the figure as a colour gradient.
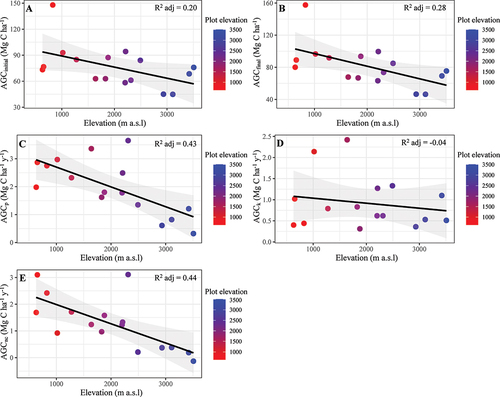
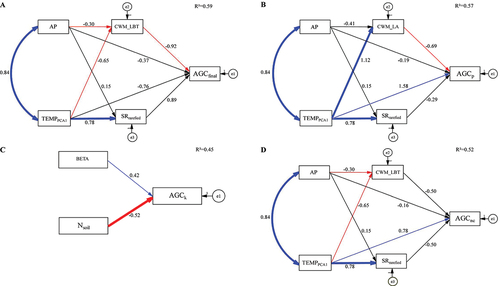
Figure 4. Structural equation models (SEMs) developed to evaluate the effects of climate (TEMPPCA1, and AP), rarefied species richness (SRrarefied), leaf blade thickness community weighted mean (CWM_LBT), leaf area community weighted mean (CWM_LA), nitrogen in soil (Nsoil) and the size-dependent probability of mortality (BETA) on above-ground carbon dynamics, Pichincha forest dynamics monitoring transect, Andean Choco Biosphere Reserve, Ecuador. (A) above-ground carbon stock in 2019 (AGCfinal; Mg C ha−1), (B) above-ground carbon productivity (AGCp; Mg C ha−1 y−1), (C) above-ground carbon mortality (AGCk; Mg C ha−1 y−1), (D) above-ground carbon net change (AGCnc; Mg C ha−1 y−1). The values over the arrows correspond to the linear coefficients of the predictor variables. Positive numbers and blue arrows represent significant positive relationships, negative numbers with red arrows determine significant negative relationships, and black arrows illustrate non-significant relationships between variables. Thick arrows indicate highly significant relationships (P ≤ 0.01); thin arrows indicate significant relationships (0.01 < P ≤ 0.05). R2 = coefficient of determination of the overall model.
Across all plots, the average net AGC change was 1.27 ± 0.99 Mg C ha−1 y−1 (mean ± SD) and AGC mortality was 0.92 ± 0.62 Mg C ha−1 y−1 (mean ± SD) (S6). AGC net change and AGC productivity covaried significantly with elevation. We found no elevation trend with AGC mortality (), but it was positively related to the β parameter (i.e. disturbance) (R2 adj. = 0.19; P = 0.049; ).
The SEM for AGC stock (AGCfinal) showed a direct negative relationship with community-weighted mean leaf thickness (CWM_LBT) and a positive indirect effect of TEMPPCA1 (P < 0.05) on AGC stocks (, S9). CWM_LBT was negatively related to temperature (TEMPPCA1) and annual precipitation (i.e. in wetter and warmer conditions tree communities were characterised by thinner leaves) (; S9). The SEM for AGC productivity (AGCp) showed that temperature (TEMPPCA1) had a strong positive effect on AGCp (, S10), indicating that plots under warmer conditions had a faster biomass accumulation. Forest productivity was negatively related to leaf area (CWM_LA), and both CWM_LA and SR were positively related to temperature. The selected SEM for AGC mortality showed a strong positive relationship with disturbance (β parameter) and a strong negative relationship with soil fertility (Nsoil), indicating that tree mortality increased on infertile soils and at high levels of recent disturbance (; S11). As with the AGCp model , AGC net change (AGCnc) was significantly related to temperature, but not to diversity or functional trait composition (, S12).
Discussion
Our objective was to assess the potential of secondary forests for sequestering C in the above-ground vegetation and identify how climate and forest composition (in terms of diversity, forest structure and community-mean leaf traits) are related to C stocks and sequestration along a 3,000-m elevational gradient. We found that composition (i.e. SR) and AGC stocks of 30- to 35-year-old forests were similar to that of mature Andean forests but with differences in some of the structural variables (i.e. basal area and tree height). Furthermore, AGC stocks and productivity were negatively related to tree community functional composition, and both AGCp and AGCnc were positively related to temperature. Tree mortality increased with an increase in competitive thinning (β parameter) and decreased with soil fertility (total N content). Moreover, AGC stocks and their annual increments along the elevation gradient were similar to patterns reported for mature Andean forests.
Changes in forest species composition and structure along elevation
We found that SR showed a hump-shaped relationship with elevation, with a peak between 800 and 1,200 m a.s.l. (), a trend that aligns with other studies in tropical montane forests (Lieberman et al. Citation1996; Homeier et al. Citation2010; Girardin et al. Citation2014; Malizia et al. Citation2020). Temperature decreases with elevation monotonically, while for SR a hump-shaped pattern curve is observed when temperature decreases. SR shows peak values between 19.7–20.7°C and a steady decline below 16°C, a temperature that coincides with the cloud immersion zone in our study area. Girardin et al. (Citation2014) have found a similar trend in six transects across the tropical Andes in Bolivia, Ecuador and Peru. They argued that the observed pattern emphasises the importance of cloud formation as a driver of species composition and turnover along elevation in tropical montane forests. The results of our NMDS portray a high turnover in species composition along our elevation gradient, indicating that most species are restricted to a small elevation range, suggesting strong environmental filtering and/or adaptation in forming tree communities along the elevation gradient. However, the conspicuous change in species composition could also be a legacy effect of past human disturbances or a combination of both. The peak of SR between 800 and 1,200 m a.s.l. may be attributed to a combination of factors, including the presence of Chocó lowland tree species reaching their upper distribution limits, as well as the presence of montane forest species.
Mean stand tree height and slenderness decreased with increasing elevation (). The small stature of the forests at elevations >2,000 m a.s.l. is related to decreasing temperatures combined with a reduced light incidence due to a persistent cloud cover and higher relative humidity that limit tree growth. The mechanisms underlying this relationship could be the trade-offs between tree growth vs. persistence, whereby tree communities adapt to harsher environmental conditions by limiting resource acquisitive strategies towards conserving resources at high elevations, as previously documented for our study area (Llerena-Zambrano et al. Citation2021) and other tropical montane forests (Girardin et al. Citation2010; Homeier and Leuschner Citation2021). Further, the negative relationship between tree height and elevation found in our study is similar to that found for mature tropical montane forests (Girardin et al. Citation2014; Homeier and Leuschner Citation2021). However, our tree height values are consistently lower than those reported for mature forest, particularly for plots between 600 and 1,500 m a.s.l., which is likely to be indicative of recovery from past human impacts; three-quarters of the trees ranged between 2.6–13 m in height, with only 8% of the trees larger than 20 m. We found a similar pattern for DBH class distribution; 75% of the 7,432 stems measured across the transect had a DBH under 16 cm, and only 5% had a DBH larger than 30 cm. The values of basal area in our study were lower, 26.0 ± 3.8 m2 ha−1 (mean ± SD), than the values reported for the mature montane forests of the Andes, 30.3 ± 16.7 m2 ha−1 (mean ± SD), over 236 plots (for trees >10 cm DBH) distributed along ca. 4,000 km of latitude from Venezuela to Argentina (Malizia et al. Citation2020). Likewise, in a recent study in mature montane forests of Africa, Cuni-Sanchez et al. (Citation2021) have reported a basal area of 39.0 ± 14.8 m2 ha−1 (mean ± SD), due to a high number of large trees, 19.1 ± 15.4 (mean ± SD) or trees whose DBH was >70 cm. Therefore, the distributions of tree size, tree-height classes, and basal area in our secondary forests are expected to require several decades to resemble those observed in mature Andean forests (Homeier et al. Citation2010; Spracklen and Righelato Citation2014), especially for canopy trees due to their slow turnover rate (Saldarriaga et al. Citation1988), contrary to what we expected.
Above-ground carbon (AGC) stocks
We found a 1.8-fold decline in AGC across the 3,000-m elevation gradient, a trend similar to that found in mature Andean forests (Moser et al. Citation2008; Girardin et al. Citation2010). Given that DBH, basal area and WD did not vary significantly with elevation, we suggest that this decline in AGC stocks is primarily attributable to changes in tree height (Feldpausch et al. Citation2012). The influence of low temperatures on tissue development, as new cell generation is acutely temperature sensitive (Körner Citation2003, Citation2015), might underlie this trend, suggesting a potential sink limitation. Conversely, Moser et al. (Citation2011) have argued that the significant decrease in tree height, AGB and annual productivity with elevation resulted from both below-ground shifts in carbon allocation and reduced carbon source strength due to a considerable reduction in leaf area and not of reduced photosynthetic activity. Therefore, temperature-induced reductions in carbon sink strength (linked to lowered meristematic activity) appeared to be of secondary importance. This shift in LFTs may provide insights into a potential mechanism for the heightened limitations in canopy carbon acquisition with increasing elevation (Homeier and Leuschner Citation2021). Nonetheless, further research is needed to comprehensively quantify the contribution of each sink and source limitation factors to the observed patterns.
Letcher and Chazdon (Citation2009) have reported a rapid early accumulation of AGC stocks in lowland secondary forests (≥2.5 cm DBH) and found larger mean ± SD AGC in intermediate-aged forests (>30 years; 108.3 ± 27 Mg C ha−1) compared to those in mature forest (76 ± 14.8 Mg C ha−1). They attributed this pattern to a higher density of stems in younger forests due to the weak effect of density-depended self-thinning regulating tree distributions and AGC stocks at the plot level. In our study, after four years, almost all our plots increased in stem density and decreased in average DBH, suggesting that a similar process may be occurring (). These findings suggest that even though our accumulated mean ± SD AGC values are large (81.4 ± 25.95 Mg C ha−1) and similar to those reported by Duque et al. (Citation2021) for mature forests across the Andes (77.17 ± 28.30 Mg C ha−1), tree DBH and tree-height class distributions still resemble secondary forests under a mature thinning process (sensu Coomes and Allen Citation2007).
Functional composition drives C stocks and productivity
We expected that along elevation, species with conservative trait values would become more abundant because increasing elevation and decreasing temperatures reduce metabolic rates by various mechanisms, such as altered leaf morphology, which in turn might lead to reduced C stocks and sequestration. Our SEM model showed that temperature was not directly related to AGC stocks, indicating that rather than directly constraining AGC, temperature is related to AGC indirectly by changing the functional composition (S9). Communities dominated by thick-leaved species had lower AGC stocks, which could be attributed to lower temperatures acting directly on leaf development or indirectly via lower soil nutrient availability at higher elevations (see also Kitayama and Aiba Citation2002) (). High CWM_LBT may result in low AGC due to different resource allocation patterns by tree species at different elevations. Tree species at high elevations allocate more resources to leaf tissue, investing an increased amount of photosynthates in structural components like additional cell layers and specialised tissues to enhance support and reduce water loss (Reich et al. Citation2003; Liu et al. Citation2020). Conversely, tree species at low elevations typically exhibit thinner and broader leaves and allocate a greater proportion of resources to the stem, which contributes to an increase in growth (Reich et al. Citation2003; Homeier and Leuschner Citation2021) and AGC levels. In addition, it is possible that small and tough leaves have a longer lifespan, withstand strong wind, and suffer less damage from intense radiation, a trade-off between persistence vs. growth, resulting in lower C stocks. Similar findings in the southern Andes of Ecuador suggest that temperature along the elevation gradient drives tree community assembly and ecosystem functioning indirectly through its effect on plant traits (Dantas de Paula et al. Citation2021), along with an indirect effect through soil nutrient dynamics on AGC stocks.
Our forest plots recorded an annual mean ± SD increment in AGCp of 1.99 ± 0.99 Mg C ha-1 y−1, larger than the productivity reported by Duque et al. (Citation2021) across the Andes (1.25 ± 0.82 Mg C ha−1 y−1), confirming our expectation of increased annual productivity in our secondary forests compared to the mature forests of the Andes. This also confirms the high potential of secondary forests to contribute to climate change mitigation via carbon sequestration during natural regeneration and their structure (and presumably their AGCp) will resemble those of mature forest.
We expected AGCp in our plots to be related to temperature, SR, and LFTs variations across the gradient as an effect of the dominance of fast-growing species with acquisitive strategies and also be more diverse in the lowlands, contrasting to the prevalence of slow-growing species with conservative acquisition strategies and particularly less diverse at high elevations. Mean ± SD AGCp in our transect (1.99 ± 0.99 Mg C ha−1 y−1) was negatively related to the community-weighted mean leaf area (CWM_LA) and positively and directly related to temperature. Moreover, temperature was positively related to CWM_LA, indicating that CWM_LA is greater for plots at high temperatures at low elevations, similar to that reported for the Amazon – Andes transect by van der Sande et al. (Citation2021). Hence, in line with the results obtained for AGC stocks, climate also appears to be indirectly related to AGC productivity through its effect on functional trait composition. Positive relationships between forest productivity and temperature have been documented for mature Andean forests (Girardin et al. Citation2010; Duque et al. Citation2021). However, perhaps these relationships are not direct but mediated by changes in functional composition. The negative relationship between AGCp and CWM_LA could be related to the observed peak of productivity in plots from the middle section of the transect (1,200–2,500 m a.s.l.), where dominant trees had smaller leaves compared to the average LA of the dominant species from the lower plots (600–1,200 m a.s.l.). The dominant species in the three most productive plots had a mean ± SD LA of 134.1 ± 104.7 cm2 and a mean ± SD increase of 3.10 ± 4.9 kg of C over 4 years. The large productivity of the dominant species of the middle section plots suggests that mid-successional species drive carbon allocation in their above-ground compartment due to recent past human disturbance, equalling or surpassing AGCp of forest communities from lower elevations (Lohbeck et al. Citation2015).
Species richness is not related to carbon dynamics
Contrary to our expectations, we found no significant relationship between tree SR and AGC stocks and productivity. Theoretical predictions suggest that greater SR should enhance community productivity due to complementary resource use and positive species interactions (Fei et al. Citation2018). However, the findings from our SEM model suggest that community-mean leaf traits, which are mostly determined by the most dominant species (the mass-ratio theory; Grime Citation1998), had a major effect on C dynamics in our studies forests. Large-scale studies in highly diverse lowland forests reported a robust positive effect of SR on AGC dynamics perhaps because a potential scale-related factor, suggesting that the significance of SR might be more pronounced when comparing forests across a broader spatial gradient with strong environmental contrast (Poorter et al. Citation2015, Citation2017). Additionally, it may be that the relationship between SR and ecosystem dynamics is more pronounced within mature forests, in contrast to disturbed forests where the effects are less consistent, possibly because higher diversity and structural complexity lead to greater complementarity (van der Sande et al. Citation2017). However, the number of studies providing a mechanistic explanation of AGC dynamics and biodiversity attributes for montane forests, particularly those in the Adean region, is limited. The standardisation of methods to measure and quantify the effect of SR at large and local scales, which not only consider environmental variation (e.g. elevation gradients) but successional stages, is required to elucidate the dynamic relationship between SR and ecosystem functioning, such as AGC dynamics in tropical forests. Additionally, the inclusion of new dimensions of diversity (e.g. phylogenetic diversity) could provide additional insights and complement our understanding of the underlying drivers that control ecosystem functioning in secondary forests (Maherali and Klironomos Citation2007; Cadotte et al. Citation2008).
Tree mortality increases with low soil fertility and disturbance history
We hypothesised that tree mortality would decrease along elevation due to a shift in plant strategies favouring persistence over growth due to harsher conditions at colder sites. Further, we expected that past human disturbances could alter this pattern by increasing mortality rates by competitive thinning, overriding the effect of environmental conditions. Our best SEM model indicated that soil fertility (total nitrogen) decreased and human disturbance (β parameter) increased tree mortality. We did not observe a significant effect of temperature on tree mortality. Instead, our results indicated that decreases in soil total N is the strongest factor associated with increased mortality rates (de Toledo et al. Citation2011), suggesting that less fertile soils may be associated with greater rates of tree deaths and shorter lifespan. This relationship was primarily driven by two plots with the highest mortality and productivity rates and the lowest soil N contents. In fact, Wolf et al. (Citation2011) have found evidence that in montane forests of southern Ecuador, forest productivity is limited by N. However, the low soil N contents of these plots could also be explained by disturbance legacies often overlooked in ecological studies (Sheil and Bongers Citation2020). The duration of N limitation in secondary forests might be short (Herbert et al. Citation2003) or last for decades (Markewitz et al. Citation2004), which seems to be the case at our study site. However, further studies are required to assess the relationship between nutrient effects and tree mortality, together with soil texture properties along the elevation gradient. The positive relationship of the size-dependent mortality, indicated by the β parameterand AGCk implies that plots underwent multiple mortality events followed by a pulse of tree recruitment (i.e. trees that reach 5 cm DBH), which is confirmed by a decrease in the mean tree size but a concomitant increase in stem density for most of the plots (). We observed the highest mortality rates among small trees (5–9.8 cm DBH) in the plots with the largest AGCnc, and a general high mortality of medium-sized (9.81–16.4 cm DBH) pioneer trees (i.e. low negative β values), or individuals that have probably reached their mature size and were dying, allowing recruitment of younger trees that presumably belong to a more advanced successional stage [i.e. secondary shade tolerant or slower-growing species; Coomes and Allen (Citation2007)]. This suggests that AGCk is influenced by medium-sized tree mortality and exhibits the highest rates in plots characterised by higher productivity (Ceballos et al. Citation2021), proposing that some of our plots may be in a competitive thinning phase, while others have reached a mature thinning phase.
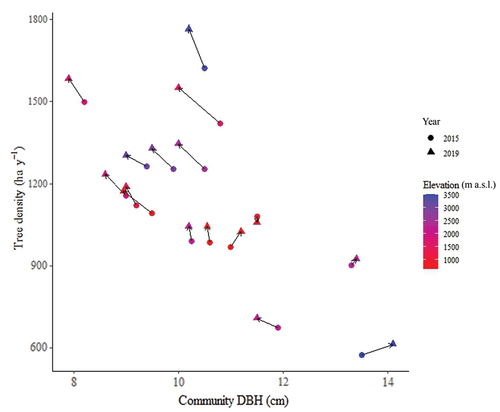
Figure 5. Change in stem density and mean community DBH for 16 permanent plots in an elapsed period of 4 years, Pichincha forest dynamics monitoring transect, Andean Choco Biosphere Reserve, Ecuador. Circles correspond to the census of 2015 and triangles to the census of 2019. The elevation of each forest community is included in the figure as a colour gradient (adapted from J. Ordoñez et al. unpublished).
For AGC net change, temperature was the main driver of C with a direct and positive effect (Piponiot et al. Citation2022). We found a direct negative relationship between temperature and mean annual precipitation, and community CWM_LBT and SR, which is in line with previous findings (Llerena-Zambrano et al. Citation2021), implying that as elevation increases and conditions become colder and drier (i.e. high UV and reduced relative humidity), species with thick leaves become more abundant probably because of their high tolerance to reduce water loss (van de Weg et al. Citation2009; Liu et al. Citation2013). However, the high mean ± SD AGCnc variability recorded in our plots (1.27 ± 0.99 Mg ha−1 y−1) results from a high dispersion of estimated productivity and mortality rates across our plots. The observed variability suggests that our plots along the monitoring transect represent different successional stages of the studied forests. Those plots under a competitive thinning stage – where tree species compete for limited resources such as light, water, or nutrients – had higher mortality rates, equalling 70% of the annual productivity, than those under a mature thinning stage. This divergence implies that substantial growth and biomass accumulation during the competitive thinning phase are counterbalanced by tree mortality, where less competitive trees struggle to survive while more competitive individuals persist. In contrast, during the mature thinning phase, characterised by more stabilised forest development, inter-tree competition is lesser with maturationdue to lower stand density, yielding lower mortality rates and equalling tree growth and mortality rates.
Conclusions
Our findings highlight the importance of tropical secondary montane forests as a primary nature-based solution for climate change mitigation because they store, on average, 81.4 ± 26.0 Mg C ha−1, as compared to 96 ± 37.4 Mg C ha−1 for old-growth secondary tropical rain forests (i.e. >20-year-old forest; Rozendaal et al. Citation2022). Temperature, leaf blade thickness, leaf area, soil fertility and disturbance legacy (competitive thinning) shape AGC stocks and productivity in these forests. Disentangling the effects of these factors is crucial for a better understanding of the ecological mechanisms that drive productivity in these ecosystems. However, contrary to our expectations, we found that SR had little effect on carbon dynamics in our forests.
Consequently, our findings also suggest that there is still much to learn about the role of other factors on C accumulation. Understanding the dynamics of C cycling and tree demography requires conducting more comprehensive and extended censuses. This approach is crucial for accurately assessing the successional patterns and developmental changes occurring within forests over extended periods. Along the same line, different biodiversity attributes could have complementary effects on C stocks and sequestration. More specifically, studying phylogenetic and functional diversity and its relationship with carbon storage and productivity rates can explain mechanistically community structure and species persistence. Lastly, given the importance of temperature in shaping community functional composition and C dynamics, preserving forest connectivity along elevation gradients constitutes a primary nature-based solution that can help maintain these forests as C sinks in light of a changing climate.
TPED-2022-0096.R3_SupplementaryMaterial_Pintoetal.docx
Download MS Word (1.4 MB)Acknowledgments
This study was carried out under permit No. N029-2019 IC-FLO-DNB/MA of the Ministry of Environment, Ecuador. We would like to express our gratitude to the owners and administrators of the private reserves where the forest dynamics permanent plots are established: Alejandro Solano, María Emilia Arcos and Oliver Torres from Mashpi Shungo and Pambiliño; Carolina Proaño-Castro, Felipe Andrade and Mateo Roldán from Mashpi Lodge/Fundación Futuro, Sonia Saltos from Río Bravo, Juan Diego Ortíz and Sol Acosta from Sacha Urcu, Inti Arcos and Nina Duarte from Intyllacta, Richard Parson and Favio Fernández from Bellavista Cloud Forest, Germán Toasa from El Cedral Ecolodge, María Elisa Vizuete and Enrique Maldonado from Verdecocha and the Jocotoco foundation from Yanacocha Reserve. We thank the Universidad de las Americas for financially supporting this research (Grant No. FGE.FCC.20.02) and the Andean Forest Program of the Swiss Agency for Development and Cooperation (Grant No. 81028631). We acknowledge the continuous support of Fundación Futuro to sustain and strengthen the long-term research plot network of the Pichincha Transect. Moreover, the above-ground productivity estimates derived from this research are currently being used by Fundación Futuro in their carbon compensation Program (https://nftree.com.ec/). MvdS was supported by the Veni research programme with project number VI.Veni.192.027, of the Netherlands Organization for Scientific Research (NWO) and by the European Research Council Advanced Grant PANTROP 834775.
Disclosure statement
No potential conflict of interest was reported by the author(s).
Supplemental data
Supplemental data for this article can be accessed online at https://doi.org/10.1080/17550874.2023.2274844
Additional information
Funding
References
- Ackerly DD, Cornwell WK. 2007. A trait-based approach to community assembly: partitioning of species trait values into within- and among-community components. Ecol Lett. 10(2):135–145. doi: 10.1111/j.1461-0248.2006.01006.x.
- Aide TM, Grau HR, Graesser J, Andrade-Nuñez MJ, Aráoz E, Barros AP, Campos-Cerqueira M, Chacon-Moreno E, Cuesta F, Espinoza R, et al. 2019. Woody vegetation dynamics in the tropical and subtropical Andes from 2001 to 2014: satellite image interpretation and expert validation. Glob Chang Biol. 25(6):2112–2126. doi:10.1111/gcb.14618.
- Arbuckle JL. 2006. [Computer Program]. 27.0. Chicago: SPSS.
- Armenteras D, Espelta JM, Rodríguez N, Retana J. 2017. Deforestation dynamics and drivers in different forest types in Latin America: three decades of studies (1980–2010). Glob Environ Chan. 46:139–147. doi: 10.1016/j.gloenvcha.2017.09.002.
- Artaxo P, Hansson HC, Machado LAT, Rizzo LV, Males J. 2022. Tropical forests are crucial in regulating the climate on Earth. PLOS Climate. 1(8):e0000054. doi: 10.1371/journal.pclm.0000054.
- AS Institute Inc. 2008. JMP® Version 8.0. Cary, NC: SAS Institute Inc.
- Báez S, Malizia A, Carilla J, Blundo C, Aguilar M, Aguirre N, Aquirre Z, Álvarez E, Cuesta F, Á D, et al. 2015. Large-scale patterns of turnover and basal area change in Andean forests. PloS One. 10(5):e0126594. doi:10.1371/journal.pone.0126594.
- Brienen RJW, Phillips OL, Feldpausch TR, Gloor E, Baker TR, Lloyd J, Lopez-Gonzalez G, Monteagudo-Mendoza A, Malhi Y, Lewis SL, et al. 2015. Long-term decline of the Amazon carbon sink. Nature. 519(7543):344–348. doi:10.1038/nature14283.
- Bruijnzeel, LA, Kappelle, M, Mulligan, M, Scatena, FN. 2010. Tropical montane cloud forests: state of knowledge and sustainability perspectives in a changing world. In: Scatena, FN, Bruijnzeel, LA, Hamilton, LS, editors. Tropical Montane Cloud Forests: Science for Conservation and Management. 1st ed. Cambridge, UK: Cambridge University Press; p. 691–740.
- Cadotte MW, Cardinale BJ, Oakley TH. 2008. Evolutionary history and the effect of biodiversity on plant productivity. Proc Natl Acad Sci USA. 105(44):17012–17017. doi: 10.1073/pnas.0805962105.
- Cardinale BJ, Matulich KL, Hooper DU, Byrnes JE, Duffy E, Gamfeldt L, Balvanera P, O’Connor MI, Gonzalez A. 2011. The functional role of producer diversity in ecosystems. Am J Bot. 98(3):572–592. doi: 10.3732/ajb.1000364.
- Ceballos SJ, Blundo C, Malizia A, Osinaga Acosta O, Carilla J. 2021. Dynamics of tree mortality in subtropical montane forests of Northwestern Argentina. For Ecol Manage. 497:119528. doi: 10.1016/j.foreco.2021.119528.
- Chave J, Condit R, Lao S, Caspersen J, Foster R, Hubbell S. 2003. Spatial and temporal variation of biomass in a tropical forest: results from a large census plot in Panama. J Ecol. 91(2):240–252. doi: 10.1046/j.1365-2745.2003.00757.x.
- Chave J, Muller-Landau H, Baker T, Easdale T, Steege HT, Webb CO. 2006. Regional and phylogenetic variation of wood density across 2456 neotropical tree species. Ecol Appl. 16(6):2356–2367. doi: 10.1890/1051-0761(2006)016[2356:RAPVOW]2.0.CO;2.
- Chave J, Réjou-Méchain M, Búrquez A, Chidumayo E, Colgan MS, Delitti, Elitti WBCD A, Eid T, Fearnside PM, Goodman RC, et al. 2014. Improved allometric models to estimate the aboveground biomass of tropical trees. Glob Chang Biol. 20(10):3177–3190. doi:10.1111/gcb.12629.
- Chazdon R. 2003. Tropical forest recovery: legacies of human impact and natural disturbances. Perspect Plant Ecol Evol Syst. 6(1–2):51–71. doi: 10.1078/1433-8319-00042.
- Chisholm RA, Muller-Landau HC, Abdul Rahman K, Bebber DP, Bin Y, Bohlman SA, Bourg NA, Brinks J, Bunyavejchewin S, Butt N, et al. 2013. Scale-dependent relationships between tree species richness and ecosystem function in forests. J Ecol. 101(5):1214–1224. doi:10.1111/1365-2745.12132.
- Christmann T, Palomeque X, Armenteras D, Wilson SJ, Malhi Y, Oliveras Menor I. 2023. Disrupted montane forest recovery hinders biodiversity conservation in the tropical Andes. Global Ecol Biogeogr. 32(5):793–808. doi: 10.1111/geb.13666.
- Clarke KR. 1993. Non-parametric multivariate analyses of changes in community structure. Aust J Ecol. 18(1):117–143. doi: 10.1111/j.1442-9993.1993.tb00438.x.
- Clarke KR, Gorley RN 2006. Primer v6: User Manual/Tutorial.
- Coomes DA, Allen RB. 2007. Mortality and tree‐size distributions in natural mixed‐age forests. J Ecol. 95(1):27–40. doi: 10.1111/j.1365-2745.2006.01179.x.
- Cuni-Sanchez A, Sullivan MJP, Platts PJ, Lewis SL, Marchant R, Imani G, Hubau W, Abiem I, Adhikari H, Albrecht T, et al. 2021. High aboveground carbon stock of African tropical montane forests. Nature. 596(7873):536–542. doi:10.1038/s41586-021-03728-4.
- Dantas de Paula M, Forrest M, Langan L, Bendix J, Homeier J, Velescu A, Wilcke W, Hickler T. 2021. Nutrient cycling drives plant community trait assembly and ecosystem functioning in a tropical mountain biodiversity hotspot. New Phytol. 232(2):551–566. doi: 10.1111/nph.17600.
- de Toledo JJ, Magnusson WE, Castilho CV, Nascimento HEM, de Toledo JJ. 2011. How much variation in tree mortality is predicted by soil and topography in Central Amazonia? For Ecol Manage. 262(3):331–338. doi: 10.1016/j.foreco.2011.03.039.
- Duque A, Peña MA, Cuesta F, González-Caro S, Kennedy P, Phillips OL, Calderón-Loor M, Blundo C, Carilla J, Cayola L, et al. 2021. Author correction: mature Andean forests as globally important carbon sinks and future carbon refuges. Nat Commun. 12(1): doi:10.1038/s41467-021-23955-7
- Fauset S, Johnson MO, Gloor M, Baker TR, A MM, Brienen RJW, Feldpausch TR, Lopez-Gonzalez G, Malhi Y, Ter Steege H, et al. 2015. Hyperdominance in Amazonian forest carbon cycling. Nat Commun. 6(1):6857. doi:10.1038/ncomms7857.
- Fehse J, Hofstede R, Aguirre A, Paladines C, Kooijman A, Sevink J. 2002. High altitude tropical secondary forests: a competitive carbon sink? For Ecol Manage. 163(1–3):9–25. doi: 10.1016/S0378-1127(01)00535-7.
- Fei S, Jo I, Guo Q, Wardle DA, Fang J, Chen A, Oswalt CM, Brockerhoff EG. 2018. Impacts of climate on the biodiversity-productivity relationship in natural forests. Nat Commun. 9(1):5436. doi: 10.1038/s41467-018-07880-w.
- Feldpausch TR, Lloyd J, Lewis SL, Brienen RJW, Gloor M, Mendoza AM, Lopez-Gonzalez G, Banin L, Salim KA, Affum-Baffoe K, et al. 2012. Tree height integrated into pantropical forest biomass estimates. Biogeosciences. 9(8):3381–3403. doi:10.5194/bg-9-3381-2012.
- Finegan B, Peña-Claros M, de Oliveira A, Ascarrunz N, Bret-Harte MS, Carreño-Rocabado G, Casanoves F, Díaz S, Eguiguren Velepucha P, Fernandez F, et al. 2015. Does functional trait diversity predict above-ground biomass and productivity of tropical forests? Testing three alternative hypotheses. J Ecol. 103(1):191–201. doi:10.1111/1365-2745.12346.
- Fyllas NM, Bentley LP, Shenkin A, Asner GP, Atkin OK, Díaz S, Enquist BJ, Farfan‐Rios W, Gloor E, Guerrieri R, et al. 2017. Solar radiation and functional traits explain the decline of forest primary productivity along a tropical elevation gradient. Ecol Lett. 20(6):730–740. doi:10.1111/ele.12771.
- Girardin CAJ, Farfan-Rios W, Garcia K, Feeley KJ, Jørgensen PM, Murakami AA, Pérez LC, Seidel R, Paniagua N, Claros AFF, et al. 2014. Spatial patterns of above-ground structure, biomass and composition in a network of six Andean elevation transects. Plant Ecol Divers. 7(1–2):161–171. doi:10.1080/17550874.2013.820806.
- Girardin CAJ, Malhi Y, Aragao LEOC, Mamani M, Huasco WH, Durand L, Feeley KJ, Rapp J, Silva-Espejo JE, Silman M, et al. 2010. Net primary productivity allocation and cycling of carbon along a tropical forest elevational transect in the Peruvian Andes. Glob Chang Biol. 16(12):3176–3192. doi:10.1111/j.1365-2486.2010.02235.x.
- Gotelli NJ, Colwell RK. 2001. Quantifying biodiversity: procedures and pitfalls in the measurement and comparison of species richness. Ecol Lett. 4(4):379–391. doi: 10.1046/j.1461-0248.2001.00230.x.
- Grace JB. 2006. Structural equation modeling and natural systems. Cambridge: Cambridge University Press.
- Grantham HS, Duncan A, Evans TD, Jones KR, Beyer HL, Schuster R, Walston J, Ray JC, Robinson JG, Callow M, et al. 2020. Anthropogenic modification of forests means only 40% of remaining forests have high ecosystem integrity. Nat Commun. 11(1):5978. doi:10.1038/s41467-020-19493-3.
- Grime JP. 1998. Benefits of plant diversity to ecosystems: immediate, filter and founder effects. J Ecol. 86(6):902–910. doi: 10.1046/j.1365-2745.1998.00306.x.
- Hérault B, Piponiot C. 2018. Key drivers of ecosystem recovery after disturbance in a neotropical forest. For Ecosyst. 5(1):2. doi: 10.1186/s40663-017-0126-7.
- Herbert DA, Williams M, Rastetter EB. 2003. A model analysis of N and P limitation on carbon accumulation in Amazonian secondary forest after alternate land-use abandonment. Biogeochemistry. 65(1):121–150. doi: 10.1023/A:1026020210887.
- Homeier J, Breckle SW, Günter S, Rollenbeck RT, Leuschner C. 2010. Tree diversity, forest structure and productivity along altitudinal and topographical gradients in a species-rich Ecuadorian montane rain forest. Biotropica. 42(2):140–148. doi: 10.1111/j.1744-7429.2009.00547.x.
- Homeier J, Leuschner C. 2021. Factors controlling the productivity of tropical Andean forests: climate and soil are more important than tree diversity. Biogeosciences. 18(4):1525–1541. doi: 10.5194/bg-18-1525-2021.
- Hooper DU, Chapin FS III, Ewel JJ, Hector A, Inchausti P, Lavorel S, Lawton JH, Lodge DM, Loreau M, Naeem S, et al. 2005. Effects of biodiversity on ecosystem functioning: a consensus of current knowledge. Ecol Monogr. 75(1):3–35. doi:10.1890/04-0922.
- Hribljan JA, Suárez E, Heckman KA, Lilleskov EA, Chimner RA. 2016. Peatland carbon stocks and accumulation rates in the Ecuadorian páramo. Wetlands Ecol Manage. 24(2):113–127. doi: 10.1007/s11273-016-9482-2.
- Hubau W, Lewis SL, Phillips OL, Affum-Baffoe K, Beeckman H, Cuní-Sanchez A, Daniels AK, Ewango CEN, Fauset S, Mukinzi JM, et al. 2020. Asynchronous carbon sink saturation in African and Amazonian tropical forests. Nature. 579(7797):80–87. doi:10.1038/s41586-020-2035-0.
- Jarvis A, Mulligan M. 2011. The climate of cloud forests. Hydrol Process. 25(3):327–343. doi: 10.1002/hyp.7847.
- Karger DN, Conrad O, Böhner J, Kawohl T, Kreft H, Soria-Auza RW, Zimmermann NE, Linder HP, Kessler M. 2017. Climatologies at high resolution for the earth’s land surface areas. Sci Data. 4(1):170122. doi: 10.1038/sdata.2017.122.
- Kitayama K, Aiba S-I. 2002. Ecosystem structure and productivity of tropical rain forests along altitudinal gradients with contrasting soil phosphorus pools on Mount Kinabalu, Borneo. J Ecol. 90(1):37–51. doi: 10.1046/j.0022-0477.2001.00634.x.
- Körner C. 2003. Carbon limitation in trees. J Ecol. 91(1):4–17. doi: 10.1046/j.1365-2745.2003.00742.x.
- Körner C. 2015. Paradigm shift in plant growth control. Curr Opin Plant Biol. 25:107–114. doi: 10.1016/j.pbi.2015.05.003.
- Letcher SG, Chazdon RL. 2009. Rapid recovery of biomass, species richness, and species composition in a forest chronosequence in Northeastern Costa Rica. Biotropica. 41(5):608–617. doi: 10.1111/j.1744-7429.2009.00517.x.
- Leuschner C, Moser G, Bertsch C, Röderstein M, Hertel D. 2007. Large altitudinal increase in tree root/shoot ratio in tropical mountain forests of Ecuador. Basic Appl Ecol. 8(3):219–230. doi: 10.1016/j.baae.2006.02.004.
- Lieberman D, Lieberman M, Peralta R, Hartshorn G. 1996. Tropical forest structure and composition on a large-scale altitudinal gradient in Costa Rica. J Ecol. 84(2):137. doi: 10.2307/2261350.
- Liu C, Wang X, Wu X, Dai S, He J-S, Yin W. 2013. Relative effects of phylogeny, biological characters and environments on leaf traits in shrub biomes across central Inner Mongolia, China. Journal of Plant Ecology. 6(3):220–231.
- Liu W, Zheng L, Qi D. 2020. Variation in leaf traits at different altitudes reflects the adaptive strategy of plants to environmental changes. Ecol Evol. 10(15):8166–8175. doi: 10.1002/ece3.6519.
- Llerena-Zambrano M, Ordoñez JC, Llambí LD, van der Sande MT, Pinto E, Salazar L, Cuesta F. 2021. Minimum temperature drives community leaf trait variation in secondary montane forests along a 3000-m elevation gradient in the tropical Andes. Plant Ecol Divers. 14(1–2):47–63. doi: 10.1080/17550874.2021.1903604.
- Lohbeck M, Poorter L, Martínez-Ramos M, Bongers F. 2015. Biomass is the main driver of changes in ecosystem process rates during tropical forest succession. Ecology. 96(5):1242–1252. eng. doi: 10.1890/14-0472.1.
- Luo Y-H, Cadotte MW, Burgess KS, Liu J, Tan S-L, Xu K, Li D-Z, Gao L-M. 2019. Forest community assembly is driven by different strata-dependent mechanisms along an elevational gradient. J Biogeogr. 46(10):2174–2187. doi: 10.1111/jbi.13669.
- Maherali H, Klironomos J. 2007. Influence of phylogeny on Fungal community assembly and ecosystem functioning. Sci (New York, NY). 316(5832):1746–1748. doi: 10.1126/science.1143082.
- Malhi Y. 2012. The productivity, metabolism and carbon cycle of tropical forest vegetation. J Ecol. 100(1):65–75. doi: 10.1111/j.1365-2745.2011.01916.x.
- Malhi Y, Grace J. 2000. Tropical forests and atmospheric carbon dioxide. Trends Ecol Evol. 15(8):332–337. doi: 10.1016/S0169-5347(00)01906-6.
- Malizia A, Blundo C, Carilla J, Osinaga Acosta O, Cuesta F, Duque A, Aguirre N, Aguirre Z, Ataroff M, Baez S, et al. 2020. Elevation and latitude drives structure and tree species composition in Andean forests: results from a large-scale plot network. PloS One. 15(4):e0231553. doi:10.1371/journal.pone.0231553.
- Marín-Spiotta E, Silver WL, Ostertag R. 2007. Long-term patterns in tropical reforestation: plant community composition and aboveground biomass accumulation. Ecol Appl. 17(3):828–839. doi: 10.1890/06-1268.
- Markewitz D, Davidson E, Moutinho P, Nepstad D. 2004. Nutrient loss and redistribution after forest clearing on a highly weathered soil in amazonia. Ecol Appl. 14(sp4):177–199. doi: 10.1890/01-6016.
- Martin AR, Doraisami M, Thomas SC. 2018. Global patterns in wood carbon concentration across the world’s trees and forests. Nat Geosci. 11(12):915–920. doi: 10.1038/s41561-018-0246-x.
- Mathez-Stiefel S-L, Peralvo M, Báez S, Rist S, Buytaert W, Cuesta F, Fadrique B, Feeley KJ, Groth AAP, Homeier J, et al. 2017. Research priorities for the conservation and sustainable governance of Andean forest landscapes. Mt Res Dev. 37(3):323–339, 317. doi:10.1659/MRD-JOURNAL-D-16-00093.1.
- Matsuo T, Martínez-Ramos M, Bongers F, van der Sande MT, Poorter L, van der Sande MT. 2021. Forest structure drives changes in light heterogeneity during tropical secondary forest succession. J Ecol. 109(8):2871–2884. doi: 10.1111/1365-2745.13680.
- Ministerio del Ambiente del Ecuador. 2012. Sistema de clasificación de los ecosistemas del Ecuador continental. In: Subsecretaría de Patrimonio Natural. Quito.
- Moser G, Leuschner C, Hertel D, Graefe S, Soethe§ N, Iost S. 2011. Elevation effects on the carbon budget of tropical mountain forests (S Ecuador): the role of the belowground compartment. Glob Chang Biol. 17(6):2211–2226. doi: 10.1111/j.1365-2486.2010.02367.x.
- Moser G, Röderstein M, Soethe N, Hertel D, Leuschner C. 2008. Altitudinal changes in stand structure and biomass allocation of tropical mountain forests in relation to microclimate and soil chemistry. In: Beck E, Bendix J, Kottke I, editors. Gradients in a tropical mountain ecosystem of Ecuador. Berlin, Heidelberg: Springer; pp. 229–242.
- N’Guessan AE, N’Dja JK, Yao ON, Amani BHK, Gouli RGZ, Piponiot C, Zo-Bi IC, Hérault B. 2019. Drivers of biomass recovery in a secondary forested landscape of West Africa. For Ecol Manage. 433:325–331. doi: 10.1016/j.foreco.2018.11.021.
- Ordoñez J, Cuesta F, Pinto E, Bernardi A Tree mortality and recruitment in secondary Andean tropical mountain forests along a 3000 m elevation gradient. Under revision. Under revision.
- Pain A, Marquardt K, Lindh A, Hasselquist NJ. 2021. What is secondary about secondary tropical forest? Rethinking forest landscapes. Hum Ecology. 49(3):239–247. doi: 10.1007/s10745-020-00203-y.
- Pan Y, Birdsey RA, Fang J, Houghton R, Kauppi PE, Kurz WA, Phillips OL, Shvidenko A, Lewis SL, Canadell JG, et al. 2011. A large and persistent carbon sink in the world’s forests. Sci. 333(6045):988–993. doi:10.1126/science.1201609.
- Peña MA, Duque A. 2013. Patterns of stocks of aboveground tree biomass, dynamics, and their determinants in secondary Andean forests. For Ecol Manage. 302:54–61. doi: 10.1016/j.foreco.2013.03.025.
- Phillips O, Baker T, Feldpausch T, Brienen R, Aymard G 2009. RAINFOR field manual for plot establishment and remeasurement.Pan-Amazonia.
- Phillips J, Ramirez S, Wayson C, Duque A. 2019. Differences in carbon stocks along an elevational gradient in tropical mountain forests of Colombia. Biotropica. 51(4):490–499. doi: 10.1111/btp.12675.
- Pinto E, Cuesta F. 2019. Monitoreo de Biodiversidad, Contenidos de Carbono, Productividad Y Rasgos Funcionales en Bosque Montanos. Protocolo. 8:103.
- Piponiot C, Anderson-Teixeira KJ, Davies SJ, Allen D, Bourg NA, Burslem DFRP, Cárdenas D, Chang-Yang C-H, Chuyong G, Cordell S, et al. 2022. Distribution of biomass dynamics in relation to tree size in forests across the world. New Phytol. 234(5):1664–1677. doi:10.1111/nph.17995.
- Poorter L, Bongers F. 2006. Leaf traits are good predictors of plant performance across 53 rain forest species. Ecology. 87(7):1733–1743. doi: 10.1890/0012-9658(2006)87[1733:LTAGPO]2.0.CO;2.
- Poorter L, Bongers F, Aide TM, Almeyda Zambrano A, Balvanera P, Becknell J, Boukili V, Brancalion P, Broadbent E, Chazdon R, et al. 2016. Biomass resilience of neotropical secondary forests. Nature. 530(7589):211–214. doi:10.1038/nature16512.
- Poorter L, Craven D, Jakovac CC, van der Sande MT, Amissah L, Bongers F, Chazdon RL, Farrior CE, Kambach S, Meave JA, et al. 2021. Multidimensional tropical forest recovery. Sci. 374(6573):1370–1376. doi:10.1126/science.abh3629.
- Poorter L, Rozendaal DMA, Bongers F, dJs A, Álvarez FS, Andrade JL, Arreola Villa LF, Becknell JM, Bhaskar R, Boukili V, et al. 2021. Functional recovery of secondary tropical forests. Proc Natl Acad Sci USA. 118(49):e2003405118. doi:10.1073/pnas.2003405118.
- Poorter L, van der Sande MT, Arets EJMM, Ascarrunz N, Enquist BJ, Finegan B, Licona JC, Martínez-Ramos M, Mazzei L, Meave JA, et al. 2017. Biodiversity and climate determine the functioning of neotropical forests. Global Ecol Biogeogr. 26(12):1423–1434. doi:10.1111/geb.12668.
- Poorter L, van der Sande MT, Thompson J, Arets EJMM, Alarcón A, Álvarez-Sánchez J, Ascarrunz N, Balvanera P, Barajas-Guzmán G, Boit A, et al. 2015. Diversity enhances carbon storage in tropical forests. Global Ecol Biogeogr. 24(11):1314–1328. doi:10.1111/geb.12364.
- Prado-Junior JA, Schiavini I, Vale VS, Arantes CS, van der Sande MT, Lohbeck M, Poorter L, Nardoto GB. 2016. Conservative species drive biomass productivity in tropical dry forests. J Ecol. 104(3):817–827. doi: 10.1111/1365-2745.12543.
- RCoreTeam. 2016. R: a language and environment for statistical computing. Vienna, Austria: R Foundation for Statistical Computing.
- Reich PB, Wright IJ, Cavender‐Bares J, Craine JM, Oleksyn J, Westoby M, Walters MB. 2003. The evolution of plant functional variation: traits, spectra, and strategies. Int J Plant Sci. 164(S3):S143–S164. doi: 10.1086/374368.
- Réjou-Méchain M, Tanguy A, Piponiot C, Chave J, Hérault B, Goslee S. 2017. BIOMASS: an R package for estimating above-ground biomass and its uncertainty in tropical forests. Methods Ecol Evol. 8(9):1163–1167. doi: 10.1111/2041-210X.12753.
- Requena Suarez D, Rozendaal DMA, De Sy V, Phillips OL, Alvarez-Dávila E, Anderson-Teixeira K, Araujo-Murakami A, Arroyo L, Baker TR, Bongers F, et al. 2019. Estimating aboveground net biomass change for tropical and subtropical forests: refinement of IPCC default rates using forest plot data. Glob Chang Biol. 25(11):3609–3624. doi:10.1111/gcb.14767.
- Román-Cuesta RM, Salinas N, Asbjornsen H, Oliveras I, Huaman V, Gutiérrez Y, Puelles L, Kala J, Yabar D, Rojas M, et al. 2011. Implications of fires on carbon budgets in Andean cloud montane forest: the importance of peat soils and tree resprouting. For Ecol Manage. 261(11):1987–1997. doi:10.1016/j.foreco.2011.02.025.
- Rozendaal DMA, Requena Suarez D, De Sy V, Avitabile V, Carter S, Adou Yao CY, Alvarez-Davila E, Anderson-Teixeira K, Araujo-Murakami A, Arroyo L, et al. 2022. Aboveground forest biomass varies across continents, ecological zones and successional stages: refined IPCC default values for tropical and subtropical forests. Environ Res Lett. 17(1):014047. doi:10.1088/1748-9326/ac45b3.
- Rutishauser E, Hérault B, Baraloto C, Blanc L, Descroix L, Sotta ED, Ferreira J, Kanashiro M, Mazzei L, d’Oliveira MVN, et al. 2015. Rapid tree carbon stock recovery in managed Amazonian forests. Curr Biol. 25(18):R787–R788. doi:10.1016/j.cub.2015.07.034.
- Saldarriaga JG, West DC, Tharp ML, Uhl C. 1988. Long-term chronosequence of forest succession in the upper Rio Negro of Colombia and Venezuela. J Ecol. 76(4):938–958. doi: 10.2307/2260625.
- Salinas N, Malhi Y, Meir P, Silman M, Roman Cuesta R, Huaman J, Salinas D, Huaman V, Gibaja A, Mamani M, et al. 2011. The sensitivity of tropical leaf litter decomposition to temperature: results from a large-scale leaf translocation experiment along an elevation gradient in Peruvian forests. New Phytol. 189(4):967–977. doi:10.1111/j.1469-8137.2010.03521.x.
- Schnitzer SA, Klironomos JN, HilleRislambers J, Kinkel LL, Reich PB, Xiao K, Rillig MC, Sikes BA, Callaway RM, Mangan SA, et al. 2011. Soil microbes drive the classic plant diversity–productivity pattern. Ecology. 92(2):296–303. doi:10.1890/10-0773.1.
- Sheil D, Bongers F. 2020. Interpreting forest diversity-productivity relationships: volume values, disturbance histories and alternative inferences. For Ecosyst. 7(1):6. doi: 10.1186/s40663-020-0215-x.
- Spracklen DV, Righelato R. 2014. Tropical montane forests are a larger than expected global carbon store. Biogeosciences. 11(10):2741–2754. doi: 10.5194/bg-11-2741-2014.
- Spracklen DV, Righelato R. 2016. Carbon storage and sequestration of re-growing montane forests in southern Ecuador. For Ecol Manage. 364:139–144. doi: 10.1016/j.foreco.2016.01.001.
- Sullivan MJP, Lewis SL, Affum-Baffoe K, Castilho C, Costa F, Sanchez AC, Ewango CEN, Hubau W, Marimon B, Monteagudo-Mendoza A, et al. 2020. Long-term thermal sensitivity of Earth’s tropical forests. Sci. 368(6493):869–874. doi:10.1126/science.aaw7578.
- Sullivan MJP, Talbot J, Lewis SL, Phillips OL, Qie L, Begne SK, Chave J, Cuni-Sanchez A, Hubau W, Lopez-Gonzalez G, et al. 2017. Diversity and carbon storage across the tropical forest biome. Sci Rep. 7(1):39102. doi:10.1038/srep39102.
- Talbot J, Lewis SL, Lopez-Gonzalez G, Brienen RJW, Monteagudo A, Baker TR, Feldpausch TR, Malhi Y, Vanderwel M, Araujo Murakami A, et al. 2014. Methods to estimate aboveground wood productivity from long-term forest inventory plots. For Ecol Manage. 320:30–38. doi: 10.1016/j.foreco.2014.02.021.
- Tilman D, Reich PB, Knops J, Wedin D, Mielke T, Lehman C. 2001. Diversity and productivity in a long-term grassland experiment. Sci. 294(5543):843–845. doi: 10.1126/science.1060391.
- Townsend AR, Cleveland CC, Houlton BZ, Alden CB, White JW. 2011. Multi-element regulation of the tropical forest carbon cycle. Front Ecol Environ. 9(1):9–17. doi: 10.1890/100047.
- van der Sande MT, Bush MB, Urrego DH, Silman M, Farfan-Rios W, García Cabrera K, Shenkin A, Malhi Y, McMichael CH, Gosling W, et al. 2021. Modern pollen rain predicts shifts in plant trait composition but not plant diversity along the Andes–Amazon elevational gradient. J Vegetation Sci. 32(1):e12925. doi: 10.1111/jvs.12925.
- van der Sande MT, Peña-Claros M, Ascarrunz N, EJMM A, Licona JC, Toledo M, Poorter L. 2017. Abiotic and biotic drivers of biomass change in a neotropical forest. J Ecol. 105(5):1223–1234. doi: 10.1111/1365-2745.12756.
- van der Sande MT, Poorter L, Kooistra L, Balvanera P, Thonicke K, Thompson J, Arets EJMM, EJMM A, Jones L, Mora F, et al. 2017. Biodiversity in species, traits, and structure determines carbon stocks and uptake in tropical forests. Biotropica. 49(5):593–603. doi:10.1111/btp.12453.
- van de Weg MJ, Meir P, Grace J, Atkin OK, van de Weg MJ. 2009. Altitudinal variation in leaf mass per unit area, leaf tissue density and foliar nitrogen and phosphorus content along an Amazon-Andes gradient in Peru. Plant Ecol Divers. 2(3):243–254. doi: 10.1080/17550870903518045.
- van Manen ML T, Jansen B, Cuesta F, León-Yánez S, Gosling WD. 2019. Leaf wax n-alkane patterns of six tropical montane tree species show species-specific environmental response. Ecol Evol. 9(16):9120–9128. doi: 10.1002/ece3.5458.
- Wiegant D, Peralvo M, van Oel P, Dewulf A. 2020. Five scale challenges in Ecuadorian forest and landscape restoration governance. Land Use Policy. 96:104686. doi: 10.1016/j.landusepol.2020.104686.
- Wirth C, Messier C, Bergeron Y, Frank D, Fankhänel A. 2009. Old-growth forest definitions: a Pragmatic View. In: Wirth C, Gleixner G Heimann M, editors Old-growth forests: function, fate and value. Berlin, Heidelberg: Springer; pp. 11–33.
- Wolf K, Veldkamp E, Homeier J, Martinson GO. 2011. Nitrogen availability links forest productivity, soil nitrous oxide and nitric oxide fluxes of a tropical montane forest in southern Ecuador. Global Biogeochem Cycles. 25(4). GB4009. doi: 10.1029/2010GB003876.
- Zanne AE, Lopez-Gonzalez G, Coomes DA, Ilic J, Jansen S, Lewis SL, Miller RB, Swenson NG, Wiemann MC, Chave J. 2009. Data from: towards a worldwide wood economics spectrum. Dryad Digital Repository. doi: 10.5061/dryad.234.
- Zimmermann M, Meir P, Silman M, Fedders A, Gibbon A, Malhi Y, Urrego D, Bush M, Feeley K, Garcia K, et al. 2010. No differences in soil carbon stocks across the tree line in the Peruvian Andes. Ecosystems. 13(1):62–74. doi:10.1007/s10021-009-9300-2.