
 ?Mathematical formulae have been encoded as MathML and are displayed in this HTML version using MathJax in order to improve their display. Uncheck the box to turn MathJax off. This feature requires Javascript. Click on a formula to zoom.
ABSTRACT
Cyclone Hudhud originated in the Andaman Sea on 6 October 2014. Later, it intensified into a cyclonic storm on 8 October and eventually made landfall at Visakhapatnam on 12 October as a very severe cyclonic storm. It was intensified off of Visakhapatnam by high stratified waters with a thick barrier layer that held significant heat content. In this study, we analysed the data along the cyclone track using a combination of satellite, in-situ Argo and Bio-Argo data to assess the upper oceanic changes along the Hudhud track. Notable changes were detected in the upper ocean due to its extreme intensification and prior passage through cold-core eddies. A high translation speed and persistent stratification dominated the effects caused by the cold-core eddies on the intensification of the cyclone and the same was attributed to the upwelled subsurface chlorophyll maxima. The biophysical changes in the top 150 m layer derived from Argo floats were in good agreement with the satellite and model data. Further, it was observed that the increase in lightning flash rates also influenced surface productivity during the cyclone. Subsequent to the passage of the cyclone, the ocean took two weeks to achieve its original state.
1. Introduction
Tropical cyclones are known for causing devastation and are one of the most destructive phenomena on earth (Keim et al. Citation2007). The North Indian Ocean (NIO) that includes the Arabian Sea and Bay of Bengal (BOB) is one of the favourable regions for the formation of strong tropical cyclones (Bhaskar Rao and Prasad Citation2007). Previous studies have reported that the BOB cyclone intensities are increasing and they suggest that there are significant changes in the upper ocean and associated biophysical responses (Singh Citation2010; Geetha and Balachandran Citation2014; Holland and Bruyère Citation2014). Cyclones mainly occur over the BOB in the months of April–May and October–November and they intensify as severe cyclonic storms. Classification of Low pressure systems in the Indian Ocean as per India Meteorological Department (IMD) is mentioned in the data and methods section for the ready reference. Tropical cyclone Hudhud formed as a depression in the Andaman Sea, strengthened over central BOB, and became an extremely severe cyclone before its landfall at Visakhapatnam. Due to its extreme conditions, this severe cyclone significantly modified the ocean conditions along its track as well as the surroundings. It is important to understand the influence over the ocean and atmosphere during the different stages of a storm (i.e. at deepening, pre-deepening and post-deepening). Several studies have explained the ocean’s response due to cyclone activity in the upper ocean but they are mainly restricted to the surface layer (Lin et al. Citation2003; Babin et al. Citation2004; Shi and Wang Citation2007; Liu et al. Citation2009; Hung and Gong Citation2011). The freshwater influx in the monsoon season develops high stratification and strong barrier layers over the BOB, which is conducive for the formation and intensification of severe cyclones during the post-monsoon season (Balaguru et al. Citation2012; Vissa et al. Citation2013). This barrier layer is primarily controlled by the isothermal and mixed layers (Girish Kumar et al. Citation2011). The semi-annual peak in the barrier layer is observed in the central BOB during August–September, and the thick barrier layer is confined to east Bay during June and extends upto central Bay during November-December (Pankajakshan et al. Citation2002).
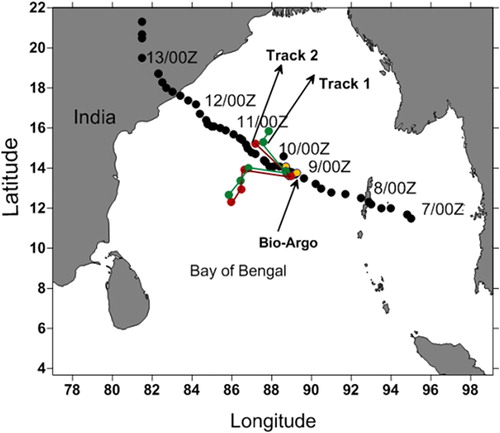
It is difficult to obtain conventional observations over the ocean and during the intensification of the storm we were restricted to depending on space-based satellite observations. These observations provided us with very useful information on oceanic surface parameters related to pre-and post-cyclonic conditions (Goni et al. Citation2009). Subsurface moorings like the Argo and buoys also provide valuable information of the entire oceanic layer up to 2000 min depth. Even though the Argo delivers useful information of the subsurface data in fair weather conditions, few of them can withstand extreme weather conditions. The floats that can endure severe weather conditions provide very valuable data on the ocean vertical structure (Maneesha et al. Citation2012; Chacko Citation2017). The number of Argo floats over the BOB are limited, and recently, there have been additional deployments of Bio-Argo floats in the area. The combination of these observations allowed us to collect data during the various stages of the Hudhud and facilitated the investigation of biogeochemical changes in the water column in real-time. Though the Argo floats are sparse in the BOB as compared to other regions, it was observed that one of the Bio-Argo floats (yellow dots) ( ID: 2902114) was located on the track and the movement of this float is almost along the passage of cyclone from 20 September 2014 to 30 October 2014. Few Argo floats (red and green dots) were located around the Hudhud’s passage. The Hudhud formed as a low-pressure system over the North Andaman Sea on 6 October 2014 and passed along the Andaman Islands. Moving further in a west-north-west direction, it became a severe cyclonic storm on 9 October, and further intensified into very severe cyclonic storm in 24 h. On 12 October 2014, it crossed the densely populated city of Visakhapatnam, which is located on the east coast. Due to its intensification and passage through urban areas, the Hudhud caused significant damage to infrastructure and resulted in human losses (https://ndma.gov.in). Apart from the changes that occurred on land regions, there have been significant changes observed over the ocean. For instance, tropical cyclones alter the dynamics of the water while at the same time impacting the biology of the water column (Narvekar and Prasanna Kumar Citation2014; Kay et al. Citation2018). Additionally, strong winds associated with the cyclone break the stratification and mix the water column thoroughly from below up to the thermocline, leading to permanent mixing and pumping of cold water to the surface (Jansen et al. Citation2010). Depending on the strength of a storm (Lin et al. Citation2003; Hanshaw et al. Citation2008; Lin Citation2012; Foltz et al. Citation2015), these cold nutrient-rich waters are brought to the surface layer (euphotic zone) and are utilised by phytoplankton, which ultimately enhances primary production (Eppley and Renger Citation1988; Marra et al. Citation1990; Dickey et al. Citation1998). Lin et al. (Citation2003) reported that it is very difficult to accurately estimate the enrichment of primary production induced by cyclones, and therefore, this needs to be assessed more preciously. The strongest upwelling that takes place at the centre of a storm leads to massive entrainment with slow translation speeds (Lin et al. Citation2003; Shi and Wang Citation2007), and also, the relative productivity may also depend on the thickness of the barrier layer itself (Mackey et al. Citation1997), which is non-uniform and this barrier layer will be eroded by the upwelling and the mixing caused by the cyclone winds. It has been observed and reported that chlorophyll biomass and productivity changes are associated with the changes in the barrier layer thickness. For example, during the period April 27-May 3, the cyclone Nargis formed over the BOB, and one of the Research Moored Array for African-Asian-Australian Monsoon Analysis (RAMA) floats captured the thin barrier layer (McPhaden et al. Citation2009). Few studies are available on the impacts on the barrier layer in relation to productivity during post-cyclone conditions. The intensity of the biomass varies with the presence of meso-scale features of a storm along the cyclone track. There are several studies on the intensity changes of cyclones bypassing through meso-scale feature like warm and cold-core eddies (Hong et al. Citation2000; Shay et al. Citation2000; Goni and Trinanes Citation2003; Lin et al. Citation2005; Ali et al. Citation2007; Sadhuram et al. Citation2011; Walker et al. Citation2014; Chacko Citation2017). The warm/cold-core eddy positively/negatively contributes to the cyclone intensification/weakening as well as the decrease/increase in the productivity rate. The pre-existing cold-core eddy along the cyclone track lifts the isotherms before the arrival of the cyclone, leading to low temperatures and high nutrients compared to normal conditions (no eddy). After the arrival of a cyclone with low translation speeds, these nutrients are uplifted, which significantly promotes high production (Falkowski et al. Citation1991; Sweeney et al. Citation2003; Walker et al. Citation2005; Nencioli et al. Citation2008; Liu et al. Citation2009). Recently, Chacko (Citation2017) reported on the rise in chlorophyll during the Hudhud cyclone. In the present study, we investigate the biophysical responses of the upper ocean during pre-and post-cyclone conditions, with special emphasis on the variations in the barrier layer, heat content and the suppressed effect of cold-core eddies on tropical cyclone Hudhud that formed over the BOB. The following Section 2 describes the data and method used, Section 3 provides the major findings, and Section 4 presents the summary and conclusions of this study.
Figure 1. The Hudhud cyclone track and Argo sections across the cyclone track before (green line Track 1) and after (red line Track 2) the passage of the cyclone. Red and green dots represent Argo floats and yellow dots represent starting and ending positions (right to left) of the Bio-Argo float.
2. Data and methods
As per the India Meteorological Department (IMD), the classification of the low-pressure systems is as follows:
The Argo and Bio-Argo floats located over the BOB that are nearer to the Hudhud track were considered for this analysis. shows the Hudhud observed track and the location of the Argo floats (green, red dots and yellow). The Bio-Argo data was taken from Argo float with ID-2902114 at 9 locations 89.27E, 13.75N; 89.18E, 13.725N; 89.066E, 13.639N; 88.966E, 13.617N; 88.87E, 13.598N; 88.802, 13.681N; 88.751E, 13.733N; 88.728, 13.854N; 88.716E, 14.083N respectively from 9 September to 10 October 2014. Green dots represents the Argo floats with ID’s-2901629, 71217, 122773, 2902114, 135044, 7690 at locations 85.84E, 12.68N; 86.425E, 13.389N; 86.822E, 13.986N; 88.966E, 13.617N; 87.559E, 15.282N; 87.865E, 15.898N respectively before the occurrence of cyclone i.e. during 25–30 September 2014. Red dots represent the Argo floats with ID’s-2901629, 71217, 122773, 2902114, 135044 at locations 85.977E, 12.31N; 86.49E,12.961N; 86.649E, 13.911N; 88.728E, 13.854N; 87.165E, 15.205N respectively. Though the Argo floats are Legrangian type, the temperature and salinity data were collected at particular locations along the Hudhud track where ever useful/necessary. The Argo and Bio-Argo data were obtained from the Coriolis Argo data centre. The temperature and density data were interpolated to every 1 m using spline interpolation and computed the mixed layer depth (MLD) and barrier.
Sea surface temperature (SST) above 26–27°C is necessary for the formation of tropical cyclones (Palmen Citation1948; Gray Citation1968), and the same plays a major role in determining the tropical cyclone heat potential (TCHP) (Leiper and Volgenau Citation1972; Shay et al. Citation2000; Wada and Usui Citation2007). The TCHP is the integrated heat content from the surface to the 26°C isotherm and is computed from the vertical profile using the following method (Leiper and Volgenau Citation1972):(1)
(1) in which ρ is the density of the water column above the 26°C isotherm, CP is the specific heat of seawater at constant pressure;
is the average temperature of two consecutive layers of a depth increment dZ, and D26 is the depth of the 26°C isotherm.
Stratification was computed using the equation:(2)
(2) where N is the Brunt-Väisälä frequency
where ρ is the density, dρ/dZ is the density gradient, and No is the reference buoyancy frequency, 3 cph (Shay and Brewster Citation2011).
The near real-time TCHP can be estimated from the sea surface height anomaly (SSHA) and is very useful in forecasting cyclone intensity (Goni and Trinanes Citation2003). The operational altimeter derived analysis of TCHP is available at the National Oceanic and Atmospheric Administration (NOAA) National Hurricane Center. Recent studies have also shown that cyclones are intensifying over a thick barrier layer, which holds high heat content due to a lack of entrainment (McPhaden et al. Citation2009; Balaguru et al. Citation2012; Vissa et al. Citation2013). Thick barrier layers were observed in the BOB due to high fresh water discharge or precipitation (Pankajakshan et al. Citation2007).
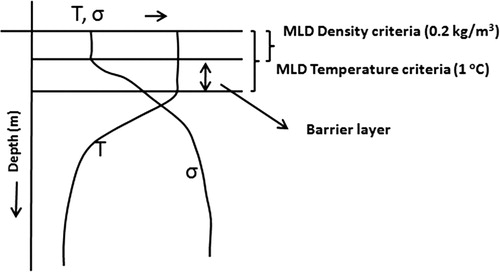
depicts the schematic representation of the barrier layer. In this study, greater emphasis has been placed on the TCHP and the barrier layer since they play major roles in the intensification of cyclones over the BOB (Goni and Trinanes Citation2003; Balaguru et al. Citation2012).
Figure 2. Schematic representation of the barrier layer.
The isopycnal displacement due to the upwelling at the centre of the cyclone is computed using the following formula (Price et al. Citation1994; Babin et al. Citation2004):(3)
(3) where
is wind stress, ρo is the density of seawater, f is Coriolis parameter, and Uh is the cyclone translation speed.
The winds data was retrieved from the Advanced Scatterometer (ASCAT) (http://apdrc.soest.hawaii.edu/). The SST and chlorophyll data sets were obtained from the Moderate Resolution Imaging Spectroradiometer (MODIS) and merged satellite data from the Copernicus Marine data centre. Geostrophic currents data has been retrieved from CMEMS NRT satellite Geostrophic Surface Currents (Rio et al. Citation2014). In-situ weekly average ocean data (Sea Surface Salinity (satellite-derived), Temperature, Salinity profiles up to 200 m) was taken from Armor3D (http://marine.copernicus.eu/), and lightning data was obtained from the World Wide Lightning Location Network (www.wwlln.net). Satellite dataset products were collected at the locations of Bio-Argo (which were mentioned above) on the same date for comparison.
3. Results and discussions
Observed upper oceanic changes in the central and western parts of the BOB due to cyclone Hudhud were analysed using both Argo and satellite datasets. As depicted in , the Argo data was extracted in two sections across the track and both were very similar. The cross-section during pre-cyclonic (green line) and the post-cyclonic conditions (red line) were extracted and computed.
(a,b) clearly show that the 28.5°C isotherm sunk by nearly 20 m on the left side of the track. Elevation of the 28.5°C and 20°C isotherms by approximately 30 and 50 m, respectively, was evident at the location near to the centre of the cyclone. Similarly, on the right side of the track, there was a clear indication of the 28.5°C isotherm sinking. These changes were caused by the strong upwelling at the centre of the storm and sinking on both sides. Comparable observations were noted from the salinity data across the track ((c,d)). The mixed layer depth, which was computed with two different criteria’s using the temperature and density profiles varied between 30–50 m and 15–40 m, respectively, along and across the track (white lines). The observed barrier layer depth (difference between two white lines) fluctuated from 0 to 30 m ((a,b)) before the formation of the Hudhud, and after its passage, the entire barrier layer was uplifted and became more thin at a depth of 10 m. It is also important to note that the displacement of isotherms was also evident up to 300 m, indicating that the influence of the cyclone extended up to 300 m in the water column. Out of the total isopycnic displacement (approximately 4.5 Pa) of 25 m, wind stress included displacement of around 23 m, which is also in agreement with the observed data. Hence, this clearly suggests that the effect of the cold-core eddies was suppressed by the stratification. Further, it is apparent from (e) and f that the negative temperature and positive salinity anomalies at the centre of the cyclone was caused by upwelling in this area, which transported subsurface waters with high salinity and low temperatures. The computed TCHP across the cyclone track clearly identifies a loss of 38–42 kJ/cm2 from the top layers above 50 m ((a)). This loss mainly contributed to the large amount of latent heat release that facilitated the formation of convective clouds and associated extreme precipitation over the outer flow regions of the storm. This cloud feedback mechanism during the cyclone intensification also significantly enhanced the lightening activity and associated thunderstorms, known as Conditional Instability of Second Kind (CISK). The Bio-Argo float (ID: 2902114), which was located on the track with a total distance of about 120 km (approximately 1°) demonstrated significant changes near the cyclone centre (). The TCHP at this float was 60 kJ/cm2 before the cyclone and it was reduced to 20 kJ/cm2 during the passage of the cyclone (). A drop of 40 kJ/cm2 was observed, and two weeks after the passage of the cyclone the TCHP raised to 60 kJ/cm2, coinciding with the horizontal track observations (). TheD26(depth of 26°C) isotherm,D20 (depth of 20°C) isotherm, and the TCHP were back to their original values within two weeks due to persistent stratification in the upper layers ((b,c)). The Bio-Argo data from before, during, and after the occurrence of the cyclone was compared with the satellite data at the same location ( and ). SST variations were almost less than or equal to 0.5°C, and satellite SST was higher because it provides exact surface temperatures, whereas the Argo detects temperatures almost 5 m below the surface. Whilst the sea surface salinity(SSS)differences were significant compared to SST, this was due to upwelling during the cyclone and may not have been captured by the satellite at the surface; however, the Argo recorded this information at 5 m. A similar occurrence was also observed with respect to chlorophyll. Before the cyclone event, variations in the surface chlorophyll were limited, but after the occurrence of cyclones, even the satellite sensed the higher chlorophyll concentrations, with Argo measures at depths below 5 m where the chlorophyll is high compared to the surface. The data sets drawn by the Argo and satellite matched well and the differences were quite high during and after the event because of the variations in measurement depths.
Figure 3. The top panel (a,b) represents temperature (contour interval 0.5) before and after the cyclone; the middle panel (c,d) depicts salinity (contour interval 0.25) before (24–29 September, weekly merged Argo data) and after (15–18 October, weekly merged Argo data) the cyclone; and the bottom panel (e,f) shows temperature and salinity anomalies(contour intervals 1 and 0.15, respectively) before and after the cyclone crossed the track.
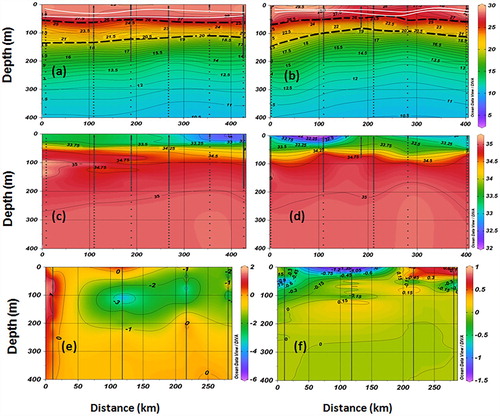
Figure 4. (a) TCHP (W/m2), (b) D26(m), and (c) D20(m) from the Argo time series data on the track during the passage of the cyclone.
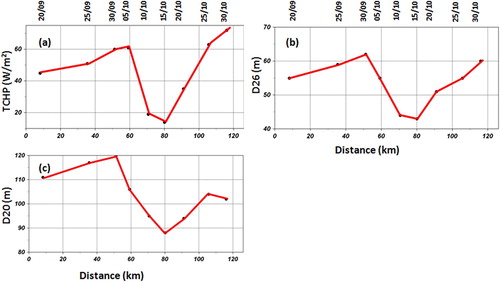
Figure 5. Time series Argo observations of (a) temperature (contour interval 0.5), (b) salinity (contour interval 0.2), (c) chlorophyll (mg/m3) (contour interval 0.5), and (d) dissolved oxygen (DO, μmole/kg) (contour interval 25) on the cyclone track during the passage of the cyclone.
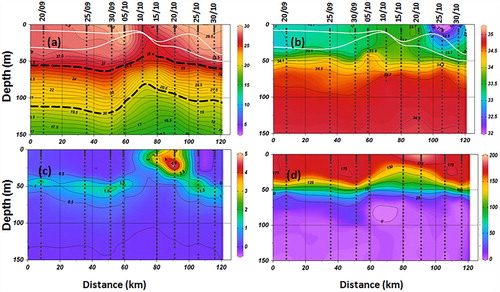
Table 1. Changes in ocean physical parameters along the Hudhud cyclone track.
Table 2. Changes in ocean biological parameters along the Hudhud cyclone track.
Analysis of the Bio-Argo data indicates an upliftment of isotherms at the centre of the cyclone during its passage ((a)). Both along the track and horizontal observations showed that the maximum shoaling was observed in the mixed layer based on temperature, which clearly signifies the upwelling phenomenon. Pankajakshan et al. (Citation2002) also observed a good correlation between the isothermal and barrier layers during the post-monsoon season. The mixed layer shoaled during the passage and the barrier layer completely disappeared due to the strong upwelling and associated strong mixing caused by the strong cyclonic winds of approximately54 m/s ((a,b)).
Upwelling at the centre of the cyclone brought nutrient-rich waters to the upper layers of the ocean, which act as breeding grounds for phytoplankton. The peculiarity associated with the present cyclone track is that it passed through cold-core eddies ((c)); however, its intensity was not affected by the eddies due to its high translation speed greater than 4.5 m/s and higher stratification (S > 3, (b)). In general, a cold-core eddy pumps cold, nutrient-rich water from the subsurface, and when the cyclone passes through, upwelling occurs due to the combined effect of the eddy and the cyclone (Shang et al. Citation2015). However, in the present study, the isopycnal displacement of 23 m was calculated from wind stress during the cyclogenesis, which was in agreement with the observed displacement determined by Argo and Bio-Argo data ((a,b)), indicating the suppressed effects of the eddies due to high stratification over the central and eastern parts of the Bay of Bengal (Figures 5(b) and 6(b)). Prevailing high stratification was due to excesses rainfall prior to the cyclone in the month of September over the Indian subcontinent and also in the BOB ((a)). As shown in (a), though there were no nutrient inputs from the cold-core eddies, upliftment was seen in the chlorophyll maxima because of the intense wind field and associated strong upwelling ((c)). It was evident that high stratification regions during the strong cyclone broke the barrier layer through intense mixing. Based on the time series Bio-Argo data, the subsurface chlorophyll maximum was 1.5 mg/m3, which was caused by cold-core eddies that was lifted upwards during the passage of cyclone due to upwelling ((c)). Chlorophyll concentrations increased further to 4.5 mg/m3 due to the availability of cool nutrient-rich water and sunlight at the surface ((c)). Similar findings were reported by Chacko (Citation2017) one week after the passage of the cyclone. The subsurface low oxygen also shifted upwards due the upwelling at the centre of the storm. The surface-induced oxygen maxima were observed at 200 μmole/kg ((d)) due to the level of productivity and also the high solubility of the cold upwelled waters. The rise in surface chlorophyll just before the intensification may have also been the result of the production of nitrous oxide (NOx) because of lightning (). The satellite observations of surface chlorophyll also displayed the increase in chlorophyll concentration along the track of the cyclone (0.5 mg/m3, ), and the drop in surface temperature of 3°C at the location of intensification ( and ). As shown in (b), the oceanic thermal structure achieved normal conditions after two weeks from the passage of the cyclone and the barrier layer thickness also increased due to precipitation (Figures 5(b) and 7(b)). A high Brunt-Väisälä frequency was observed in the top layers from 30 September to 30 October 2014, which indicates the thick barrier layer and high stratification. This demonstrates a negative relation between the barrier layer and productivity along the track of the cyclone. This phenomenon may not be applicable to coastal productivity after landfall because productivity tends to rise from land-driven nutrients due to the fresh water intrusion from coastal floods, and the barrier layer also increases due to fresh water influx. As a result, there may have been a positive relation in the coastal area after the cyclone landfall.
Figure 6. Distribution of (a) rainfall (mm), (b) stratification, and (c) surface currents (m/s). Blue and black dots show the track of the cyclone and red arrows point to the cold-core eddies on the track.
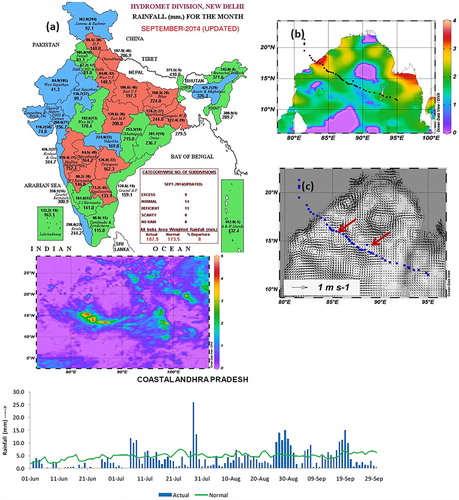
Figure 7. Time series observational data of (a) temperature (°C) (contour interval 1), (b) salinity (psu) (contour interval 0.5), (c) Brunt-Väisälä frequency (cyc/hr) (contour interval 1), and (d) density anomaly (kg/m3) (contour interval 0.25) at the location of the cold-core eddies and passage of the cyclone on 10 October 2014.
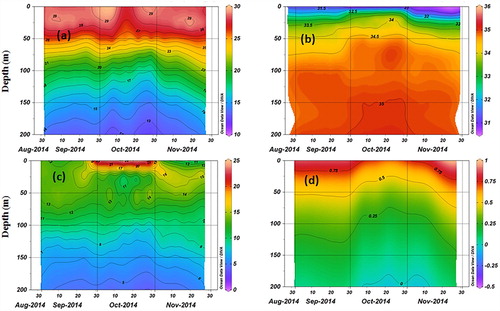
Figure 8. Lightning data (deep blue) during Hudhud (www.wwlln.net) along with the wind speed (light blue line, knots) and pressure (orange line, millibars).
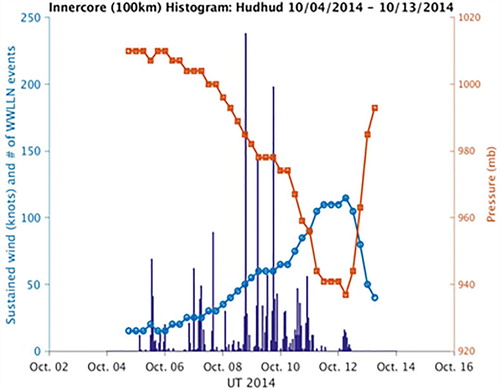
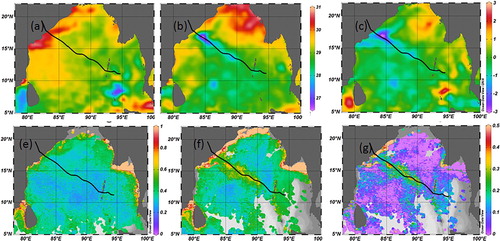
Figure 9. The top panel shows sea surface temperature (a) before (29 September 2014) and (b) after (15 October 2014) cyclone Hudhud, and (c) is the difference. The bottom panel displays chlorophyll concentrations (e) before (29 September 2014) and (f) after (20 October 2014) cyclone Hudhud, and (g) is the difference.
4. Summary and conclusions
Up to 300 m of the oceanic layer over the BOB underwent several changes due to the occurrence of severe cyclonic storm Hudhud. For the first time, the presence of Argo and Bio-Argo floats near the cyclone track aided studies in determining the physical and biological changes in the water column. There was an upliftment of isotherms due to the upwelling caused by the cyclone at the centre. Sinking was detected on the left and right sides of the track through the Argo, which is consistent with satellite observations. The barrier layer completely disappeared during the passage of the cyclone and became very thin across its track. The heat loss of 40 kJ/cm2 was reported across and at the centre of the storm. The cyclone passed through two cold-core eddies but its intensity was not changed due to its high translation speed and ocean stratification. The coincidence of the cold eddies and the storm should have presented more intense upwelling, but in case of Hudhud, the high stratification suppressed the effect of the cold eddies. High stratification was due to the excess amount of rainfall prior to the tropical cyclone formation in the month of September. The ocean reverted back to the original thermal structure within two weeks after the passage of the cyclone. The upwelling induced blooms and high oxygen levels were evident at the centre of the cyclone through the Bio-Argo floats and satellites. Thus, the occurrence of the storms in the post-monsoon season may alter the thickness of the barrier layer during and after their passage and have an impact on the biology of the system up to certain period after the passage of the cyclone. Never the less, it is necessary to study the integrated effects of post-monsoon cyclones on barrier layer dynamics and associated biology in the Bay of Bengal. An increase in number of Bio-Argo floats over the Indian Ocean will assist in better understanding post-cyclone impacts and inputting model data for enhanced simulations.
Acknowledgements
The authors acknowledge the Coriolis Argo data centre (www.coriolis.eu.org) and INCOIS (ww.incois.gov.in) for providing the Argo, bio- Argo, remote sensing data sets. Thanks to Copernicus data services for providing geotropic currents, ocean parameters data. Authors also acknowledge the IMD for providing rainfall data. The authors are thankful to Director CSIR-NIO, Scientist-in-Charge for their support. This has the NIO contribution no. 6461.
Disclosure statement
No potential conflict of interest was reported by the authors.
References
- Ali MM, Jagadish PSV, Jain S. 2007. Effect of eddies on Bay of Bengal cyclone intensity EOS transactions. AGU. 88(8). doi:10.1029/2007EO08001.
- Babin SM, Carton JA, Dickey TD, Wiggert JD. 2004. Satellite evidence of hurricane-induced phytoplankton blooms in an oceanic desert. J Geophys Res: Oceans. 109. doi:10.1029/2003JC001938.
- Balaguru K, Chang P, Saravanan R, Leung LR, Xu Z, Li M, Hsieh J-S. 2012. Ocean barrier layers effect on tropical cyclone intensification. Proc Natl Acad Sci. 109(36):14343–14347. doi: 10.1073/pnas.1201364109
- Bhaskar Rao DV, Prasad DH. 2007. Sensitivity of tropical cyclone intensification to boundary layer and convective processes. Nat Hazards. 41:429–445. doi:10.1007/s11069-006-9052-7.
- Chacko N. 2017. Chlorophyll bloom in response to tropical cyclone Hudhud in the Bay of Bengal: Bio-Argo subsurface observations. Deep Sea Res Part-I. 124:66–72. doi: 10.1016/j.dsr.2017.04.010
- Dickey T, Frye D, McNeil J, Manov D, Nelson N, Sigurdson D, Jannasch H, Siegel D, Michaels A, Johnson R. 1998. Upper-ocean temperature response to Hurricane Felix as measured by the Bermuda Testbed Mooring. Mon Wea Rev. 126:1195–1201. doi: 10.1175/1520-0493(1998)126<1195:UOTRTH>2.0.CO;2
- Eppley RW, Renger EH. 1988. Nanomolar increase in surface layer nitrate concentration following a small wind event. Deep-Sea Res. 35:1119–1125. doi: 10.1016/0198-0149(88)90004-0
- Falkowski PG, Ziemann D, Kolber Z, Bienfang PK. 1991. Role of eddy pumping in enhancing primary production in the ocean. Nature. 352(6330):55–58. doi: 10.1038/352055a0
- Foltz GR, Balaguru K, Ruby Leung L. 2015. A reassessment of the integrated impact of tropical cyclones on surface chlorophyll in the western subtropical North Atlantic. Geophys Res Lett. 42:1158–1164. doi:10.1002/2015GL063222.
- Geetha B, Balachandran S. 2014. Decadal variations in translational speeds of cyclonic disturbances over north Indian ocean. Mausam. 65:115–118.
- Girish kumar MS, Ravichandran M, McPhaden MJ, Rao RR. 2011. Intraseasonal variability in barrier layer thickness in the south central Bay of Bengal. J Geophys Res. 116:C03009. doi:10.1029/ 2010JC006657.
- Goni GJ, DeMaria M, Knaff J, Sampson C, Ginis I, Bringas F, Mavume A, Lauer C, Lin I-I, Ali MM, et al. 2009. Applications of satellite-derived ocean measurements to tropical cyclone intensity forecasting. Oceanography. 22(3):176–181. doi: 10.5670/oceanog.2009.78
- Goni GJ, Trinanes JA. 2003. Ocean thermal structure monitoring could aid in the intensity forecast of tropical cyclones. Eos, Trans Amer Geophys Union. 84:573–580. doi: 10.1029/2003EO510001
- Gray WM. 1968. Global view of the origin of tropical disturbances and storms. Mon Wea Rev. 96:669–700. doi: 10.1175/1520-0493(1968)096<0669:GVOTOO>2.0.CO;2
- Hanshaw MN, Lozier MS, Palter JB. 2008. Integrated impact of tropical cyclones on sea surface chlorophyll in the North Atlantic. Geophys Res Lett. 35:L01601. doi: 10.1029/2007GL031862
- Holland GJ, Bruyère C. 2014. Recent intense hurricane response to global climate change. ClimDyn. 42:617–627. doi:10.1007/s00382-013-1713-0.
- Hong X, Chang SW, Raman S, Shay LK, Hodur R. 2000. The interaction between Hurricane Opal (1995) and a warm core eddy in the Gulf of Mexico. Mon Wea Rev. 128:1347–1365. doi: 10.1175/1520-0493(2000)128<1347:TIBHOA>2.0.CO;2
- Hung CC, Gong GC. 2011. Biogeochemical responses in the southern east China Sea after typhoons. Oceanography. 24(4):42–51. doi:10.5670/oceanog. 2011.93 doi: 10.5670/oceanog.2011.93
- Jansen MF, Ferrari R, Mooring TA. 2010. Seasonal versus permanent thermocline warming by tropical cyclones. Geophys Res Lett. 37:n/a–n/a. doi:10.1029/2009GL041808.
- Kay S, Caesar J, Janes T. 2018. Marine dynamics and productivity in the Bay of Bengal. In: Ecosystem services for well-being in deltas. Cham: Palgrave Macmillan; p. 263–275.
- Keim BD, Muller RA, Stone GW. 2007. Spatiotemporal patterns and return periods of tropical storm and hurricane strikes from Texas to Maine. J Clim. 20:3498–3509. doi: 10.1175/JCLI4187.1
- Leiper D, Volgenau D. 1972. Hurricane heat potential in the Gulf of Mexico. J Phys Oceanogr. 2:218–224. doi: 10.1175/1520-0485(1972)002<0218:HHPOTG>2.0.CO;2
- Lin II. 2012. Typhoon-induced phytoplankton blooms and primary productivity increase in the western North Pacific subtropical ocean. J Geophys Res Oceans. 117:15. doi:10.1029/2011jc007626 doi: 10.1029/2011JB009122
- Lin I, Liu WT, Wu C-C, Wong GTF, Hu C, Chen Z, Liang W-D, Yang Y, et al. 2003. New evidence for enhanced ocean primary production triggered by tropical cyclone. Geophys Res Lett. 30:n/a–n/a. doi:10.1029/2003GL017141.
- Lin I-I, Wu C-C, Emanuel KA, Lee I-H, Wu C-R, Pum I-F. 2005. The interaction of super typhoon Maemi with a warm ocean eddy. Mon Wea Rev. 133:2635–2649. doi: 10.1175/MWR3005.1
- Liu X, Wang M, Shi W. 2009. A study of a Hurricane Katrina-induced phytoplankton bloom using satellite observations and model simulations. J Geophys Res. 114:C03023. doi:10.1029/2008JC004934.
- Mackey DJ, Parslow JS, Griffiths FB, Higgins HW, Tilbrook B. 1997. Plankton productivity and the carbon cycle in the western equatorial Pacific under E1 Nifio and non-E1 Nifio conditions. Deep Sea Res. 44:1951–1978. doi: 10.1016/S0967-0645(97)00033-7
- Maneesha K, Murty VSN, Ravichandran M, Lee T, Yu W, McPhaden MJ. 2012. Upper ocean variability in the Bay of Bengal during the tropical cyclones Nargis and Laila. Prog Oceanogr. 106:49–61. doi: 10.1016/j.pocean.2012.06.006
- Marra J, Bidigare RR, Dickey TD. 1990. Nutrients and mixing, chlorophyll and phytoplankton growth. Deep-Sea Res. 37:127–143. doi: 10.1016/0198-0149(90)90032-Q
- McPhaden MJ, Foltz GR, Lee T, Murty VSN, Ravichandran M, Vecchi GA, Vialard J, Wiggert JD, Yu L. 2009. Oceanatmosphere interactions during cyclone Nargis. Eos, Trans Am Geophys Union. 90(7):53–54. doi: 10.1029/2009EO070001
- Narvekar J, Prasanna Kumar S. 2014. Mixed layer variability and chlorophyll a biomass in the Bay of Bengal. Biogeosciences. 11(14):3819–3843. doi: 10.5194/bg-11-3819-2014
- Nencioli F, Kuwahara VS, Dickey TD, Rii YM, Bidigare RR. 2008. Physical dynamics and biological implications of a mesoscale eddy in the lee of Hawai’i: cyclone Opal observations during E-Flux III. Deep-Sea Res Pt II. 55(10–13):1252–1274. doi: 10.1016/j.dsr2.2008.02.003
- Palmen EH. 1948. On the formation and structure of tropical cyclones. Geophys Univ of Helsinki. 3:26–38.
- Pankajakshan T, Gopalakrishna VV, Muraleedharan PM, Reddy GV, Araligidad N, Shenoy S. 2002. Surface layer temperature inversionin the Bay of Bengal. Deep Sea Res Part I. 49:1801–1818. doi:10.1016/S0967-0637(02) 00044-4 doi: 10.1016/S0967-0637(02)00044-4
- Pankajakshan T, Muraleedharan PM, Rao RR, Somayajulu YK, Reddy GV, Revichandran C. 2007. Observed seasonal variability of barrier layer in the Bay of Bengal. JGR, 112, C02009, doi:10.1029/2006JC003651.
- Price JF, Sanford TB, Forristall GZ. 1994. Forced stage response to a moving hurricane. J Phys Oceanogr. 24:233–260. doi: 10.1175/1520-0485(1994)024<0233:FSRTAM>2.0.CO;2
- Rio M-H, Mulet S, Picot N. 2014. Beyond GOCE for the ocean circulation estimate: synergetic use of altimetry, gravimetry, and in situ data provides new insight into geostrophic and Ekman currents. Geophys Res Lett. 41. doi:10.1002/2014GL061773.
- Sadhuram Y, Maneesha K, Ramana Murty TV. 2011. Intensification of Aila (May 2009) due to a warm core eddy in the north Bay of Bengal. Nat Hazards. 63:1515–1525. doi: 10.1007/s11069-011-9837-1
- Shang X, Zhu H, Chen G, Xu C, Yang Q. 2015. Research on cold core eddy change and phytoplankton bloom induced by typhoons: case studies in the South China SeaAdv. Meteorol. 1–19. doi: 10.1155/2015/340432.
- Shay LK, Brewster JK. 2011. Eastern Pacific oceanic heat content estimation for hurricane intensity forecasting. Mon Wea Rev. 138:2110–2131. doi: 10.1175/2010MWR3189.1
- Shay LK, Goni GJ, Black PG. 2000. Effect of a warm ocean ring on hurricane Opal. Mon Wea Rev. 128:1366–1383. doi: 10.1175/1520-0493(2000)128<1366:EOAWOF>2.0.CO;2
- Shi W, Wang M. 2007. Observations of a Hurricane Katrina-induced phytoplankton bloom in the Gulf of Mexico. Geophys Res Lett. 34:n/a–n/a. doi:10.1029/2007GL029724 doi: 10.1029/2007GL029528
- Singh OP. 2010. Recent trends in tropical cyclone activity in the North Indian ocean. In: Charabi Y, editor. Indian ocean tropical cyclones and climate change. Dordrecht: Springer Science and Business; p. 51–54.
- Sweeney EN, McGillicuddy DJ Jr., Buesseler KO. 2003. Biogeochemical impacts due to mesoscale eddy activity in the Sargasso Sea as measured at the Bermuda Atlantic time-series study (BATS). Deep-Sea Res Pt II. 50(22–26):3017–3039. doi: 10.1016/j.dsr2.2003.07.008
- Vissa NK, Satyanarayana ANV, Kumar BP. 2013. Response of upper ocean and impact of barrier layer on Sidr cyclone induced sea surface cooling. Ocean Sci J. 48(3):279–288. doi: 10.1007/s12601-013-0026-x
- Wada A, Usui N. 2007. Importance of tropical cyclone heat potential for tropical cyclone intensity and intensification in the western North Pacific. J Oceanogr. 63:427–447. doi: 10.1007/s10872-007-0039-0
- Walker ND, Leben RR, Balasubramanian S. 2005. Hurricane-forced upwelling and chlorophyll a enhancement within cold-core cyclones in the Gulf of Mexico. Geophys Res Lett. 32(18) Article ID L18610:1–5. doi: 10.1029/2005GL023716
- Walker ND, Leben RR, Pilley CT, Shannon M, Herndon DC, Pun I-F, Lin I-I, Gentemann CL. 2014. Slow translation speed causes rapid collapse of northeast Pacific Hurricane Kenneth over cold-core eddy. Geophys Res Lett. 41:7595–7601. doi:10.1002/ 2014GL061584 doi: 10.1002/2014GL061584