
ABSTRACT
The United Nations Framework Convention on Climate Change (UNFCCC) guidelines aim for a maximum 10% uncertainty in forest biomass inventories, after which penalties accrue. Identification of this magnitude of error requires recognition of discrepancies in carbon stock estimates between project proponents and by Measurement, Reporting, and Verification (MRV) auditors for REDD+ (Reduced Emissions from Deforestation and Forest Degradation, plus the role of conservation, forest management and enhancement of carbon stocks). Given that carbon stocks might be intentionally overestimated by profiteers who would thereby benefit financially, it is important to know how those estimates might most expeditiously be inflated by systematic or random positive biases in measurements of tree diameter, height and wood density. We explore the differences in magnitudes of forest biomass estimate inflation that result from a scenario in which positive bias is added to a random selection of 1–20% of all trees, and a systematic “Carbon Cowboy” scenario in which 1–20% is added to the measurements of the largest trees. As expected, biases under the random scenario must be both highly frequent (>20% of trees) and large (>10%) to breach the UNFCCC 10% uncertainty threshold. In contrast, for the Carbon Cowboy scenario, a measurement bias in tree diameter as small as 10% reaches the same limit if added to the largest 5% of trees. A 10% upward bias achieves the same result if applied to the diameter, height and wood density of the largest 1% of trees. These findings suggest that MRV auditors of REDD+ projects should be especially vigilant about systematic measurement biases that involve large trees.
Introduction
Measurement, Reporting and Verification (MRV) procedures for estimates of forest biomass are critical elements of REDD+ (Reduced Emissions from Deforestation and Forest Degradation, plus the role of conservation, forest management and enhancement of carbon stocks) initiatives [Citation1]. While MRV procedures that utilize remote sensing are being developed to set regional forest carbon stock baselines [Citation2–4] and to capture changes in forest cover [Citation5], ground-based forest inventories are still required to quantify forest carbon stocks to within the goal of less than 10% uncertainty recommended by the United Nations Framework Convention on Climate Change [Citation6]. Unfortunately, with so much money in the offing, all biomass estimates are susceptible to malicious bias. Corrupt practices perpetrated by what are sometimes called “Carbon Cowboys” are a cause for concern about REDD+ interventions [Citation7,Citation8]. In this study we explore how much positive measurement bias in tree height, stem diameter at breast height (DBH) and wood density would be required to inflate forest carbon stock estimates past the 10% UNFCCC REDD+ threshold, as well how bias distribution affects biomass estimates.
While forest biomass can be estimated indirectly using biomass expansion factors [Citation9–11], more direct approaches that rely upon allometric equations (developed using variables, singly or in combination, such as DBH, wood density and total tree height as independent variables and aboveground biomass as the dependent variable; [Citation12]) provide more accurate estimates [Citation13]. Nevertheless, there are inevitable errors in carbon stock estimates due to forest inventory and laboratory measurement errors, as well as model errors intrinsic to the chosen allometric equations [Citation14,Citation15].
Measurement errors in forest inventories are hard to avoid for large and irregularly shaped trees, especially those with big buttresses, lianas, resprouted crowns, and inclined trunks [Citation16,Citation17]. Allometric equations that include tree height as well as stem diameter may yield more accurate biomass estimates [Citation18,Citation19], but height measurements are notoriously problematic [Citation20,Citation21] whether based on dendrometric tables or field-based angle measurements made with clinometers or laser-based hypsometers [Citation23,Citation24]. Height measurement errors are especially likely in closed-canopy forests with dense understories and steep slopes. Inclusion of wood density in tree biomass allometric equations can further improve the estimates, but wood density estimates are also subject to error because they vary within trees, species, genera and spatial locales [Citation24]. Furthermore, the accuracy of tabular wood density values depends on accurate botanical identification, which cannot be assumed even when carried out by experienced taxonomists [Citation25,Citation26]. Hence, the aggregated errors associated with measuring DBH, height and wood density produce unavoidable uncertainty in forest biomass estimates.
For performance-based REDD+ activities, the natural capital of forests is assigned a financial worth on the basis of carbon stocks. REDD+ project managers and marketers may therefore be tempted to inflate measures of tree DBH, height and/or wood density to capture the financial benefits of high carbon stocks. Such biases might easily be masked from MRV bodies if applied to a small proportion of hard-to-measure but high-biomass trees, or if they are small and randomly distributed among all trees measured.
In this study, we used forest inventory data from the Center for Tropical Forest Studies (CTFS) 50-ha plot on Barro Colorado Island, Panama, to quantify the effects of positive measurement biases on forest carbon stock estimates. Simulated biases were added to measurements of tree stem DBH (1.3 m), height and wood density under two malicious, profit-maximizing scenarios: first, a deterministic process in which positive measurement biases were added to the largest trees and, second, a stochastic process in which the biases were added to varying percentages of randomly selected trees. We then compared simulated biomass estimates to the error threshold of 10% set by the UNFCCC [Citation6] and evaluated the relevance of these results to REDD+ MRV procedures.
Methods
We used the seventh census (2010) of the CTFS 50-ha Barro Colorado Island (BCI) forest dynamics plot (9.90°N, 79.51°W; see [Citation27] for details) to examine how positive measurement biases affect biomass estimation. Aboveground biomass (AGB) of the 50-ha forest dynamics plot was calculated for all trees ≥10 cm DBH. Species-specific tree heights were estimated with the DBH–height relationship developed from field measurements reported by Bohlman and O'Brien [Citation28] combined with unpublished data provided by S. Bohlman, H. Muller-Landau, and S.J. Wright. The functional form of the height equation used varied (EquationEquations 1(1) or Equation2
(2) ) depending on species:
(1)
(2) where H is tree total height (m) while α, β and hmax represent species-specific parameters. We used Chave et al.'s [Citation19] allometric Model 4 (EquationEquation 3
(3) ) to simulate the effect of bias on estimates of DBH (cm), height (H; m) and wood density (ρ; kg/m) on calculations of aboveground biomass (AGBest; kg). We repeated the analysis using Model 7 (EquationEquation 4
(4) ), based on DBH, wood density and a location-specific environmental variable E (results reported in Figure S1):
(3)
(4)
Wood density values were obtained from the Global Wood Density database [Citation101] (see Supplementary material for details).
For the deterministic bias scenario, overestimates of 0–20% were added to the DBH, height and wood density of the top 1, 5, 10 and 20% of the largest trees selected on the basis of their “pre-bias” biomass. In contrast, under the stochastic scenario, biases were added at random to 1, 5, 10 and 20% of the trees independent of their size. Uncertainty was estimated by generating 95% bootstrap confidence intervals based on 1000 simulations. Biases were considered noteworthy when they increased AGB estimates beyond the UNFCCC's 10% uncertainty threshold [Citation6]. Simple linear regressions were fit to the biomass inflation results to compare the bias-size effect under both scenarios.
To translate biomass overestimates into REDD+ per hectare revenues, we calculated a scenario where 10% measurement biases were applied to the DBHs, heights and wood densities of the top 1% of the largest trees (see Supplementary material for a similar analysis conducted at a REDD+ project level). The unjustified additional REDD+ revenues were calculated based on the range of US$ 3–6/Mg CO2 [Citation29], as follows:
(5) where RREDD+ is the additional revenue due to the introduced biases, AGB of stems > 10 cm DBH in the BCI plot averages 223 Mg/ha, B is the introduced bias to a given proportion of trees' variables, BGB is the belowground biomass (expressed as 22% of AGB [Citation30]), C is the biomass carbon fraction (0.47 [Citation11]), 44/12 is the molecular ratio of CO2 (standard unit of carbon credits), E is the expected effectiveness of the REDD+ intervention (assumed to be 90%), I is the proportion of commercialized credits not kept in an insurance pool (i.e., buffer; see [Citation31]; assumed to be 80%), and P is the price of a carbon credit unit (US$3 and $6 per Mg CO2). Greenhouse gas emissions from both project activities and leakage were disregarded.
Results
Deterministic bias scenario
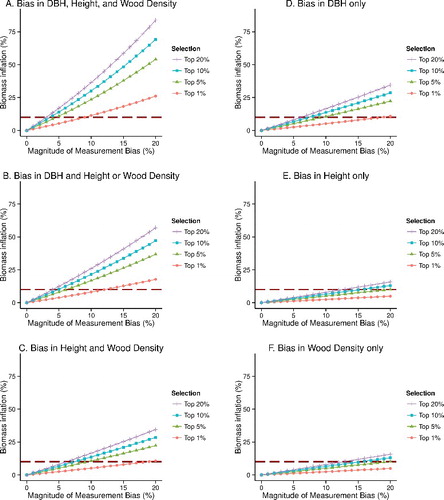
Biases added systematically to a relative few of the largest trees quickly caused total plot biomass estimates to exceed the 10% error threshold set by the UNFCCC (). For example, if 10% is added to the measurements of height, DBH and wood density of the largest 1% of trees, this threshold is breached. A bias of 10% applied to DBH alone of the largest 5% of trees was sufficient to inflate total plot biomass by 10%, whereas a 20% measurement bias applied to the largest 5% of trees was needed to accomplish the same effect when added to measurements of height or wood density (A). The effect of DBH bias on biomass was almost twice that of either height or wood density under both scenarios (Figures 1E, F, 2E–G). Note that effects of inflated measures of height or wood density are equivalent due to the functional form of the allometric model (EquationEquation 3(3) , from Model 4 of [Citation17]). Results from Model 7 are reported in the Supplementary material.
Figure 1. Effects on estimated forest biomass of positive biases added to the tree trunk diameters at breast height, heights and wood densities of the largest trees (1, 5, 10 and 20%) under the “Carbon Cowboy” deterministic bias scenario. Horizontal dashed lines represent the 10% UNFCCC uncertainty threshold for forest biomass estimates. DBH: Tree trunk diameter at breast height.
Random bias scenario
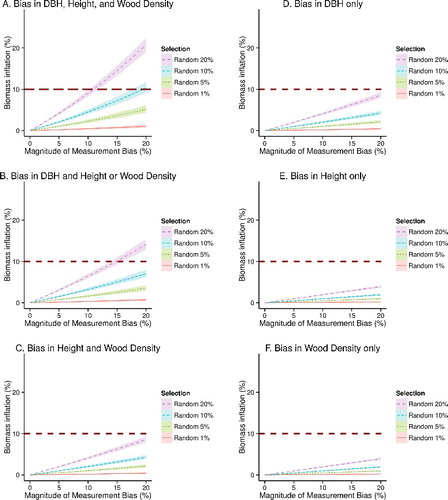
Biomass overestimates under the stochastic scenario were substantially lower than the deterministic large-tree selection scenario and only breached the UNFCCC's uncertainty threshold when DBH, height and wood density measurement biases were >11% and added to at least 10% of the trees (A), and as a combination of DBH and height and/or wood density where 20% of the trees were biased >14% (B). When overestimates of DBH, height and wood density were added individually, even 20% measurement bias applied to 20% of the trees did not push the biomass estimates beyond the 10% threshold (D–F). Similar patterns were observed for the combination of biased heights and wood densities (C).
Figure 2. Cumulative effects on estimates of forest biomass of upward biases in measurements of tree trunk diameter at breast height, height and wood density of randomly selected trees as a proportion of all trees (1, 5, 10 and 20%). Horizontal dashed lines represent the 10% UNFCCC uncertainty threshold for forest biomass estimates. Shaded areas represent 95% bootstrap confidence intervals based on 1000 simulations. DBH: Tree trunk diameter at breast height.
These results can also be considered the rate of change in estimated plot biomass per magnitude of measurement bias, as indicated by the coefficients of simple linear regressions () fit to the model simulation results. As expected, the bias effect increased as it was added to greater percentages of trees and more of the allometric equation variables. Bias effects were about 25 times greater for the top 1% of the largest trees under the deterministic scenario when compared to the randomly sampled 1% of the trees under the stochastic scenario. This proportion declines to 10, 7 and 4 times as the sample of trees increases to 5, 10 and 20% of the total, in accordance with the same sampling rules. The bias effects on biomass estimates using the Chave et al. [Citation17] Model 7 were consistent with these patterns (Figure S1).
Table 1. Biases in forest biomass estimates in relation to magnitude (%) of measurement inflation expressed as the rate of change in biomass per percent increase in measurement bias.
Financial consequences of biased measures
To translate the impact of inflated tree measurements on potential revenues from REDD+ projects, we calculated a scenario in which 10% measurement biases were applied to the DBHs, heights and wood densities of the top 1% of the largest trees (equivalent to a net 10% inflation of plot biomass). With these settings, biases could easily produce an increase in ill-gotten project revenue of between US $100 to $200 per hectare (see Supplementary material for estimated revenue increases for a hypothetical REDD+ project).
Discussion
Sources of measurement error
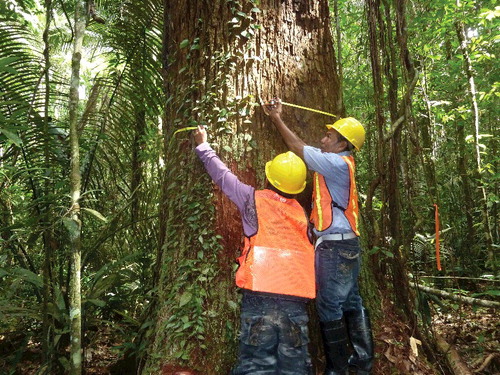
Although we focus on pernicious overestimates of tree dimensions, we recognize that measuring tree heights and stem diameters is challenging (), especially where tree crowns are large, canopies are multilayered and closed, and tree stems are fluted, buttressed or hollow, or otherwise depart from the assumption of cylindricality. Indeed, different observers may obtain different measurements for the same tree, and measurements by the same observer may vary when different methods are used [Citation21,Citation28]. Theilade et al. [Citation32] found that inexperienced crews were able to measure small trees' DBH accurately, but some large errors were found for large and irregular-shaped trees. It is easy to imagine how errors might be produced by misaligned DBH tape measurements as field crews become fatigued. In addition to the likely and hard-to-avoid measurement errors in forest inventories, the potential influence of malicious profit-seeking biases in tree measurements for REDD+ are substantial enough to warrant consideration. Previous studies on biomass measurement errors focused on user error, such as comparisons of different inventory crews or model simulations [e.g., Citation14,Citation33]. Malicious biases are assumed absent under such scenarios, but tropical forest industries and carbon markets are known to be plagued by corruption and excessive profit seeking [Citation8,Citation34–36]. Here, we report how REDD+ MRV forest inventories could be profitably exploited to a level beyond the UNFCCC's carbon inventory uncertainty threshold by applying positive measurement biases to a small proportion of the largest trees; yet even random biases can compromise the accuracy of whole plot biomass estimates when applied to a large enough subset of trees (>20%) or at high levels (>10%) of positive measurement bias.
Figure 3. A forest inventory crew trying to measure the diameter of a large tree in Iwokrama Forest, Guyana. Photo by Ken Rodney; used with permission.
Could the potential for positive measurement bias be circumvented with other biomass estimation methods? Few alternatives currently exist, and even promising methods for rapid evaluation of biomass using airborne light detection and ranging (LiDAR) [Citation37] still rely on field-measured parameters such as basal area, wood density and height – each with its own level of uncertainty and potential for bias. Furthermore, the accuracy of biomass estimation with LiDAR has not been consistently demonstrated to be within the 10% uncertainty interval desired for inventories at spatial scales relevant to individual REDD+ projects [Citation38]. Also, the current costs of LiDAR-based biomass estimates are prohibitive at the spatial scales of most REDD+ projects. Field-based forest inventories are not cheap, but they are still the most inexpensive to implement at the scale of individual REDD+ projects, and are therefore likely to be the most extensively used method for forest biomass estimation for the foreseeable future.
Challenges for REDD+ Measurement, Reporting, and Verification auditors
In accordance with International Organization for Standardization (ISO) 14065 on requirements for MRV bodies [Citation39], the responsibilities of an auditing team evaluating data from a REDD+ intervention are to assess its assertion on GHG emissions and reductions and its required corrective actions, design a sampling plan based on an appropriate level of assurance, analyze risks and identify failures in data and data systems, and assess the impact of the various streams of data on the GHG assertion. Hence, tree measurements in forest plots are fundamental for quantifying carbon stocks and for MRV audits [Citation40], but auditors are time and resource limited and thus can only verify reported carbon stocks through sampling. Surprisingly, many voluntary carbon market standards do not require MRV auditors to resample a minimum area or number of trees [Citation41–43]. While that omission seems wrong, requiring that a high fraction of trees be remeasured by auditors would increase the transaction costs for REDD+, which are already substantial [Citation44]. Here, we showed how just a 10% bias applied to the DBH, height and wood density measures of just the largest 1% of trees was sufficient to breach the 10% uncertainty threshold aimed for by the UNFCCC. If a low frequency of positive measurement bias is applied to the largest trees, there is little hope for a limited amount of random sampling of tree measurements to detect such a bias.
Therefore, we suggest that MRV guidelines require monitoring for systematic positive measurement biases in REDD+ forest inventories by remeasurement of the largest trees, and implementation of low-cost strategies to more robustly estimate large tree biomass [e.g., Citation17,Citation21]. In this regard, a risk-based sampling approach for the REDD+ project audits is recommended [see Citation39]. This strategy would require auditing bodies to design a resampling plan focused on inventory plots where it would be more likely to find measurement biases instead of adopting a random resampling approach. Inventory plots with the highest numbers of large trees should be preferentially selected by REDD+ auditors. As a result, the “materiality” of carbon stocks estimates (the concept that errors, omissions or misrepresentations, individually or in aggregate, can affect the GHG assertion [Citation31]) could be evaluated more effectively. Ultimately, the potential annual transfers of hundreds of millions of dollars in voluntary carbon market payments [Citation29] represent an incentive for unscrupulous REDD+ project promoters to overestimate tree measurements, and the onus is on MRV bodies to guard against artificially inflated forest carbon stocks.
Supplementary Material
Download MS Word (117.6 KB)Acknowledgements
We thank Stephanie Bohlman for supplying tree height allometric equations. S.W. Rifai was supported by a NASA Earth and Space Science fellowship. T.A.P. West was supported by the Brazilian National Counsel of Technological and Scientific Development (CNPq; process 201138/2012-3).
Supplementary material for this article can be found here.
References
- UN-REDD. The UN-REDD Programme Strategy 2011–2015. UN-REDD, Geneva, Switzerland (2011).
- Saatchi SS, Harris NL, Brown S et al. Benchmark map of forest carbon stocks in tropical regions across three continents. Proc. Natl. Acad. Sci. USA 108(24), 9899–9904. doi:10.1073/pnas.1019576108 (2011).
- Baccini A, Asner GP. Improving pantropical forest carbon maps with airborne LiDAR sampling. Carbon Manage. 4(6), 591–600. doi:10.4155/CMT.13.66 (2013).
- Asner GP, Mascaro J. Mapping tropical forest carbon: calibrating plot estimates to a simple LiDAR metric. Remote Sens. Environ. 140, 614–624. doi:10.1016/j.rse.2013.09.023 (2014).
- Souza Jr C, Siqueira J, Sales M et al. Ten-year Landsat classification of deforestation and forest degradation in the Brazilian Amazon. Remote Sens. 5(11), 5493–5513. doi:10.3390/rs5115493 (2013).
- UNFCCC. A/R Methodological Tool: Estimation of Carbon Stocks and Change in Carbon Stocks of Trees and Shrubs in A/R CDM Project Activities. UNFCCC, Bonn, Germany (2013).
- Nerlich B, Koteyko N. Carbon Gold Rush and Carbon Cowboys: a new chapter in green mythology? Environ. Commun. 4(1), 37–53. doi:10.1080/17524030903522389 (2010).
- Vatn A, Vedeld PO. National governance structures for REDD+. Glob. Environ. Chang. 23(2), 422–432. doi:10.1016/j.gloenvcha.2012.11.005 (2013).
- Brown S. Estimating Biomass and Biomass Change of Tropical Forests: A Primer. FAO Forestry Paper 134 FAO, Rome (1997).
- IPCC. Chapter 4: supplementary methods and good practice guidance arising from the Kyoto Protocol. In: Good Practice Guidance For Land Use, Land-Use Change and Forestry. Penman J, Gytarsky M, Hiraishi T et al. (Eds). Institute for Global Environmental Strategies (IGES) for the IPCC, Hayama, Japan (2003).
- IPCC. Chapter 4: forest land. In: 2006 IPCC Guidelines for National Greenhouse Gas Inventories. Eggleston HS, Buendia L, Miwa K, Ngara T, Tanabe K (Eds). Institute for Global Environmental Strategies (IGES) for the IPCC, Hayama, Japan (2006).
- Brown S, Gillespie AJR, Lugo AE. Biomass estimation methods for tropical forests with applications to forest inventory data. Forest Sci. 35(4), 881–902 (1989).
- GOFC-GOLD (Global Observation of Forest and Land Cover Dynamics). Reducing Greenhouse Gas Emissions from Deforestation and Degradation in Developing Countries: A Sourcebook of Methods and Procedures for Monitoring, Measuring and Reporting. GOFC-GOLD Report Version COP14-2. GOFC-GOLD Project Office, Alberta, Canada (2009).
- Chave J, Condit R, Aguilar S, Hernandez A, Lao S, Perez R. Error propagation and scaling for tropical forest biomass estimates. Philos. Trans. R. Soc. Lond. B Biol. Sci. 359(1443), 409–420. doi:10.1098/rstb.2003.1425 (2004)
- Molto Q, Rossi V, Blanc L. Error propagation in biomass estimation in tropical forests. Methods Ecol. Evol. 4(2), 175–183. doi:10.1111/j.2041-210x.2012.00266.x (2013).
- Clark D, Clark D. Landscape-scale variation in forest structure and biomass in a tropical rain forest. For. Ecol. Manage. 137(1–3), 185–198. doi:10.1016/S0378-1127(99)00327-8 (2000).
- Cushman KC, Muller-Landau HC, Condit RS, Hubbell SP. Improving estimates of biomass change in buttressed trees using tree taper models. Methods Ecol. Evol. 5(6), 573–582. doi:10.1111/2041-210X.12187 (2014).
- Feldpausch TR., Banin L, Phillips OL et al. Height-diameter allometry of tropical forest trees. Biogeosciences 8(5), 1081–1106. doi:10.5194/bg-8-1081-2011 (2011).
- Chave J, Réjou-Méchain M, Búrquez A et al. Improved allometric models to estimate the aboveground biomass of tropical trees. Glob. Chang. Biol. 20(10), 3177–3190. doi:10.1111/gcb.12629 (2014).
- Brown S. Measuring carbon in forests: current status and future challenges. Environ. Pollut. 116(3), 363–372. doi: 10.1016/S0269-7491(01)00212-3 (2002).
- Larjavaara M, Muller-Landau HC. Measuring tree height: a quantitative comparison of two common field methods in a moist tropical forest. Methods Ecol. Evol. 4(9), 793–801. doi:10.1111/2041-210X.12071 (2013).
- FAO (Food and Agriculture Organization of the United Nations). National Forest Inventory – Field Manual Template. FAO, Rome, Italy (2004).
- Kearsley E, de Haulleville T, Hufkens K et al. Conventional tree height-diameter relationships significantly overestimate aboveground carbon stocks in the Central Congo Basin. Nat. Commun. 4, 2269. doi:10.1038/ncomms3269 (2013).
- Flores O, Coomes DA. Estimating the wood density of species for carbon stock assessments. Methods Ecol. Evol. 2(2), 214–220. doi:10.1111/j.2041-210X.2010.00068.x (2011).
- Dexter KG., Pennington TD, Cunningham CW. Using DNA to assess errors in tropical tree identifications: how often are ecologists wrong and when does it matter? Ecol. Monogr. 80(2), 267–286. doi:10.1890/09-0267.1 (2010).
- Gomes ACS, Andrade A, Barreto-Silva JS et al. Local plant species delimitation in a highly diverse Amazonian forest: do we all see the same species? J. Veg. Sci. 24(1), 70–79. doi:10.1111/j.1654-1103.2012.01441.x (2013).
- Condit R. Tropical Forest Census Plots: Methods and Results from Barro Colorado Island, Panama, and a Comparison with Other Plots. Springer New York, NY, USA (1998).
- Bohlman S, O'Brien S. Allometry, adult stature and regeneration requirement of 65 tree species on Barro Colorado Island, Panama. J. Trop. Ecol. 22(02), 123–136. doi:10.1017/S0266467405003019 (2006).
- Goldstein A, Gonzalez G. Turning Over a New Leaf – State of the Forest Carbon Markets 2014. Ecosystem Marketplace, Washington, DC, USA (2014).
- Mokany K, Raison RJ, Prokushkin AS. Critical analysis of root:shoot ratios in terrestrial biomes. Glob. Chang. Biol. 12(1), 84–96. doi:10.1111/j.1365-2486.2005.001043.x (2006).
- Verified Carbon Standard. Validation and Verification Manual. Verified Carbon Standard, Washington, DC, USA (2013).
- Theilade I, Rutishauser E, Poulsen MK. Community assessment of tropical tree biomass: challenges and opportunities for REDD+. Carbon Balance Manage. 10, 17. doi:10.1186/s13021-015-0028-3 (2015).
- Holdaway RJ, McNeill SJ, Mason NWH, Carswell FE. Propagating uncertainty in plot-based estimates of forest carbon stock and carbon stock change. Ecosystems 17(4), 627–640. doi:10.1007/s10021-014-9749-5 (2014).
- García B. Local Governance, Anti-Corruption and REDD+ in Latin America and the Caribbean: Exploring Synergies to Strengthen Transparency and Accountability. United Nations Development Programme (UNDP), Washington, DC, USA (2011).
- Sears RR, Pinedo-Vasquez M. Forest policy reform and the organization of logging in Peruvian Amazonia. Dev. and Chang. 42(2), 609–631. doi:10.1111/j.1467-7660.2011.01697.x (2011).
- Finer M, Jenkins CN, Sky MAB, Pine J. Logging concessions enable illegal logging crisis in the Peruvian Amazon. Sci. Rep. 4719(4), 1–6. doi:10.1038/srep04719 (2014).
- Asner GP, Mascaro J, Muller-Landau HC et al. A universal airborne LiDAR approach for tropical forest carbon mapping. Oecologia 168(4), 1147–1160. doi:10.1007/s00442-011-2165-z (2012).
- Kronseder K, Ballhorn U, Böhm V, Siegert T. Above ground biomass estimation across forest types at different degradation levels in Central Kalimantan using LiDAR data. Int. J. Appl. Earth Obs. Geoinform. 18, 37–48. doi:10.1016/j.jag.2012.01.010 (2012).
- ISO (International Organization for Standardization). ISO 14065:2013 Greenhouse gases – Requirements for Greenhouse Gas Validation and Verification Bodies for Use in Accreditation or Other Forms of Recognition. ISO, Geneva, Switzerland (2013).
- Brown S. Measuring, monitoring, and verification of carbon benefits for forest-based projects. Philos. Trans. R. Soc. A Math. Phys. Eng. Sci. 360(1797), 1669–1683. doi: 10.1098/rsta.2002.1026 (2002).
- American Carbon Registry. The American Carbon Registry Validation and Verification Guideline. American Carbon Registry, Arlington, VA, USA (2012).
- Plan Vivo Foundation. The Plan Vivo Standard. Plan Vivo Foundation, Edinburgh, Scotland (2013).
- Verified Carbon Standard. Agriculture, Forestry and other Land Use (AFOLU) Requirements. Verified Carbon Standard, Washington, DC, USA (2013).
- Thompson ORR, Paavola J, Healey JR, Jones JPG, Baker TR, Torres J. Reducing Emissions from Deforestation and Forest Degradation (REDD+): transaction costs of six Peruvian projects. Ecol. Soc. 18(1), 17. doi:10.5751/ES-05239-180117 (2013).
Website
- Zanne AE, Lopez-Gonzalez G, Coomes DA, Ilic J, Jansen S, Lewis SL, Miller RB, Swenson NG, Wiemann MC, Chave J (2009). Data from: Towards a worldwide wood economics spectrum. Dryad Digital Repository. http://dx.doi.org/10.5061/dryad.234