
 ?Mathematical formulae have been encoded as MathML and are displayed in this HTML version using MathJax in order to improve their display. Uncheck the box to turn MathJax off. This feature requires Javascript. Click on a formula to zoom.
Abstract
Previous studies have confirmed the agricultural stage as an important contributor to total tea life cycle greenhouse gas (GHG) emissions. We therefore focus on the growing and processing of black tea and evaluate the GHG reduction potential of possible agricultural management interventions for tea produced from Unilever’s tea estates and factories in Kenya. A baseline GHG footprint was calculated using data collected over four years. Potential interventions to reduce the GHG footprint per kg of black tea focused on key drivers (yield and fertiliser use) of the GHG footprint. These interventions and their effects on production are evidence-based but hypothetical and relate to possible changes in: (1) Harvesting practices; (2) Fertiliser application (timing) and (3) Organic production. Improvements in fertiliser application and harvesting practices could potentially deliver 16% and 9% reduction in GHG emissions, respectively. Under favourable conditions (sourcing fertiliser locally and no yield decline), changing to organic production could theoretically deliver 25% reduction in GHG emissions. However, under less favourable conditions (European sourced fertiliser and 30% yield decline), GHG emissions could increase by 41%. The availability of locally sourced organic fertiliser, sufficient to maintain nitrogen application rates, is seen as the biggest challenge in delivering sustainable organic tea cultivation.
Introduction
Greenhouse gas (GHG) emissions from the agricultural stage of food production accounts for approximately 15% of global GHG emissions [Citation1, Citation2]. For companies seeking to reduce the GHG emissions associated with the production of their food and bio-based products, a focus on the agricultural stage is therefore important. In the context of company-level sustainable sourcing and GHG reduction commitments, Unilever is seeking to identify opportunities to reduce GHG emissions associated with its black tea growing and production operations. Only a few studies have quantified the GHG implications of implementing management interventions at the growing stage [Citation3–5] but they focused on organic farming and lacked consideration of other potential agricultural management interventions that could be employed in tea cultivation.
In this study, we include all aspects of the growing and production phases of black tea (including withering, maceration, oxidation, drying and sorting) to calculate a baseline GHG footprint for black (made) tea produced at Unilever’s eight tea estates and eight factories in Kenya, which are collectively known as Unilever Tea Kenya Ltd. (UTKL). We then evaluate the GHG reduction potential of several hypothetical agricultural management interventions which focus on key drivers of the GHG footprint. Kenya is the world’s third largest tea producer following China and India, producing 7.2% of world tea [Citation6]. As such, the results of our work may be pertinent across the Kenyan tea sector.
The interventions considered include: (1) Harvesting practices; (2) Fertiliser application (timing) and (3) Organic production. In addition, we consider the potential effect of combining the harvesting practices and fertiliser application.
Harvesting practices
Data driven precision agriculture, enabled by cheaper and better-connected sensors, has the potential to increase crop productivity and sustainability [Citation7]. Monzona et al [Citation8] demonstrated a 54% increase in yield on a farm growing maize, wheat, barley and soy, compared to neighbouring farms, using a zone management approach informed by soil and climatic variables and knowledge of crop responses. They argued that intensification of agriculture should focus on technologies based on processes and knowledge rather than increasing inputs, which would likely be less environmentally sustainable.
Tea is one of the most intensively managed crops grown; knowing when to harvest is key to optimising yield and quality. Harvest intervals are typically set according to the harvesting method used: for example, hand plucked fields are typically harvested every 14 days [Citation9], shear harvested fields every 17 days and mechanically harvested fields every 24 days. The harvest intervals are shorter with hand harvesting because the method involves selective removal of shoots with two to three leaves and a bud. Small shoots with one unfurled leaf are left on the bushes and these form the next cohort of two to three leaves and a bud that can be harvested two weeks later. In the less selective shear and mechanical harvesting method, more leaf is harvested, including the small shoots; it therefore takes longer for the bush to produce new shoots for the following harvest. However, environmental conditions such as solar radiation, temperature, rainfall and soil moisture can all influence the speed at which tea grows. Significant yield differences have been observed between tea clones in well-tended clonal field trials and the same clones grown in large tea estates. It is not unusual to see yields which are more than 50% higher in field trials (Supplementary S2.1. Table S10).
UTKL are piloting the use of a mechanistic shoot growth model, CUPPA Tea [Citation10], to forecast yield and green leaf quality from environmental data. This will enable smarter harvest scheduling, which is predicted to result in incremental yield improvements of 4% per annum. A compounded yield increase of 50% is therefore anticipated over a 10-year period. This would go a long way to closing the current yield gap in UTKL.
Fertiliser application
Smart fertiliser application could positively contribute to GHG mitigation in crop production [Citation11] with estimated reductions in fertiliser requirement from 4 to 37% in wheat [Citation12], and 4–46% in maize [Citation13]. For many crops, total N levels can be reduced by 20–40% with no loss of yield [Citation14] by targeting the application of fertiliser according to the specific needs of the crop locally within the field, using soil or vegetation sampling, proximal sensors or remote sensing data such as NDVI (Normalised Difference Vegetation Index) from drones or satellites to inform the rate required. In fertigation trials in Unilever’s Ngoina Estate from 2016, varying the rate of application (rather than reducing overall levels) was shown to increase tea yields significantly. Weekly application of the same total amount of N fertiliser resulted in a 23% boost in yield in a normal year (2016) and a 46% boost in yield in a drought year (vs. irrigation alone) for BB35 clonal tea (Supplementary S2.2. Table S11). Although tea cultivation in Kenya is mainly rain fed, this trial indicates the possible benefits of smart fertiliser application in areas where tea is routinely irrigated.
Organic production
Organic production has the potential to reduce GHG emissions, as demonstrated by Cichorowski et al [Citation4] for Indian Darjeeling tea cultivation. However, the GHG emissions from tea cultivation under organic management will depend significantly on yield. There is relatively little information on tea yields under organic cultivation. Where tea estates west of the rift valley in Kenya have been converted to organic cultivation, yield declines of up to 30% have been observed even when N application is maintained at the levels used in conventional production. In a study that primarily focussed on the advantages of using diammonium phosphate (DAP) enriched organic manure on tea yields in Kenya, Kamau et al. [Citation15] showed a ∼50% decrease in yield when comparing well-rotted sheep manure with DAP (at 180 kg N/ha) in Kericho (2009 and 2012) and a 30–50% yield decline when comparing cattle manure with DAP (at 150 kg N/ha) in Kangaita. Conversely, the Tea Research Institute (TRI) in Kenya reported no yield decline in organic field trials held over 12 years (2004–2005) at four different N levels [Citation16].
Methods
Greenhouse gas footprint of tea cultivation and black tea processing
The UTKL estates comprise approximately 14,000 hectares of land in the regions of Kericho and Limuru, including tea gardens, eucalyptus fuel wood plantations, factories, roads, housing and conservation areas. A baseline GHG footprint was conducted for tea grown in the UTKL estates and processed in the associated factories, following the PAS 2050 standard [Citation17, Citation18]. Tea cultivation, fuel wood cultivation and tea processing were included in the system boundaries (). The functional unit was “one kg of unpacked black tea at the factory gate”. Operational data for tea and fuel wood cultivation and black tea processing were obtained over 4 years (2012–2015).
Figure 1. Processes considered in the greenhouse gas footprint of black tea production at UTKL.
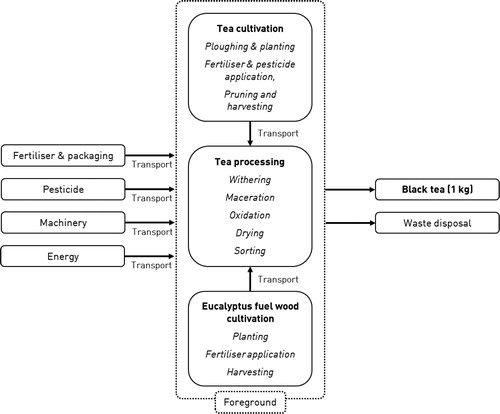
The scope and system boundaries are described in . Most capital goods (e.g. farm machinery, roads, boilers in factories) were included as part of the background system with data taken from the ecoinvent database (v3.4) [Citation19]. However, building infrastructure and specific factory equipment (such as withering beds and maceration equipment) were omitted due to lack of production data for these items; the implications for the GHG footprint are expected to be minor. In addition, potential carbon sequestration from land use change was omitted since the total area occupied by the estates has not changed over the last 20 years.
The GHG footprint for black tea (), expressed in kg of CO2-eq over a 100-year time horizon per kg of black tea at the factory gate is calculated for each year and site of production. It is described by EquationEquation (1)
(1)
(1) :
(1)
(1)
where,
is the conversion factor for emissions per kg of green leaf (wet weight) received at the factories to emissions per kg of black tea (moisture content as produced). This factor varies depending on site and year as given in Supplementary S1.4.1. Table S8. The GHG emissions associated with the cultivation and transport of a kilogram of green leaf (
) to the factory is expressed by EquationEquation (2)
(2)
(2) . For the fuel wood cultivation and transport to the factory (
), the GHG emissions were calculated based on the amount of wood required to process a kilogram of black tea expressed by EquationEquation (3)
(3)
(3) . The GHG emissions associated with energy use in processing green leaf to a kilogram of black tea (
) is expressed by EquationEquation (4)
(4)
(4) .
(2)
(2)
where,
are the activities associated with a hectare of green leaf cultivation and
are the GHG factors for those different activities.
is the yield of green leaf (kg/ha) for the different years and sites of production. Included is the transport of the green leaf to the factory (
) and the GHG factor for transport (
). The activities and yield are provided in Supplementary S1.1. Table S2.
(3)
(3)
where,
… are the activities associated with the production of fuel wood and
are the GHG factors for those different activities. Included is the transport of the fuel wood to the factory (
) and the GHG factor for transport (
). The activities are provided in Supplementary S1.1. Table S1 given per kg of black tea.
(4)
(4)
where,
… are the activities associated with energy use in processing green leaf to a kilogram of black tea and
… are the GHG factors for those different activities. The activities are provided in Supplementary S1.1. Table S1 given per kg of black tea.
The UTKL baseline (for both geographies and four years of production) was estimated by averaging the GHG footprint for the different years of production for each geography and then averaging the two geographies based on the average production volume of black tea for those four years (volumes were much greater at Kericho). The ratio of production for Kericho and Limuru is provided in Supplementary section S1.1. The UTKL baseline life cycle inventory to produce 1 kg of black tea is provided in .
Table 1. UTKL baseline life cycle inventory to produce 1 kg of black tea.
GHG emissions from cultivation and transport of green leaf tea
The GHG emissions from tea cultivation were calculated using data obtained directly from the tea estates and reflecting the following operations: ploughing for replanting of tea bushes (only at Kericho), fertilisation, pest management, pruning and harvesting and transportation of green leaf to tea factories (see Supplementary S1.2. for further detail).
Replanting, and thus ploughing, has only occurred at Kericho in the 4-year study period; all associated GHGs (CO2-eq) were calculated. Emissions associated with burning old tea bushes (firewood for cooking) by employees were not included as they fall outside the system boundaries considered for this study. GHG emissions from fertiliser use reflect the production of fertilisers (modelled using the Fertilizers Europe Carbon Calculator [Citation20]), transport to Kenya, fertiliser packaging, application by airplane in Kericho in 2015 and direct and indirect field emissions were calculated using the IPCC tier 1 approach [Citation21]. In addition to synthetic fertilisation, some nitrogen is supplied through tea pruning residues (Supplementary 1.2.7.). Tea bushes are pruned every four years to maintain the height of bushes to enable harvesting; the residues are left in the field. Field emissions of nitrous oxide (N2O) from residues were also calculated using the IPCC tier 1 approach [Citation21] and GHG emissions from the pruning activity were included (grouped with fuel use data provided for harvesting). The potential for soil organic carbon (SOC) sequestration from the application of organic matter (pruning residues) was not considered in this study due to lack of data and uncertainties in accounting. We believe this to be consistent with other studies (e.g. [Citation4] and the PAS 2050 GHG accounting standard [Citation17, Citation18], which only advocates inclusion of SOC in the context of land use change. GHG emissions from the manufacture of herbicides and fungicides were included, however, data on packaging and transportation of pesticides were not available and were therefore excluded. There were no emissions from application as pesticides were applied by hand. Harvesting was carried out both by hand and machine; in the case of the latter, associated GHGs were included.
Green leaf tea cultivated in the Kericho area was transported to tea factories using Unilever owned lightweight trucks (2–3 tonnes): associated GHG emissions were calculated. The transport of green leaf at Limuru was managed by a third-party. In the absence of third-party fuel use, emissions were based on the data from Kericho.
GHG emissions from cultivation and transport of eucalyptus fuel wood
The GHG emissions from eucalyptus fuel wood cultivation were calculated using data obtained directly from the tea estates and reflecting the following operations: fertilisation, harvesting (coppicing and tree felling), replanting and transportation of wood to tea factories (see Supplementary S1.3.). The associated GHG emissions were calculated.
The amount of eucalyptus fuel wood harvested in a given year was estimated based on the amount of fuel wood used in the factories. Trees are coppiced using chain saws every 10 years but on the third harvest (30 years) they are cut down. Saplings are then replanted by hand between tree stumps. A small amount of triple superphosphate fertiliser is added when planting, to aid propagation. The amount of fertiliser was estimated based on the number of trees planted in a given year. GHG emissions from fertiliser use reflect the GHG emissions associated with the production of the fertiliser (modelled using the Fertilizers Europe Carbon Calculator [Citation20]), transport, fertiliser packaging, and direct and indirect field emissions. There were no GHG emissions from application as the fertiliser was applied by hand. The GHG emissions associated with transportation of wood from the fields to the tea factories were included.
GHG emissions from processing of green leaf tea to black tea
The GHG emissions associated with processing at the eight Unilever tea factories in Kenya were calculated using production and utilities data obtained from Unilever’s internal Environmental Performance Reporting System [Citation22]. This system provides the amount of electricity from grid, hydroelectricity, light fuel oil, heavy fuel oil and fuel wood used to process (withering, maceration, oxidation, drying and sorting) green leaf to black tea at the different factories (Supplementary section S1.4.). Factory waste disposal including boiler ash and tea waste was also considered (Supplementary section S1.5.).
Management interventions
Plausible management interventions, focusing on key drivers of the GHG footprint, were identified (summarised in ). These management interventions relate to possible changes in: (1) Harvesting practices; (2) Fertiliser application (timing); and (3) Organic production. It was assumed that there would be no impact on tea quality from the interventions. The scale of change on yields was evidence-based (see 1.1, 1.2, 1.3 and Supplementary S2.1., S2.2., S2.3.).
Table 2. List of management interventions evaluation for their potential to reduce GHG emissions from tea cultivation.
The average GHG footprints for the different intervention scenarios were calculated using EquationEquation (1)(1)
(1) . The yield and fertiliser parameters were adjusted from the baseline, and pesticides were set to zero for the organic production (as described in Sections “Harvesting practices – improved harvesting”, “Fertiliser application -improved application”, and “Combining harvesting practices and fertiliser application”). We also provide an evaluation of the potential GHG reduction that might be achieved if the outcomes of some interventions were additive – though the likelihood of this is highly uncertain and results need to be interpreted with caution.
Harvesting practices – improved harvesting
The GHG emissions from tea cultivation, with harvest scheduling informed by a data driven decision support system, were calculated using the same approach and data as the baseline calculation for UTKL (given in Section “GHG emissions from cultivation and transport of green leaf tea”). However, for this intervention, a yield increase of 50% for green leaf production was considered (see 1.1), assuming optimising harvesting scheduling as described in Supplementary section S2.1. We also considered the need for extra nitrogen fertiliser (inorganic as in the UTKL baseline) to compensate for the additional yields (and nitrogen removal) resulting from harvesting practices. As the tea yield response to nitrogen varies due to factors such as variety, geography and weather [Citation23], the tea estates fertilise based on rules of thumb. Kamau [Citation24] suggests a removal of 35 to 45 kg N in harvested tea per 1000 kg black tea in Kenya, which equates to 1 kg of N per hectare for each additional 22.2 to 28.6 kg black tea produced. We considered 1 kg of N per hectare for each additional 25 kg of black tea produced. This equates to an additional 54.43 kg N per hectare on the UTKL baseline production.
Additionally, we considered scenarios with lower yield increases, with and without extra nitrogen application. These were included to show the effect of these assumptions on the GHG emissions resulting from the harvesting practices intervention.
Fertiliser application -improved application
The GHG emissions from tea cultivation with improved fertiliser application (e.g. weekly application) were calculated using the same approach and data as the baseline calculation for UTKL (given in Section “GHG emissions from cultivation and transport of green leaf tea”). However, for this intervention, a yield increase of 25% for green leaf production was included, which is at the lower end of the potential range of yield increases seen in field trials at UTKL (see section S2.2. in Supplementary). The amount of fertiliser applied was the same as in the baseline. No additional fertiliser was applied to compensate for the yield increase because we assumed that more frequent application results in more efficient uptake by tea plants. We therefore assumed the same energy and GHG emissions for fertiliser application as in the baseline scenario. This is valid assuming application is conducted by hand. However, we recognise that if more frequent application was conducted by plane, fuel use and associated emissions would increase: we are currently unable to quantify this potential effect.
Combining harvesting practices and fertiliser application
The GHG emissions from tea cultivation with improved harvesting practices and improved fertiliser application combined were calculated using the same approach and data as the baseline calculation for UTKL (given in Section “GHG emissions from cultivation and transport of green leaf tea”). However, for this combined intervention, a yield increase of 75% for green leaf production was included based on the assumption that the 50% for harvesting practices and 25% for fertiliser application are additive. As for the harvesting practices (given in Section “Harvesting practices – improved harvesting”), to compensate for the additional 50% yield increase, we factored in a requirement for an additional 1 kg of N per hectare for each additional 25 kg of black tea produced. This equates to an additional 54.43 kg N per hectare on the UTKL baseline production.
Organic cultivation
We assessed four scenarios assuming the same nitrogen application rate as the baseline: (1) a 30% reduction in yield with locally sourced fertiliser from Nairobi, (2) a 30% reduction in yield with fertiliser sourced from the Netherlands, (3) no change in yield with locally sourced fertiliser from Nairobi and (4) no change in yield with fertiliser sourced from the Netherlands. Fertiliser sourcing from the Netherlands was considered because local supply is unlikely to be sufficient and we were aware of producers in the Netherlands that can supply fertiliser for organic trials currently underway at UTKL. The inorganic fertilisers from the baseline were replaced with organic fertiliser consisting of dried poultry manure with 4.6% N content. Fertiliser application by hand was considered, since aerial application was considered unlikely: the higher volume of organic fertilisers would increase the cost of aerial application. Transport assumptions were updated as appropriate. Further, pesticide use was removed for the organic scenarios. As with other organic matter, the potential for SOC sequestration from the application of organic fertiliser was not considered.
Results
The results are presented in two parts: (1) current (baseline) GHG footprint for UTKL and (2) potential GHG footprints for management intervention scenarios.
GHG footprint of 1 kg black tea
The GHG footprints for the production of 1 kg of black tea from estates and factories around Kericho and Limuru for the production years 2012–2015 are shown in . The UTKL baseline GHG footprint from ‘cradle to factory gate’ was 1.08 kg CO2-eq./kg black tea. The GHG footprints varied from 0.98 to 1.26 kg CO2-eq./kg black tea primarily due to differences in the annual yields of green leaf, the use and type of fertiliser and the types of fuel used for green leaf processing. Fertiliser use (fertiliser production, fertiliser field emissions, and fertiliser other, which includes fertiliser packaging and packaging disposal, transport and application of fertilisers) is found to contribute most to the GHG footprint (73%), followed by fuel use in tea processing (11%), field operations for tea cultivation (ploughing, pesticide use, harvesting and transport of green leaf to factory) (8%), pruning residue field emissions for tea cultivation (6%), and cultivation of fuel wood (2%).
Figure 2. GHG footprints for 1 kg of black tea from estates and factories around Kericho and Limuru for production years 2012 – 2015. The UTKL baseline includes an error bar to represent the temporal variability seen for the different years of production.
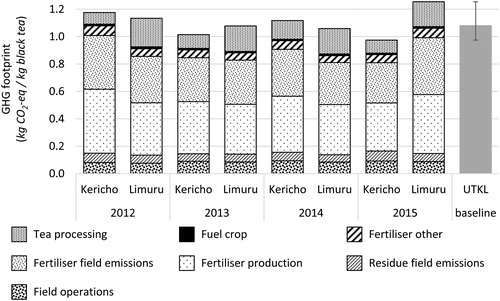
The average GHG emissions from fertiliser use in Kericho estates were greater than Limuru. This is due to differences in both the type and amounts of nitrogen fertiliser used as well as the application method. The main fertiliser used for tea cultivation is a compound fertiliser containing nitrogen, phosphorus and potassium (NPK), but at Limuru they use lower levels of this fertiliser in conjunction with some sulphate of ammonia fertiliser. The sulphate of ammonia production is associated with lower GHG emissions than for the production of the NPK fertiliser. Additionally, triple superphosphate was used in Kericho when replanting tea bushes. Fertilisers were manually applied at all sites and years except at Kericho in 2015, where 60% of the NPK fertiliser was applied by aircraft. However, this was responsible for only 0.1% of the GHG emissions for the UTKL baseline production of 1 kg black tea (0.5% for Kericho in 2015).
The GHG footprint of the field operations was primarily associated with transport of harvested green leaf from the field to tea factory and fuel use during harvesting. Other field operations included ploughing to prepare the ground for replanting tea bushes and production of herbicides and fungicides which are used in very limited quantities in Unilever’s tea estates and contribute less than 0.2% of total GHG emissions. The contribution from the application and decomposition of pruning residues on tea fields resulted in GHG emissions of a similar contribution to the other field operations.
The GHG emissions from green leaf processing were on average 80% higher at Limuru (0.19 kg CO2-eq per kg black tea) than Kericho (0.10 kg CO2-eq per kg black tea). In Limuru, a higher proportion of electricity used in the factory is sourced from the grid. Although according to the ecoinvent dataset used to model, the production of grid electricity in Kenya is primarily based on renewables (44% geothermal, 37% hydro run of river), which are associated with minimal GHG emissions, 18% is from oil which is associated with higher GHG emissions [Citation19]. In comparison, the tea factories at Kericho primarily use hydroelectricity generated on the Unilever estates.
GHG reduction potential from management interventions
The results are divided into two sections. Those for fertiliser application and harvesting practices and the combination of the two are given in Section “Fertiliser application and harvesting practices”. whilst those for organic production are given in Section “Organic production”.
Fertiliser application and harvesting practices
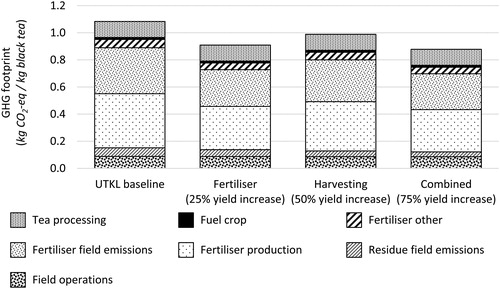
The improved fertiliser and harvesting scenarios demonstrate significant GHG reduction potential (). Compared with the UTKL baseline, GHG emissions are 16% lower for the fertiliser application (timing) and 9% lower for harvesting practices. Combining these two interventions has the potential for even greater GHG reduction potential, indicated at 19%. The result of the combined intervention may appear less than expected. This is because although there was a yield increase of 75% for green leaf production, as for the harvesting practices (given in Section “Harvesting practices – improved harvesting”), to compensate for the additional 50% yield increase, we factored in a requirement for an additional 1 kg of N per hectare for each additional 25 kg of black tea produced.
Figure 3. GHG footprint of fertiliser application (timing) and harvesting practices interventions.
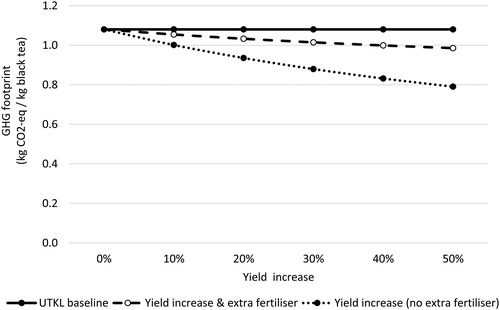
The results of the scenario analysis for the harvesting practices intervention are provided in . Assuming increased yields and extra fertiliser, GHG emissions are 2.4–8.8% lower, for yield increases of 10–50%; the equivalent range for the scenario with no extra fertiliser is 7.3–26.8% lower. This demonstrates that the extra fertiliser required to compensate for additional yields achieved through harvesting practices, substantially erodes the GHG reduction potential of the intervention.
Figure 4. GHG footprint of harvesting practices intervention, considering different yield and fertiliser scenarios.
Organic production
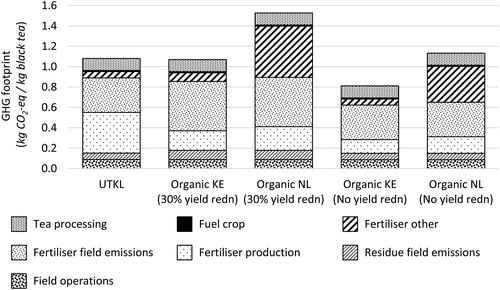
The impact of fertiliser production is lower for organic than conventional cultivation. However, field emissions associated with using organic fertiliser are still significant and transport of the fertiliser becomes more relevant. The GHG reduction potential associated with adopting organic production () largely depends on the estimated yield reduction and the source location of the organic fertiliser. When fertiliser is sourced locally and there is no decline in yield, GHG emissions could be reduced by 25%; however, yield reductions of 30% negate this benefit almost entirely (1% GHG reduction vs. baseline). Where organic fertiliser is sourced from the Netherlands, GHG emissions for those organic scenarios are always higher than the baseline: with no yield decline, GHG emissions are 5% higher than the baseline, whilst with a 30% yield decrease, GHG emissions are 41% greater. The greater GHG emissions result from the transport of large volumes of fertiliser over long distances compared to the locally sourced organic fertiliser. Additionally, high GHG emissions are associated with electricity use in the poultry pelleting process in the Netherlands. In the best-case scenario (locally sourced fertiliser and no yield decline) the reduction is primarily driven by a reduction in emissions associated with the production of the fertilisers. Additional benefits of potentially shorter distances for fertiliser transport to the tea estates are counterbalanced by an increase in emissions associated with trucking the greater volume of organic fertiliser.
Figure 5. GHG footprint of black tea from organic tea cultivation.
Discussion
The UTKL baseline GHG footprint for current production of one kg of black tea (1.08 kg CO2-eq) is at the lower end of literature values for Kenyan tea production which range from 0.76 kg CO2-eq for large-scale production and 0.89 CO2-eq for small-scale production [Citation25] to 7.72 kg CO2-eq per kg Kenyan black tea in ecoinvent [Citation19]. Our study considers large-scale tea production on eight estates. The UTKL footprint is higher than both large and small-scale tea production given in Azapagic et al. [Citation25] due to greater inputs of fertiliser and inclusion of field emissions associated with application of pruning residues. Moreno et al. [Citation19] report a country average GHG footprint six times greater than the UTKL footprint. This country average result was driven by emissions associated with land use change (78% of the total GHG footprint) and also included emissions related to pumping water for irrigation (12%). We did not include LUC in our main analysis since the total land area of the estates has not changed in the last 20 years: nor did we include irrigation as this is not common practice for Kenyan tea production. Excluding these aspects from the figure provided by Moreno et al. [Citation19] gives a GHG footprint of 0.77 kg CO2-eq per kg of black tea. This is lower than the UTKL baseline, due to the assumption that organic fertilisers (animal by-products with little or no associated impact) deliver 20% of the nitrogen demand (J Lansche 2018, Agroscope, personal communication 18 October). Processing of green leaf to black tea was not included either. Kenyan tea production has lower greenhouse gas footprints than those found in studies for other countries: 1.58 kg CO2-eq per kg black tea from Sri Lanka in ecoinvent [Citation19], and 5.27 kg CO2-eq per kg black tea from China in ecoinvent, 7.63 kg CO2-eq per kg black organic tea in India [Citation4] and 8.70 kg CO2-eq per kg black organic tea in China [Citation3]. These studies indicate significantly lower yields both in terms of green leaf cultivation and black tea processing than those in Kenya, coupled with different levels of fertiliser input. Despite the relatively low GHG footprint of UTKL tea production, we found the potential for further reductions through a variety of management interventions.
Fertigation field trials carried out in UTKL suggest that weekly application of fertiliser could result in a significant yield increase (ca. 25%) without increasing fertiliser application per year. Here we show that such an increase in yield would result in a 16% reduction in GHG production. Although this could theoretically be achieved relatively quickly, this hypothetical increase is based on limited field trial data and might be difficult to scale up in Kenya where tea is predominantly rain fed. In the trials, nitrogen was applied by fertigation, but in UTKL, weekly application would need to be done by hand/plane, which would be costly and likely impractical. A more practical approach to GHG mitigation might be to adopt data driven precision agriculture. UTKL are piloting the use of a decision support system (DSS) to maximise yield and quality through optimised harvest scheduling. At the core of the DSS is a mechanistic crop model (CUPPA) driven by real time weather data and informing shoot growth. Although greater increases in yield are anticipated in the longer term (50% over ten years) this would require a sustained investment in: (a) technology (sensors, connectivity and Internet of Things); (b) refinement of crop models; (c) integration of new data (e.g. weather forecast and remote sensing data; and (d) up-skilling of estate managers. The longer time horizons for adoption of smart harvest scheduling are based on conservative assumptions but with sufficient investment benefits might be realised sooner. Incremental yield benefits would be expected to be realised throughout the implementation period, with potential for a 9% reduction in GHG emissions overall. If the fertiliser application and improved harvest scheduling interventions were combined, we have shown that a total reduction in the GHG footprint of 19% is theoretically possible, although realising the cumulative benefits of combining these interventions might be challenging since the interventions are challenging to achieve individually, as described above.
The inclusion of organic production in this study demonstrates the potential to deliver up to 25% reduction in GHG emissions. However, this is predicated on yield maintenance whilst holding nitrogen application at the levels currently seen in conventional production (baseline) and assuming local fertiliser sourcing. This is a highly optimistic assumption [Citation26, Citation27], included to indicate the maximum theoretical improvement. In a scenario where yields decrease by 30% when using the same amount of nitrogen as in the baseline, a 1% GHG reduction can be anticipated as long as fertiliser is sourced locally. In this study when the organic fertiliser is sourced from the Netherlands there is a potential 41% increase in GHG emissions when yields are not maintained and even when the yield is maintained there is still a 5% increase compared to the baseline. The selection of organic fertiliser type and possible geographical sources was based on consideration of availability, quality and practicalities of application. However, further analysis of local organic fertiliser sources for use in tea production is recommended, otherwise the likelihood of maintaining yields in organic systems could be jeopardised if the costs of procuring and transporting fertiliser are too high. Further, yield variability is likely to be high unless the availability of fertiliser N can be maintained [Citation26]. The rapeseed meal used in Xu et al. [Citation3] had similar nitrogen content but unfortunately its production is associated with high GHG emissions whereas the press cake from neem oil production used in Cichorowski et al. [Citation4] and the poultry manure considered in this study are by-products with lower GHG emissions.
In this study, the modelling of interventions was based on current climate conditions and we did not consider potential impacts on yield resulting from climate change. The FAO/Tea Research Foundation [Citation28] have projected that impacts of climate change, such as drought, can potentially reduce the suitability of tea cultivation areas in Kenya by up to 21% after the year 2075. The anticipated yield and GHG footprint improvements achieved from management interventions may not be fully met in reality if the impacts of climate change are seen sooner. In addition, we have not considered potential consequences that extend beyond our system boundaries. Depending on market elasticities, a decline in Kenyan tea production, potentially induced by conversion to organic management practices or climate change impacts, may stimulate additional production elsewhere: this could be met through intensification or expansion, potentially bringing natural lands into cultivation. Either outcome could lead to increased greenhouse gas emissions in the global agricultural production system [Citation29, Citation30]; further work would be required to quantify such effects.
Conclusions
This paper quantifies greenhouse gas emissions of tea production in UTKL estates and identifies management interventions with the potential to reduce the GHG footprint. In total, three interventions were identified and analysed: (1) Harvesting practices; (2) Fertiliser application (timing) and (3) Organic production. Management interventions such as improving fertiliser application and improving harvesting have the potential to reduce the GHG footprint significantly. Organic production has the potential to reduce the GHG footprint only if yields are maintained and if fertiliser transport distances are kept to a minimum.
We believe that the management interventions considered here could be effective across the tea sector in different regions (perhaps to varying degrees). However, their implementation requires time, specialised know-how and initial capital investment (e.g. sensors). Wider deployment and monitoring of these interventions should be supported by government and or sector-level initiatives to help with financing and knowledge dissemination.
tcmt_a_1840872_sm6918.docx
Download MS Word (154.7 KB)Acknowledgments
The following people are gratefully acknowledged for their help in providing data from UTKL estates: Charles Kirui and Moses Terer.
Disclosure statement
No potential conflict of interest was reported by the author(s).
References
- IPCC. Climate Change 2014: Synthesis Report. Contribution of Working Groups I, II and III to the Fifth Assessment Report of the intergovernmental panel on climate change. In: Pachauri RK, Meyer LA, editors. Geneva, Switzerland: IPCC; 2014. 151 pp.
- Poore J, Nemecek T. Reducing food’s environmental impacts through producers and consumers. Science. 2018;360(6392):987–992. doi:10.1126/science.aaq0216.
- Xu Q, Hu K, Wang X, et al. Carbon footprint and primary energy demand of organic tea in China using a life cycle assessment approach. J Cleaner Prod. 2019;233(2019):782–792. doi:10.1016/j.jclepro.2019.06.136.
- Cichorowski G, Joa B, Hottenroth H, et al. Scenario analysis of life cycle greenhouse gas emissions of Darjeeling tea. Int J Life Cycle Assess. 2015;20(4):426–439.
- Doublet G, Jungbluth N. 2010. Life cycle assessment of drinking Darjeeling tea. Conventional and organic Darjeeling tea. [Online] [accessed 2019 Jan 28]. Available from: http://esu-services.ch/fileadmin/download/doublet-2010-LCA-Darjeeling-tea-1.0.pdf.
- FAOSTAT. 2017. Crop production data 2017. [accessed 2019 Sept 6]. http://www.fao.org/faostat/en/#data/QC.
- Vasisht D, Kapetanovic Z, Won J, et al. 2017. FarmBeats: An IoT platform for data-driven, agriculture Networked Systems Design and Implementation (NSDI).
- Monzon JP, Calviño PA, Sadras VO, et al. Precision agriculture based on crop physiological principles improves whole-farm yield and profit: A case study. Eur J Agron. 2018;99:62–71.
- Burgess PJ, Carr MKV. The use of leaf appearance rates estimated from measurements of air temperature to determine harvest intervals for tea. Ex Agric. 1998;34(2):207–218.
- Matthews RB, Stephens W. CUPPA-Tea: A simulation model describing seasonal yield variation and potential production of tea. 1. Shoot development and extension. Ex Agric. 1998;34(4):345–367.
- Balafoutis A, Beck B, Fountas S, et al. Precision agriculture technologies positively contributing to GHG emissions mitigation, farm productivity and economics. Sustainability. 2017;9(8):1339–1328. doi:10.3390/su9081339.
- Tekin AB. Variable rate fertilizer application in Turkish wheat agriculture: Economic assessment. Afr J Agric Res. 2010;5:647–652.
- Koch B, Khosla R, Frasier WM, et al. Economic feasibility of variable-rate nitrogen application utilizing site-specific management zones. Agron J. 2004;96(6):1572–1580.
- Cleary D. 2017. Precision agriculture: Potential and limits. [Online] [accessed 2019 Jan 28]. Available from: https://global.nature.org/content/precision-agriculture-potential-and-limits.
- Kamau DM, Kekana V, Sitienei K, et al. 2015. Prospects for organic tea farming in Kenya: Two case studies. Proceedings of the First International Conference on Tea Science and Development. Tea Research Foundation of Kenya. http://karuspace.karu.ac.ke/handle/20.500.12092/1823?show=full.
- Nyabundi KW, Wanyoko JK, Boiwa MC. Effects of compost manure on tea yields, black tea quality and soil health. Tea. 2016;37(1/2):88–94.
- BSI. PAS 2050:2011. Specification for the assessment of the life cycle greenhouse gas emissions of goods and services. London (UK): British Standards; 2011.
- BSI. PAS 2050-1:2012. Assessment of life cycle greenhouse gas emissions from horticultural products. London (UK): British Standards; 2012.
- Moreno RE, Valsasina L, Fitzgerald D, Brunner F, et al. Documentation of changes implemented in the ecoinvent data-base v3.4. Zurich, Switzerland: Ecoinvent; 2017.
- Fertilizers Europe. 2018. Fertilizers Europe “Carbon Footprint Calculator for fertilizer products” v2.0. [Online] [accessed 2018 July]. Available from: http://www.calcfert.com/.
- IPCC. Agriculture, forestry and other land use (Chapter 11). In: 2006 IPCC guidelines for national greenhouse gas inventories. Vol. 4. Geneva, Switzerland: IPCC; 2006. https://www.ipcc-nggip.iges.or.jp/public/2006gl/pdf/4_Volume4/V4_11_Ch11_N2O&CO2.pdf.
- Unilever. 2018. Unilever’s environmental performance reporting system. [Internal] [accessed 2018 October].
- Carr MKV. 2018. Advances in tea agronomy. Cambridge: Cambridge University Press.
- Kamau DM. 2008. Productivity and resource use in ageing tea plantations [Ph.D. thesis]. The Netherlands: Wageningen University, p. 140.
- Azapagic A, Bore J, Cheserek B, et al. The global warming potential of production and consumption of Kenyan tea. J Cleaner Prod. 2016;112:4031–4040.
- Seufert V, Ramankutty N. Many shades of gray-The context-dependent performance of organic agriculture. Sci Adv. 2017;3(3):e1602638. doi:10.1126/sciadv.1602638.
- Clark M, Tilman D. Comparative analysis of environmental impacts of agricultural production systems, agricultural input efficiency, and food choice. Environ Res Lett. 2017;12(6):64016. doi:10.1088/1748-9326/aa6cd5.
- FAO/Tea Research Foundation. 2013. Analysis of links between climate variables and tea production in the recent past and gis analysis of tea suitability under future climate change scenarios. [Online] [accessed 2019 Apr 2]. Available from: http://www.fao.org/fileadmin/templates/est/Climate_change/kenya/Navaisha_wkp_1/FAO_TRFK_CHESEREK_climate_scenarios_and_tea.pdf.
- Searchinger TD, Wirsenius S, Beringer T, et al. Assessing the efficiency of changes in land use for mitigating climate change. Nature. 2018;564(7735):249–253. doi:10.1038/s41586-018-0757-z.
- Smith LG, Kirk GJD, Jones PJ, et al. The greenhouse gas impacts of converting food production in England and Wales to organic methods. Nat Commun. 2019;10(1):4641. doi:10.1038/s41467-019-12622-7.