?Mathematical formulae have been encoded as MathML and are displayed in this HTML version using MathJax in order to improve their display. Uncheck the box to turn MathJax off. This feature requires Javascript. Click on a formula to zoom.
Abstract
Environmental policy in the European Union is a hot topic for both practitioners and researchers. Their interests are attracted mainly by the main tool of this policy—emissions trading within the EU ETS. In literature focusing on the impacts of the EU ETS, the EU is usually considered to be a compact unit and its structure is omitted there. In particular, the impacts on a single company (regardless its geographical location), on a sector of industry (regardless the member countries), or on some subset of the involved companies with respect to non-EU competitors are often explored. However, through the eyes of national governments, it is vital for the countries to keep their national industrial sectors competitive not only against companies from countries outside the EU but also from other EU countries. This paper focuses on the influence of the EU ETS on the national steel sectors in the EU and their competitiveness. The hybrid PROMETHEE-DEA approach is used to assess how the price of emission allowance and grandfathering within the EU ETS impact the technical efficiency and competitiveness of these national sectors. The results of this study show that the volatile allowance price influences the efficiency and grandfathering affects the competitiveness of the EU national steel sectors.
SUBJECT CLASSIFICATION CODES:
1. Introduction
Since 2005, the EU ETS (European Union Emissions Trading Scheme) has been the main tool of the EU environmental policy. In essence, this system obliges EU industrial companies to cover their greenhouse gas emissions (mainly CO2) by special financial instruments called emission allowances (EUA; European Union Allowance). The EU ETS is based on quantity regulation (in contrast to the price-based regulation using emission taxes). The desired emission reduction is ensured by the cap of available allowances in the system, which decreases year by year. Despite the rules of the EU ETS has been changed many times, see, e.g. [Citation1–3], its two main factors determining the impact on companies persist: EUA price (this price is not fixed, but random and influenced by many factors, see [Citation4–6]), and quantity of free allowances allocated to the companies (so-called grandfathering). The former influences the emission costs of a company directly, meanwhile the latter impacts the emission costs through the number of allowances, which must be purchased. Despite the success of the EU ETS with respect to CO2 reduction has been disputed by many studies before (especially for an oversupply of allowances, non-flexibility of the cap to changes in demand and overlapping regulations with other tools of the EU climate policy, see [Citation7,Citation8]), managers of the participating companies should be always vigilant about the impact of the system on their business [Citation9].
Efficiency can be defined as a desired ability of a subject to transform inputs to outputs in the best possible way, i.e. not to use more inputs to get the same or greater amount of outputs [Citation10]. It is in the interest of not only each company but also governments to reach efficiency. Especially in the case of strategic sectors, the national governments are usually active when defending their self-sufficiency and competitiveness [Citation11]. Without any doubt, the steel industry belongs to the group of strategic industrial sectors. It is a source of input materials for many other sectors like the construction industry, automotive industry, transport and heavy engineering, etc. Even for the future, the role of steel seems to be irreplaceable—also the popular trends toward sustainable development like smart cities, renewable energies, sustainable infrastructure, etc., require a lot of steel [Citation12].
On the other hand, the steel industry is an emissions-intensive sector with a not negligible impact on the environment. Therefore, it is reasonable to expect a significant influence of the EU ETS on this sector. This expectation is even supported by assignment of the sector to the so-called carbon leakage group, i.e. the group of the sectors where is the danger of displacement of companies from the EU to the countries with not so strict environmental policy [Citation1,Citation13]. The efficiency of the steel companies and sector(s) has already been explored many times before [Citation14–16], but no study focused on the impact of emissions trading and analysed the steel sectors within the EU.
Many researchers analysed the impacts of emissions trading on the competitiveness of the EU steel sector as a whole [Citation17,Citation18], or only a single company [Citation4,Citation19]. Although the EU steel installations are often in the hands of multinational corporations, there are reasons why to analyse them not according to their owner, but their geographical location. First, the competitiveness of the national sectors is monitored by the national governments and national steel associations carefully and possibly influences their negotiating position. Second, the steel companies are usually important employers and their performance can substantially impact the rate of unemployment in the region. Third, due to the already mentioned material flows from the steel industry to other industrial areas, the presence of steel companies and related better availability of steel products can help and support also other industries.
It is worth mentioning that the analysis would be very beneficial also at the company level, however, the necessary data are not available from the annual reports published by the companies.
With respect to the facts written above, this paper explores the impact of emissions trading on the efficiency of the EU national steel sectors. Namely, three main questions are given here:
Does the EU ETS influence the efficiency of the EU national steel sectors?
What is the impact of the EUA price on the efficiency of the EU national steel sectors?
What is the impact of grandfathering on the competitiveness of the EU national steel sectors?
The last question does not consider the impact on the efficiency, but the competitiveness instead. When following the definition of the efficiency provided above, each factor influencing the quantity of either inputs or outputs, can impact the efficiency. Thus, the impact of grandfathering on companies’ efficiency is possible, but its impact is indirect through the total emission costs. Since the third trading phase (2013–2020), free allowances are allocated based on historical emissions in the previous trading phases and the product benchmarks, which are set at the average emission level of the 10% most efficient installations within each sector [Citation20]. According to [Citation20], “Installations that are highly efficient should receive all or almost all of the allowances they need to comply with EU ETS obligations. Inefficient installations have to make a greater effort to cover their emissions with allowances, either by reducing emissions or by purchasing more allowances.” However, this perception of the efficiency is related only to the emissions released and does not fully correspond to the approach in this study. There is also another fact which makes grandfathering special among other factors explored. The free allocations are predetermined in advance. Thus, all assets would compete on the same playing field, the allowance price would provide the same opportunity cost for mitigating pollution, and in theory, the output price of the goods sold would incorporate the price signal for consumers [Citation21,Citation22]. In this study, the impact of the emissions trading on the performance is assumed only through the emission costs, and not (at least not directly) through the quantity of CO2 emissions or the pass-through effect (the ability of the companies to pass through some part of their emission costs to the customers through the output prices) identified by [Citation22,Citation23]. Anyway, for the reasons mentioned above, the connection of grandfathering with the efficiency of the national steel sectors can be considered counterintuitive and misleading. Therefore, the effect of the free allocation on the competitiveness is explored (i.e. whether grandfathering can be a source of the comparative advantages or disadvantages).
All the given research questions are answered using the quantitative assessment model and the latest relevant data available.
The paper is organized as follows. This introduction is followed by Sec. 2 focused on the state-of-the-art analysis. In Sec. 3, a theoretical background for efficiency measuring using the hybrid PROMETHEE-DEA approach is briefly provided. Section 4 is devoted to the structure of the evaluation model and the input data. The results of the analysis are presented in Sec. 5. In Sec. 6, the main conclusions of the paper are summed up.
2. The state of the art
This section provides a state-of-the-art analysis, which proves the gap identified in the introduction. First, the focus is placed on the efficiency evaluation in the iron and steel sector. Second, the relationship between the EU ETS and the steel sector is analysed.
Efficiency assessment of the industrial sector is a usual topic for both researchers and practitioners, and the steel sector does not stand aside. Several models published so far can be found. These studies differ in many attributes like a type of efficiency, units considered, criteria for evaluation, methods used, time period, etc.
As for the type of efficiency, it simply depends on what is the aim of the evaluation, i.e. where the author puts a focus. In general, if the aim is to assess how efficiently inputs are transformed into outputs, we talk about technical efficiency in general. However, if a special emphasis is put on some particular factor (or group of factors), we can distinguish also, e.g. energy efficiency (focusing on energy consumption), economic efficiency (focusing on economic factors), or environmental efficiency (focusing on environmental impacts). All these efficiency types have already been explored for the iron and steel industry, see . In this paper, all types of attributes of the steel production are included (energy consumption, economic factors and environmental factors), thus the decision-making units will be tested on the technical efficiency without any further distinction.
Table 1. Other studies focused on efficiency of the steel industry and their selected properties.
The iron and steel sector can also be analysed at different levels in terms of what units are considered. Three different levels can be found in the literature. The first option is to analyse the efficiency within a single installation/company, where it is possible to assess technologies and sub-processes, see [Citation4,Citation19]. The second option is to analyse a set of installations and compare their efficiency, see [Citation25,Citation32]. The last usual option is to evaluate the iron and steel sectors based on the geographical location (for regions or countries) [Citation15,Citation28,Citation29]. In line with the research objective defined in the introduction, this study works with the latest option, namely, with the EU national steel sector. This is supported by the following facts. It is usual that products coming from different countries have some (expected) reputation (like in the case of Swedish steel), given by, e.g. used raw materials and technologies used. Moreover, the steel companies can impact significantly the rate of unemployment in a given country and also the quality of the environment in this country. On the other hand, it would be possible to extend the analysis to the enterprise level, but this would require the input data, which are not available to public.
As for the methods used for the efficiency evaluation, authors of studies focusing on the steel industry usually choose between two most popular methods: non-parametric Data Envelopment Analysis (DEA) and parametric Stochastic Frontier Analysis (SFA), see . In this paper, the method based on a combination of the PROMETHEE multi-criteria decision-making method and DEA proposed by Ishizaka et al. [Citation33] is used. This choice is supported by the following reasons. Unlike the SFA, it is not an econometric-based method, assuming special assumptions on input data, see [Citation34]. Unlike the (pure) DEA, the results of the analysis can be always displayed graphically and it is easy to handle even negative values and undesirable outputs (both are used in this paper). Moreover, the PROMETHEE method is perfectly traceable and allows for easy stress-testing analyses. Further, the DEA method is applied to the results of the PROMETHEE analysis to get the inefficiency measure.
reveals that most of the efficiency analyses where the authors include environmental factors were performed for Chinese input data and environment. But these models cannot be automatically adopted for the EU, because the EU ETS has its specific rules. In fact, a deep efficiency analysis of the EU national steel sectors including the influence of the EU ETS is missing.
As for the factors for the steel industry coming from the EU emissions trading, one can take lessons from [Citation4,Citation17] or [Citation34]:
Emission price—the EU ETS is a cap-and-trade system, thus the emission price is given by the market and changes in time. But, the price itself cannot be used to assess the efficiency since it is the same for all the countries (sectors).
Grandfathering—the number of allowances allocated to each company (and whole national sector together) for free. This factor has already been discussed in introduction. The free allocation influences the number of allowances that must be purchased, and thus the costs of emissions trading too.
Current emissions (emissions for the time period for which the efficiency is assessed)—emissions bring two basic problems to industrial companies. First, they decrease the environmental efficiency (they are undesirable outputs). Second, they also decrease the economic efficiency because they increase the emission costs.
Technological equipment—some processes can be done using different technologies (greener, modern, technologies producing less emissions). To some extent, this factor is also already included in grandfathering via the product benchmarks, see the rating process and the benchmark factors [Citation35].
In fact, all 5 factors mentioned above can be aggregated into a single one: emission costs, i.e. how much a company (or all companies at a given sector) will pay for necessary allowances under the current trading rules and emission price. To get a reliable result, it is necessary to realize that this factor is random (it changes with the emission price).
Based on the facts revealed in this section, the technical efficiency of the EU steel sectors is analysed using the latest available data and considering the stochastic emissions costs caused by the EU ETS in this paper.
3. Promethee-DEA methodology
The first use of the PROMETHEE-DEA hybrid approach for efficiency evaluation has been published by Ishizaka et al. [Citation33]. This approach combines the popular PROMETHEE multi-criteria decision-making method established by Brans, Vincke and Mareschal [Citation36] and the popular DEA method established by Charnes, Rhodes and Cooper [Citation37]. In the first step of the algorithm, the performance of each unit in terms of inputs and outputs is derived using the PROMETHEE method. Thus, each unit is identified by two aggregated values, which allow for a graphical analysis and identification of the efficient frontier. Then, the DEA method is used to measure the L1 distance between the units and the efficient frontier, which quantifies “how much inefficient” each unit is.
Because the PROMETHEE algorithm has already been described many times in the literature, only a brief description of the method is provided here. Interested readers are referred to [Citation33], or [Citation36] for further mathematical details. Let us have the set of units, which are to be evaluated (e.g. sectors, companies, etc.), and factors, which are used as criteria for this evaluation.
Step 1: As usual in efficiency evaluation, all factors are split into two subsets—inputs and outputs.
Step 2: All pairs of the considered units are mutually compared in terms of each factor separately using the so-called preference function, which assigns a degree (between 0 and 1) at which a decision-maker prefers the unit with a better performance. The crucial task for the decision-maker here is to choose the most suitable type of the preference function for each factor (if the preference degree increases with the difference in performances linearly or not, if some small differences are neglected in terms of preferences, etc.).
Step 3: The preference degrees are aggregated together for all the inputs and outputs separately. This aggregation is done using the weighted sum of the performances and the weights of the factors. When evaluating the efficiency, there is no reason to set different weights for the factors, therefore, the weights are set equal for all the factors.
Step 4: The aggregated values from Step 3 are further aggregated using the arithmetic mean to the positive flows and negative flows for inputs/outputs for each unit. The positive flow expresses how much better the unit under consideration is, compared with all other units in inputs/ouputs. And the negative flow evaluates how much better the other units are, compared to the unit under consideration.
Step 5: The negative flows are subtracted from the negative flows and aggregated to so-called net flows of inputs and outputs. Now, each unit is identified by the net flow of inputs and the net flow of outputs, and can be displayed graphically it in the plane, see .
Figure 1. Visual interpretation of the PROMETHEE-based efficiency evaluation.
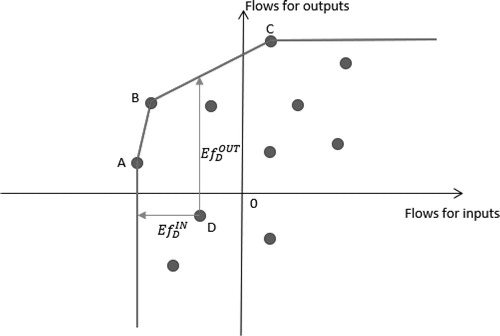
Step 6: It is easy to find the units, which are efficient (i.e. for which there is no other unit with a better value for inputs and outputs at the same time) in the graph, see where the units A, B, C are efficient (the efficient frontier is depicted as red). D is not efficient and its degree of inefficiency is given by
for outputs and
In line with [Citation33], the additive DEA model with variable returns to scale is used to measure the L1 distance of each unit to the efficient frontier (the distance is indicated by the green lines for the unit D in ). Namely, the optimization model (1a)–(1e) measures the horizontal distance to the efficient frontier (how much the net flow of inputs must be improved to become efficient), and the model (2a)–(2e) measures the vertical distance to the efficient frontier (how much the net flow of outputs must be improved to become efficient):
(1a)
(1a)
(1b)
(1b)
(1c)
(1c)
(1d)
(1d)
(1e)
(1e)
(2a)
(2a)
(2b)
(2b)
(2c)
(2c)
(2d)
(2d)
(2e)
(2e)
where
and
represent the horizontal and vertical distance of the
th unit to the efficient frontier, respectively,
is an automatically assigned weight of the
th unit,
stands for the number of units. A unit is efficient if and only if at least one of the calculated distances is equal to zero, i.e. when it lies at the efficient frontier.
The algorithm described above assumes all the input data precise (deterministic). However, as mentioned in Sec. 2, this does not apply to all factors in this paper. Namely, the emission costs in a given year are strongly dependent on the allowance price, which is random (i.e. influenced by random factors) and changes every day. If a company is lucky, it sells the allowances for the highest price and, the other way around, it purchases the allowances for the lowest price. Due to very troublesome predictability, such situation is impossible in fact and it would be purely a stroke of luck [Citation5]. Unlike the pure DEA, which exists also in its stochastic version (see [Citation38]), the PROMETHEE has not been extended to the stochastic environment yet. Therefore, a simulation approach, assuming the empirical distribution of the random emission costs, is used here. Namely, the net flows in PROMETHEE are calculated for each value of the random variable (scenario), which occurred during a given time period with the corresponding probability. Then, the results show the probability with which a unit is efficient for which values of the emission price the unit is efficient, and also it is possible to calculate what should happen with the performance of a sector in a particular factor to become efficient.
4. The structure of the evaluation model and the input data
The first part of this section provides an analysis and selection of the factors (inputs and outputs) included into the final model. The second part is devoted to the description of the input data—their specifics, sources and preprocessing.
4.1. The evaluation model
The state-of-the-art analysis performed in Sec. 2 showed that many studies, from which one can learn a lesson, exist. It is worth emphasizing that the aim of this paper is to make the analysis of the national industrial sectors, not for individual companies, and the factors must be selected accordingly. The results of this study are potentially more interesting for local governments and the national steel associations, than for the companies themselves. The results will bring evidence of the current state in a national steel sector and how strongly the EU ETS effects this steel sector in comparison with others.
In the past studies, many different inputs and outputs have already been considered, see .
Table 2. Factors used in other studies exploring the efficiency in the steel industry.
The inputs with ID 2, 4, 5, 6 and 8 are not relevant for this study. They correspond mainly with the companies (owners), not with the countries forhe installations are located, and they are either not applicable (like the age of a company), or the data relevant for the national sector are not available (e.g. international enterprises do not publish the data on the net fixed capital for each country/installation separately). Thus, only three possible inputs remain: energy consumption, number of employees and price of labour. Despite the price of input material is an extremely important factor for each producing company, it can be assumed that the price of, e.g. raw iron, is the same for all the sectors because there are only a few destinations from which these materials are imported. As for the amount, type and quality of the input materials used, the necessary data are not available.
Energy is one of the most crucial inputs in iron and steel processing. Its consumption influences not only the final costs of production but also the environmental costs (the energy consumption impacts the number of grandfathered allowances to the companies). Naturally, the less energy consumption, the better for the efficiency.
Two remaining factors (number of employees and costs of labour) are related to the labour market—number of employees and their (average) costs. For fiscal policy makers, the steel industry is a very important source of work places. Usually, the installations are situated in the regions focused on industry (like Silesia in Poland, Northern Moravia in the Czech Republic, or the Kosice region in Slovakia) where a substantial number of people are employed in heavy industry, especially in the steel industry and other industries, which are often either suppliers or customers of the steel industry. If the aim of this paper was to assess the efficiency of companies within a single region, it would be useless to include the price of labour because its value would be the same for all the companies. But when assessing the national sectors, it is reasonable to take the costs of workforce into consideration because it differs a lot in the EU countries. The less and cheaper employees for the identical values of outputs, the better.
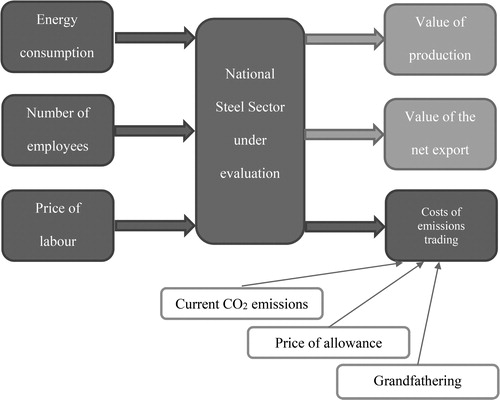
To summarize, three inputs are included in the model in this paper: consumption of energy, number of employees, price of labour.
Next, let us focus on the outputs. Here, the situation is not so complicated because the past studies all agreed on production—production of manufactured products and production of wastes. They differ in the level of detail—some of them work with quantities of all the products aggregated together, some of them distinguish different types of products and some of them also distinguish particular products. In this study, all the products are aggregated together, and expressed by their financial value instead of the quantity (the quantities are multiplied by the corresponding market prices). The greater value of production, the better.
As it was discussed in Sec. 2, all the sub-factors related to the EU ETS (allowance price, free allowances, current production of CO2) are aggregated into the single output criterion—costs of emissions trading. Obviously, this output is undesirable—the lower costs of emissions trading, the better.
Despite it was not found in the mentioned studies, another output is, supported by an expert in the steel industry, added to the model—the value of the net export of steel products. This factor is often included in the models, analysing the impact of the EU ETS on industries, see [Citation39,Citation40]. The net export is a relevant self-sufficiency measure of the national industry sector and, to some extent, it is related to its sustainability for the future. For the same reasons as in the case of production, the net export is expressed as a financial value. The greater value of the net export (i.e. the greater export or lower import), the better.
All the included factors are visualised in .
Figure 2. Structure of the proposed model.
4.2. Input data
The input data necessary to get the performances in all the identified factors are not available in a single database, therefore many different sources had to be combined.
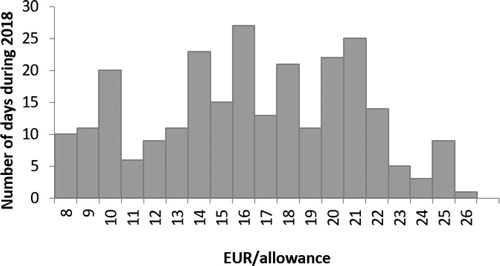
The Carbon Market Data database [Citation41] is used to get the data on the EU ETS—current CO2 emissions and grandfathering. Both indicators are available yearly by countries. The third necessary dataset related to the EU ETS is the allowance price, which was derived from the SendeCO2 database [Citation42] (daily data are available), see the histogram in . The emission costs are calculated as:
for each price of allowances in a given period, resulting in the random emission costs. Apparently, it can happen that the costs are negative (if the number of allowances grandfathered to the sector exceeds the number of allowances necessary to cover the current emissions).
Figure 3. Histogram of the allowance price in 2018 (SENDECO2 market).
The quantities of different product types (long products, flat products, steel semiproducts, rails and tubes), number of employees and amounts of net export were taken from [Citation43,Citation44]. All these indicators are available yearly.
The early data on energy consumption [GWh] and price of labour [EUR/h] were taken from the Eurostat database [Citation45] for activities listed as C24.2 according to the NACE classification (i.e. production of iron and steel products).
The last necessary data are the prices of steel products, which are available in the MEPS database [Citation46] monthly.
Different data sources bring a problem of different dates for which the latest data are available (the current allowance price can be easily found each day, meanwhile, the latest data on the steel sectors are available for 2018). Therefore, all the data used in this paper correspond to 2018.
Another trouble was caused by missing data from some European sectors (e.g. Estonia, Lithuania, Latvia, Denmark). The analysis will be performed using 18 national steel sectors (Austria, Belgium, Bulgaria, the Czech Republic, Finland, France, Germany, Hungary, Italy, United Kingdom, the Netherlands, Poland, Romania, Slovakia, Slovenia, Sweden, Spain, Greece) for which all the input data are available.
The last issue to solve is the choice of preference function’s type for PROMETHEE. In line with [Citation47] and [Citation48], in the case of quantitative criteria, the Gaussian-type preference function (i.e. the non-linear one) with the inflection point given by the standard deviation of the performance values is highly suitable to use. This recommendation is followed in this paper.
All the input values are provided in Appendix A.
5. Results
The random output (costs of emissions trading) causes that the model has to be solved repeatedly for different scenarios of this random variable. These scenarios are determined by the development of the emission price. As mentioned in the previous section, in order to avoid losing part of information, each scenario corresponds to the price on a single trading day on the emissions market. SendeCO2 market, whose data are used in this paper, offered 256 trading days in 2018, thus the model is run 256 times for 256 values of emission costs. The model was run using Visual PROMETHEE software, final visualizations of the results were created using MS Excel.
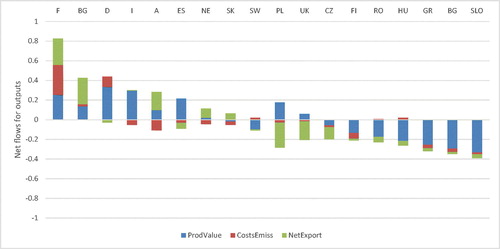
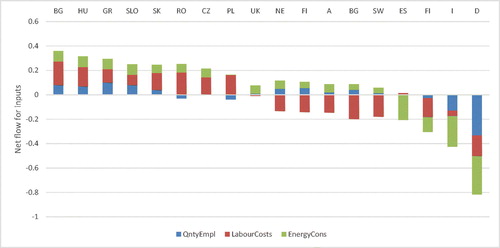
The final results are provided in and . In , the resulting distances of each unit to the efficient frontier are provided (their minimum, maximum, mean value and the variance). It can be seen that three national sectors are considered efficient regardless the value of the emission costs (and the allowance price)—Bulgaria, Slovakia and France. Each of these three national sectors lies in a different quadrant. The Bulgarian sector is very small with low outputs, but on the other hand, low inputs too. The authors of [Citation33] called such unit frugal. When comparing the performance of this sector with the others, not surprisingly, low labour costs and quantity and energy consumption are the main strengths of this sector (see the PROMETHEE net flow structure of the inputs considering the mean value of the allowance price in Appendix B). On the other hand, it is worth noting that the emission costs are rather a weakness for this sector (in terms of its added value to the net flow in PROMETHEE), which possibly points to outdated technological equipment (see the PROMETHEE net flow structure of the outputs considering the mean value of the allowance price in Appendix C). The French sector is the opposite—it consumes a high value of the inputs (high labour costs and quantity and energy consumption), but it also produces a high value of the outputs (see Appendixes B and C). Surprisingly, this sector performs very well in terms of the emission costs, caused mainly by the high quantity of free allowances. The Slovak steel sector lies somewhere in between the previous two. In terms of almost all the factors, it performs more or less on average, but its important advantage is lower costs of labour (again, see Appendixes B and C).
Figure 4. Results of the analysis (the brown efficient frontier and brown points belong to the maximum allowance price; the blue efficient frontier and blue points belong to the minimum allowance price).
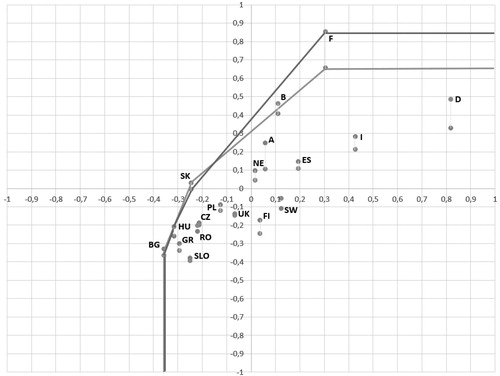
Table 3. The results of the DEA model (the last column provides the probability under which the sector is efficient).
According to , there is one steel sector, which can be efficient only for some levels of the allowance price: the Hungarian steel sector. Namely, this sector is considered efficient when the price of allowance exceeds 22 EUR/allowance, i.e. with about 7% probability. The reason is that this sector performs very well in “costs of emissions trading” when comparing with other sectors of similar size (the sectors lying close to Hungary in ).
The remaining sectors are not efficient under any scenario, but their “level of inefficiency” calculated using the DEA model, i.e. their distance to the efficient frontier, is influenced by the allowance price. The higher variance of the distance (see ), the stronger influence of the EU ETS on a sector. The presented results prove that the price of allowance can affect the efficiency of the whole national steel sector.
The analysis above showed that the random allowance price affects the efficiency of the steel sectors. However, it was already described in Sec. 2 that the allowance price is not the only one factor influencing the final costs of emissions trading. Another important factor worth further investigation is grandfathering. The number of free allowances decreases each year and it is expected that all the necessary allowances will have to be purchased on the market in the future (currently, this holds for the EU energy producers). Thus, there are two main reasons why to explore the influence of grandfathering on the competitiveness of the steel sectors. First, it is worth investigation to what extent this artificial legislative tool advantages some sectors; second, the sectors and companies should be aware how the future decrease of free allowances will affect their competitiveness.
The model was run twice again—with the minimum (7.64 EUR/allowance) and maximum allowance price (25.18 EUR/allowance) in 2018, but without any free allowances (without grandfathering). The results are shown in and .
Figure 5. Results if grandfathering is not applied (the black efficient frontier and yellow points belong to the maximum allowance price; the dashed efficient frontier and grey points belong to the minimum allowance price).
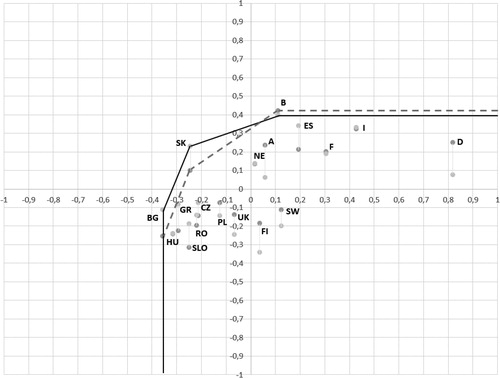
Table 4. The results of the DEA model for minimum and maximum allowance price without grandfathering.
According to , the set of efficient sectors is the same for both considered prices: Belgium, Bulgaria and Slovakia. France and Hungary, which are/can be efficient with grandfathering, do not lie at the efficient frontier anymore. Apparently, some sectors are disadvantaged by grandfathering like Belgium (which is indeed efficient), or Germany, Italy, the Netherlands, or Spain, which are closer to the efficient frontier when grandfathering is excluded. Moreover, when comparing the results in with the original results in , it is apparent that grandfathering deepens the distances between the sectors. Thus, as well as the allowance price, grandfathering can influence the competitiveness of the steel sectors.
Further sensitivity analysis can be done if necessary. In fact, one can consider any “what-if” question and the results can be easily calculated using the simulation. For instance, how much the net export of the Czech Republic must be increased to become efficient. If the value of the Czech net export increases from the current value −1432 M EUR to more than 1600 M EUR, the Czech steel sector would become efficient. Or how high the Slovak cost of labour can be and still be considered efficient. If the allowance price is equal to the average value in 2018, i.e. 15.86 EUR/allowance, Slovakia will not be efficient if its cost of labour exceeds about 20 EUR/hour, i.e. if this cost increases by more than 75%.
Unfortunately, there are only very limited possibilities how to compare the obtained results with the results of past studies. The study presented by [Citation39] assesses the impact of the EU ETS on selected EU countries (their industry) and its results showed that the effect is substantially greater in the Netherlands than in France, which is in line also with the results of this paper.Footnote1 The authors of [Citation49] analysed the energy efficiency of the EU national steel sectors (using data from 2000 to 2015). This analysis provides a completely different ranking from the one in this paper—Poland, Austria and Slovenia performed the worst, and Romania, Germany and United Kingdom performed the best. Despite the factor of energy is included in both studies, their structure of inputs and outputs is completely different (mainly, the economic perspective is missing in [Citation50]).
Based on the results, the research questions declared in the introduction can be answered. (1) It was shown that the EU ETS influences the efficiency of the national steel sectors. This impact differs with changing allowance price. (2) It was shown that, except of 3 sectors which were considered efficient for any value of the allowance price in the given year, all other sectors changed their distance to the efficient frontier. One of these sectors (Hungary) even becomes efficient for some values of allowance price. (3) Grandfathering can affect the competitiveness of the national steel sectors. The set of efficient sectors changed under different settings of grandfathering (the current one and the setting when no free allowances are allocated). In general, the effect of grandfathering was greater for big sectors.
5.1. Applicability of the model for stakeholders
The presented study has been performed using the national steel sectors, grouping together all the plants located in a given country, regardless their owner and other mutual relationships. This fact also determines what subjects can learn a lesson from the results. An interested subject must do care not only about a single company, but about the performance of the steel industry in a given country as a whole. Principally, this is the case of the ministries of industry and trade and national steel unions and associations, which group together all the companies in a given country (like the Polish Steel Association in Poland, or the Czech Steel Union in the Czech Republic
The results reveal the strengths and weaknesses of each sector and the reasons why they are/are not efficient. The presented model can answer the questions how some change in the included input/output will influence the final evaluation, what consequences can be caused by various shocks (natural disasters, changes in the rules of the EU ETS, strikes for higher wages organized by trade unions, etc.).
6. Conclusions
This paper assessed the efficiency of the national steel sectors of the EU countries using the combined PROMETHEE-DEA method with random parameters. A special emphasis was put on the influence of the EU ETS on the efficiency of the national steel sectors. The EU ETS was represented in the model by the emission costs. These costs were considered random because of the random allowance price.
The selected method was applied using the simulation approach and provided both, graphical and numerical representation of the results. The results brought some evidence on the performance of the steel sectors within Europe, and the impact of the EU ETS on the efficiency. A randomly changing value of the allowance price can substantially affect the set of efficient sectors and the inefficiency degree of the non-efficient sectors and grandfathering can influence the competitiveness of the sectors. The strength of this effect varies from sector to sector.
The state-of-the-art analysis showed that no complex study evaluating the efficiency of the national steel sectors in Europe exists so far. Furthermore, there is no study exploring the influence of the EU ETS on the efficiency of the national steel sectors yet. Besides that, this is the very first study using the PROMETHEE-DEA approach to assess the efficiency and including random parameters.
It is necessary to emphasize that this study compares the efficiency of the EU sectors only. This means that the results do not provide any evidence how the European steel sectors perform in comparison with the sectors outside the EU. Consequently, the revealed effect of the EU ETS is only relative—based on the mutual comparison between the EU sectors. In the future research, it would be interesting to include also the sectors, which belong to any other emissions trading system all around the world (like Switzerland, Canada, South Korea, etc.). Then, it would be interesting to run the model for particular plants instead of the national sectors if the input data are available. Then, it would be beneficial to focus more on the environmental efficiency of the sectors, as well as to include some phenomena related to the EU ETS omitted in this study like the pass-through effect.
Disclosure statement
No potential conflict of interest was reported by the authors.
Additional information
Funding
Notes
1 The study involved also United Kingdom, but the authors noted that its evaluation can be distorted by the input data.
References
- Council of European Union. EU directive No. 2003/87/EC. 2003.
- Council of European Union. EU directive No. 2009/29/EC. 2009.
- Council of European Union. Directive (EU) 2018/410 amending Directive 2003/87/EC to enhance cost-effective emission reductions and low-carbon investments. 2018.
- Šmíd M, Zapletal F, Hančlová J. Which carbon derivatives are applicable in practice? A case study of a European steel company. Kybernetika. 2017;53:1071–1085.
- Chevallier J, Sévi B. On the stochastic properties of carbon futures prices. Environ Resource Econ. 2014;58(1):127–153. doi:10.1007/s10640-013-9695-2.
- Rozenský L, Vrabcová P, Hájek M, et al. Searching for Correlations Between CO2 Emissions and Selected Economic Parameters. Statistika. 2019;99(2):151–262.
- De Perthuis C, Trotignon R. Governance of CO2 markets: lessons from the EU ETS. Energy Policy. 2014;75:100–106. doi:10.1016/j.enpol.2014.05.033.
- Schäfer S. Decoupling the EU ETS from subsidized renewables and other demand side effects: lessons from the impact of the EU ETS on CO2 emissions in the German electricity sector. Energy Policy. 2019;133:110858. doi:10.1016/j.enpol.2019.06.066.
- Mo JL, Zhu L, Fan Y. The impact of the EU ETS on the corporate value of European electricity corporations. Energy. 2012;45(1):3–11. doi:10.1016/j.energy.2012.02.037.
- Aparicio J, Lovell CK, Pastor JT, editors. Advances in efficiency and productivity. Cham, Switzerland: Springer International Publishing; 2016.
- Woerdman E, Couwenberg O, Nentjes A. Energy prices and emissions trading: windfall profits from grandfathering? Eur J Law Econ. 2009;28(2):185–202. doi:10.1007/s10657-009-9098-6.
- EUROFER. The impact of the European steel industry on the EU economy. Oxford, England: Oxford Economics; 2019. 100p.
- Council of European Union. EU decision No. 2014/746/EU. 2003.
- Oda J, Akimoto K, Tomoda T, et al. International comparisons of energy efficiency in power, steel, and cement industries. Energy Policy. 2012;44:118–129. doi:10.1016/j.enpol.2012.01.024.
- Flues F, Rübbelke D, Vögele S. An analysis of the economic determinants of energy efficiency in the European iron and steel industry. J Cleaner Prod. 2015;104:250–263. doi:10.1016/j.jclepro.2015.05.030.
- He F, Zhang Q, Lei J, et al. Energy efficiency and productivity change of China’s iron and steel industry: accounting for undesirable outputs. Energy Policy. 2013;54:204–213. doi:10.1016/j.enpol.2012.11.020.
- Demailly D, Quirion P. European Emission Trading Scheme and competitiveness: a case study on the iron and steel industry. Energy Econ. 2008;30(4):2009–2027. doi:10.1016/j.eneco.2007.01.020.
- Hasanbeigi A, Morrow W, Sathaye J, et al. A bottom-up model to estimate the energy efficiency improvement and CO2 emission reduction potentials in the Chinese iron and steel industry. Energy. 2013;50:315–325. doi:10.1016/j.energy.2012.10.062.
- Larsson M, Wang C, Dahl J. Development of a method for analysing energy, environmental and economic efficiency for an integrated steel plant. Appl Therm Eng. 2006;26(13):1353–1361. doi:10.1016/j.applthermaleng.2005.05.025.
- Council of the European Union. EU ETS handbook. Brussels, Belgium: European Commission; 2015. 139p.
- Branger F, Ponssard JP, Sartor O, et al. EU ETS, free allocations, and activity level thresholds: the devil lies in the details. J Assoc Environ Resour Econ. 2015;2(3):401–437. doi:10.1086/682343.
- Sijm J, Neuhoff K, Chen Y. CO2 cost pass-through and windfall profits in the power sector. Climate Policy. 2006;6(1):49–72. doi:10.1080/14693062.2006.9685588.
- Hančlová J, Zapletal F, Šmíd M. On interaction between carbon spot prices and Czech steel industry. Carbon Manage. 2020;11(2):121–137. doi:10.1080/17583004.2020.1712262.
- Ma J, Evans DG, Fuller RJ, et al. Technical efficiency and productivity change of China's iron and steel industry. Int J Prod Econ. 2002;76(3):293–312. doi:10.1016/S0925-5273(01)00195-5.
- Wu Y. Technical efficiency and firm attributes in the Chinese iron and steel industry. Int Rev Appl Econ. 1996;10(2):235–248. doi:10.1080/02692179600000017.
- Kim JW, Lee JY, Kim JY, et al. Sources of productive efficiency: international comparison of iron and steel firms. Resour Policy. 2006;31(4):239–246. doi:10.1016/j.resourpol.2007.03.003.
- Siitonen S, Tuomaala M, Ahtila P. Variables affecting energy efficiency and CO2 emissions in the steel industry. Energy Policy. 2010;38(5):2477–2485. doi:10.1016/j.enpol.2009.12.042.
- Yang W, Shi J, Qiao H, et al. Regional technical efficiency of Chinese Iron and steel industry based on bootstrap network data envelopment analysis. Socio-Econ Plan Sci. 2017;57:14–24. doi:10.1016/j.seps.2016.07.003.
- Rojas-Cardenas JC, Hasanbeigi A, Sheinbaum-Pardo C, et al. Energy efficiency in the Mexican iron and steel industry from an international perspective. J Cleaner Prod. 2017;158:335–348. doi:10.1016/j.jclepro.2017.04.092.
- Pardo N, Moya JA. Prospective scenarios on energy efficiency and CO2 emissions in the European Iron & Steel industry. Energy. 2013;54:113–128. doi:10.1016/j.energy.2013.03.015.
- Lin B, Wang X. Exploring energy efficiency in China’s iron and steel industry: a stochastic frontier approach. Energy Policy. 2014;72:87–96. doi:10.1016/j.enpol.2014.04.043.
- Kim Y, Worrell E. International comparison of CO2 emission trends in the iron and steel industry. Energy Policy. 2002;30(10):827–838. doi:10.1016/S0301-4215(01)00130-6.
- Ishizaka A, Resce G, Mareschal B. Visual management of performance with PROMETHEE productivity analysis. Soft Comput. 2018;22(22):7325–7338. doi:10.1007/s00500-017-2884-0.
- Theodoridis AM, Anwar MM. A comparison of DEA and SFA methods: a case study of farm households in Bangladesh. J Dev Areas. 2011;45(1):95–110. doi:10.1353/jda.2011.0004.
- Sartor O, Pallière C, Lecourt S. Benchmark-based allocations in EU ETS Phase 3: an early assessment. Climate Policy. 2014;14(4):507–524. doi:10.1080/14693062.2014.872888.
- Mareschal B, Brans JP, Vincke P. PROMETHEE: a new family of outranking methods in multicriteria analysis (No. 2013/9305). ULB–Universite Libre de Bruxelles. 1984.
- Charnes A, Cooper WW, Rhodes E. Measuring the efficiency of decision making units. Eur J Oper Res. 1978;2(6):429–444. doi:10.1016/0377-2217(78)90138-8.
- Wu D, Olson DL. A comparison of stochastic dominance and stochastic DEA for vendor evaluation. Int J Prod Res. 2008;46(8):2313–2327. doi:10.1080/00207540601039775.
- Granér M, Isaksson A. Firm efficiency and the destination of exports: evidence from Kenyan plant‐level data. Dev Econ. 2009;47(3):279–306. doi:10.1111/j.1746-1049.2009.00087.x.
- Grazzi M. Export and firm performance: evidence on productivity and profitability of Italian companies. J Ind Compet Trade. 2012;12(4):413–444. doi:10.1007/s10842-011-0102-9.
- Carbon Market Data. Private paid database of Carbon Market Data. 2019. Available online: https://carbonmarketdata.com/en/home.
- SENDECO2. Database of SendeCO2 trading platform. 2019. Available online: https://www.sendeco2.com/it/prezzi-co2.
- EUROFER. EUROFER: Annual Report 2018. 2019. Available online: http://www.eurofer.org/News&Events/News/EUROFER%20Annual%20Report%202018.fhtml.
- World Steel Association. World Steel in Figures 2018. 2019. Available online: https://www.worldsteel.org/en/dam/jcr:f9359dff-9546-4d6b-bed0-996201185b12/World+Steel+in+Figures+2018.pdf.
- Eurostat database. Database of the European Union. 2019. Available online: https://ec.europa.eu/eurostat/data/.
- MEPS International. Paid database of MEPS International Ltd. – Independent Steel Industry Analysts, Steel Prices, Forecasts, News, Reports. 2019. Available online: http://www.meps.co.uk/publications/international/_steel/_review.htm.
- Amponsah SK, Darkwah KF, Inusah A. Logistic preference function for preference ranking organization method for enrichment evaluation (PROMETHEE) decision analysis. Afr J Math Comput Sci Res. 2012;5(6):112–119.
- Podvezko V, Podviezko A. Dependence of multi‐criteria evaluation result on choice of preference functions and their parameters. Technol Econ Dev Econ. 2010;16(1):143–158. doi:10.3846/tede.2010.09.
- Dechezleprêtre A, Nachtigall D, Venmans F. The joint impact of the European Union emissions trading system on carbon emissions and economic performance. 2018.
- Odysee. Energy Efficiency Monitoring in the EU. 2015. Available online: https://www.odyssee-mure.eu/publications/efficiency-trends-policies-profiles/.
Appendix A.
Input data for the PROMETHEE analysis
Appendix B.
The net flows for inputs in PROMETHEE and their structure by factors
Appendix C.
The net flows for outputs in PROMETHEE and their structure by factors