
ABSTRACT
Indirect land-use change (ILUC) can have a severe impact on the greenhouse gas (GHG) balance of biofuels. Mitigating ILUC risk is important to avoid additional GHG emissions compared to fossil fuels. This is possible by making surplus land available through land demand reduction and using this for low-ILUC-risk biodiesel production. For a case study in Eastern Romania, we calculated the rapeseed biodiesel potential and the GHG emissions of four measures to make surplus land available in 2020. Four scenarios varying in assumptions on productivity and sustainability in the agricultural sector show the variation in the potential of these measures. We find that using surplus land to produce low-ILUC-risk rapeseed biodiesel has a potential of 3-64 PJ, 1-28% of the projected Romanian transport diesel consumption. The main contribution to this potential comes from yield improvements in crop and livestock production. Average GHG emissions of the ILUC mitigation measures are -11 to 22 g CO2-eq MJ−1 (maximum total lifecycle emissions are 34 g CO2-eq MJ−1; 60% reduction from fossil fuel reference). This means ILUC mitigation is possible without necessarily missing the GHG emission reduction target, provided that the entire agricultural sector is sustainably intensified, going beyond a focus on biofuel production alone.
Introduction
Bioenergy use is expanding to meet future worldwide energy demand and to reduce greenhouse gas (GHG) emissions [Citation1,Citation2]. However, additional production of biomass for bioenergy in one location could lead to additional agricultural land use elsewhere – through displacement or other market-mediated effects – a process commonly described with the term indirect land-use change (ILUC) [Citation3,Citation4]. If this effect leads to conversion of high-carbon-stock lands, such as forests or peatlands, it could offset the GHG emission savings from bioenergy [Citation3,Citation5]. As climate change mitigation is one of the most important drivers of bioenergy demand [Citation6], ILUC and its GHG emissions need to be minimised.
Policymakers have explored several options to prevent ILUC [Citation7,Citation8]. One option is to include an ILUC factor in the biofuels policy that prescribes the GHG emission savings that need to be achieved by the use of biofuel [Citation9,Citation10]. Under such a policy, an additional emission factor would be included in the obligatory GHG emission calculations of a biofuel, in order to account for the ILUC-caused emissions. This factor would reduce the attractiveness of biofuel with a high ILUC impact and several supply chains would likely not meet the desired reduction target, compared to fossil fuels, e.g. 60% in the EU [Citation8,Citation11,Citation12].
As ILUC is an indirect effect, causal relations cannot be established directly and the effects of a counterfactual of no-biomass development cannot be measured. Therefore, models are employed to estimate the size of the ILUC effect and the applicable ILUC factor [Citation13–15]. Studies to calculate the magnitude of the ILUC factor use a partial equilibrium (PE) or computable general equilibrium (CGE) macroeconomic model to compare the global land use in a certain future reference year in a situation with and without additional biofuel production. The differences in additional land use and associated carbon emissions between the two scenarios are then attributed to the production of biofuels as the ILUC factor, thereby combining direct and indirect land-use change [Citation16,Citation17]. These macroeconomic models often distinguish between bioethanol and biodiesel production. The resulting ILUC factors reflect the varying production methods and related carbon emissions for different feedstock crops. However, there are also some important drawbacks. For example, these models are very coarse and cannot link the production in a specific location to its impacts [Citation13,Citation18–21]. Furthermore, they generally do not account for possibilities to mitigate the risk of diverting agricultural production [Citation22].
A second option to limit GHG emissions from ILUC is to reduce the risk of displacement due to bioenergy production expansion. The 2015 ILUC Directive from the European Union [Citation23] opened a policy door to low-ILUC-risk biofuels and tasked the European Commission to set criteria for the identification and certification of biofuels with a low risk of ILUC [Citation23]. Low-ILUC-risk biofuels are biofuels for which it can be demonstrated that the feedstocks have a low chance of displacing other agricultural production [Citation24–27]. Four key measures to reduce the pressure on available agricultural land have been proposed in the literature: (1) above-baseline yield improvement in the entire agricultural sector; (2) chain integration through the use of biofuel co-products to replace other crop production; (3) crop loss reduction; and (4) biofuel feedstock production on under-utilised land [Citation28]. These measures were assessed for their technical biofuel production potential in three previous case studies, considering bioenergy expansion in (1) Hungary [Citation29], (2) a province in Poland [Citation30] and (3) two provinces in Indonesia [Citation31]. The studies in the European setting show it is possible to produce biofuels without expanding agricultural production on high-carbon-stock areas or displacing production to other areas, while still meeting the demand for food, feed, fibre and the current amount of biofuel feedstock [Citation29,Citation30]. In Indonesia this is only the case under certain stringent conditions of low agricultural expansion, enforced land zoning, strong yield growth and improved chain efficiencies [Citation31].
Although these measures aim to prevent GHG emissions from ILUC, implementing the measures can also be a source of GHG emissions, e.g. when increased yields are obtained via increased fertiliser application. To avoid a situation where ILUC mitigation is a larger source of GHG emissions than ILUC itself, it is necessary to better understand the emissions of ILUC mitigation. Therefore, Gerssen-Gondelach et al. [Citation32] calculated the GHG emission balances of the agricultural sector of Lublin province in Poland when producing ethanol from miscanthus with the application of the ILUC mitigation measures. The GHG emissions of the measures were calculated for three intensification pathways that varied in how intensification is implemented. The study showed a significant reduction in overall agricultural GHG emissions in the region is possible only if intensification is done sustainably (i.e. without increased inputs, but based on better practices [Citation32]). An important reason for this finding is the use of the perennial crop miscanthus to produce bioethanol. Miscanthus cultivation leads to lower CH4 and N2O emissions than cultivation of other crops. Moreover, if miscanthus is produced on surplus agricultural land, above- and below-ground carbon stocks are generally increased, which leads to a positive GHG emission effect of bioethanol.
However, biodiesel from first-generation vegetable oils from Europe (e.g. rapeseed, sunflower) has higher GHG emissions [Citation33] and higher projected ILUC GHG emissions than ethanol [Citation34], while it is also produced from annual crops that do not sequester carbon in the soil, as for example miscanthus does. Furthermore, the mentioned studies in Europe [Citation29,Citation30,Citation32] focussed on bioethanol crops, whereas in Europe, the production and use of biodiesel is higher than that of bioethanol [Citation35]. Reducing the risk of additional GHG emissions related to ILUC in biodiesel production in the EU is therefore critical.
The objective of this study is therefore to calculate the low-ILUC-risk biodiesel production potential and the associated GHG emissions of the ILUC mitigation measures, differentiating among four intensification pathways. By analysing both the potential and the emissions of low-ILUC-risk measures, we can show the trade-off between reducing the ILUC risk and associated GHG emissions, as these are often ignored [Citation36].
In this study we zoom in on rapeseed for biodiesel production in Eastern Romania (see ) in 2020, the year of the first (10%) target for renewable energy in transport in the EU [Citation12]. Romania plans to produce 20 PJ of biofuels per year in 2020 according to its National Renewable Energy Action Plan (NREAP) [Citation37], of which 15 PJ will be biodiesel. Although 2020 is not far away, the timeframe 2010–2020 was selected as 2020 is the first milestone of the European Union Renewable Energy Directive (EU RED) [Citation12] and the subsequent ILUC calculations of Laborde are also based on this period [Citation5]. Furthermore, as a theoretical assessment of the low-ILUC-risk potential, this is impacted less by the timeframe of the calculations.
Figure 1. Location of Macroregion 2 in Romania, and key land-use statistics in the country and region [Citation38] (color online).
![Figure 1. Location of Macroregion 2 in Romania, and key land-use statistics in the country and region [Citation38] (color online).](/cms/asset/814b7c81-6398-46de-9acd-81029b9dcd9e/tbfu_a_1464873_f0001_oc.jpg)
Romania has received increasing attention from businesses, farmers and governments due to the potential for growth in its agricultural sector [Citation39,Citation40]. Particularly Eastern Romania is currently relatively underdeveloped, with large yield gaps; this means intensification may provide large gains in terms of additional production and resource efficiency [Citation38,Citation41]. The size of Eastern Romania (Macroregiunea doi, in English Macroregion 2) is 72,000 km2, of which 44,000 km2 is classified as agricultural area. This is about 30% of the total agricultural area of Romania. The amount of arable land is 32,000 km2, 34% of the Romanian total. In the period 2008–2012, Macroregion 2 produced 45% of the 615,000 tonne of Romanian rapeseed [Citation38]. Rapeseed has been selected as it is already an important source of domestically produced biodiesel in the EU and, based on the current production, a crop suitable for the region.
Methods and materials
Expansion of biofuel production in Eastern Romania could lead to (high) land-use change GHG emissions if it causes agricultural land expansion through displacement or other market-mediated effects. In this study, we calculated the potential rapeseed biodiesel (PJ yr−1) that Eastern Romania could produce in 2020 with a low risk of ILUC and the associated GHG emissions (g CO2-eq MJ−1 biofuel, hereafter just g CO2-eq MJ−1). The area available for low-ILUC-risk biofuel production, here called surplus land, comes from agricultural land that has recently been abandoned, or land that currently has an agricultural use, but will not be required anymore in 2020 for the production of food, feed or fibre as a result of intensification and increased resource efficiency. The steps to calculate this area, and the resulting potential for low-ILUC-risk biofuels, are based on Brinkman et al. [Citation28] and described below. A more detailed description of the specific application of the method for this case study can be found in [Citation42].
The first step was to establish the baseline crop production in Eastern Romania in 2020 (see next section). This baseline is the biomass production in 2020 for food, feed, fibre for the growing population and gross domestic product (GDP), and the current amount of biofuel. Any additional demand for biomass for biofuel in the region above this baseline can be a cause of ILUC when it leads to expansion of agricultural land. This means that the baseline production and production of any additional biofuel feedstock needs to take place within the current land use in order to avoid ILUC. In the second step, we calculated the potential effects of four measures to reduce land demand and thereby make land available for biofuel feedstock production. The four measures that were included are (1) above-baseline yield improvement in crop and livestock production; (2) use of rapeseed meal to replace feed crops; (3) decreased losses in crop production; and (4) biofuel feedstock production on abandoned land. The application of these four measures can help to reduce the demand for agricultural land whilst still producing sufficient biomass to meet baseline demand. We did this for four scenarios that varied in their assumptions regarding potential developments in the agricultural sector, in terms of both productivity and sustainability. In the third step, we integrated the results and calculated the total surplus land (km2) and potential biodiesel production (PJ) on that land. For this, the agricultural land available after covering the baseline biomass production was considered surplus land and available for the production of low-ILUC-risk rapeseed for biodiesel.
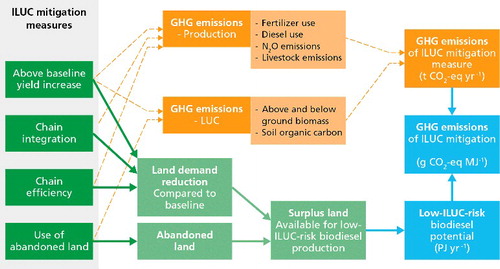
For each of the four measures, the resulting GHG emissions were calculated and we used these results to establish the GHG emissions of ILUC mitigation per unit of low-ILUC-risk biofuel (CO2-eq MJ-1). These indirect emissions need to be at least below 55 g CO2-eq MJ−1 in order to constitute a saving compared to the European rapeseed biodiesel ILUC factor [Citation5]. The complete life-cycle emissions of biofuel production need to be below 34 g CO2-eq MJ−1 in order to adhere to the 60% GHG emission savings compared to the fossil reference (83.8 g CO2-eq MJ−1) mandated in the EU RED for new biodiesel installations [Citation12]. The life-cycle emissions of rapeseed biodiesel in Romania are on average 20 g CO2-eq MJ−1 for cultivation [Citation43], and in the most optimistic situation 10 g CO2-eq MJ-1 for transport and processing [Citation33]; this leaves a little room to allocate emissions resulting from ILUC mitigation. An overview of how the measures and the GHG emissions relate to each other is presented in .
Figure 2. Overview of the surplus land and GHG emissions as a result of the implementation of the indirect land-use change (ILUC) mitigation measures (color online).
Step 1: Baseline agricultural production in 2020
The projections for the baseline crop production in Eastern Romania in 2020 are taken from the results of the MIRAGE (Modelling International Relationships in Applied General Equilibrium) [Citation5]. This is a computable general equilibrium model developed by the International Food Policy Research Institute (IFPRI). The model projects the effects on supply and demand in all sectors of the global economy in response to an exogenous change (e.g. increased biofuel production), and includes developments such as population growth. Here we used the results from the Biof version of MIRAGE, which was also used for the report of the land-use change consequences of European biofuel policies by Laborde [Citation5]. This report was used by EU policymakers when considering establishing quantitative ILUC factors. For the baseline production, we used the reference situation in which no growth of biofuel production took place compared to the baseline. The results of the MIRAGE model are on the EU27 level. Therefore, the crop production volumes were disaggregated to Eastern Romania based on the share of the production of each crop (average 2008–2012) in Macroregion 2 within the EU27. For the disaggregation, the crop production data from FAOSTAT [Citation41] and the Romanian national statistics office [Citation38] were used. The total production, yield and area are presented in . Because of the large uncertainty stemming from the disaggregation, we varied this parameter in the sensitivity analysis that is presented in the results section. We included the eight most important crops in terms of production and area in the region in our analysis. These crops cover nearly 80% of the arable land in Macroregion 2.
Table 1. Current (average 2008–2012) and future (2020) crop production, yield and area of eight selected crops in Eastern Romania. Production is for food, feed, fibre and the current amount of biofuels. Current production data and other land use data from the Romanian national statistics institute (INSSE) [Citation38]; 2020 production and yields disaggregated from the MIRAGE model [Citation5], based on the share of production in the EU27 from FAOSTAT [Citation41]. Current cattle milk and beef production from [Citation44]; projections based on Laborde [Citation5].
In the baseline, demand for cattle increases by 15% until 2020, and the demand for other animal products decreases by 3% [Citation5]. In the same period, the productivity of the cattle sector increases by 10%, and by 6% for other livestock production [Citation5].
Step 2: Bottom-up assessment of measures
The four ILUC mitigation measures aim to reduce the demand for agricultural land and thereby make land available for the production of rapeseed for biodiesel. We used low, medium, and high scenarios for the measures to assess the range of the surplus land for a less or more progressive development in the agricultural sector in Eastern Romania. A high+ scenario was used to illustrate the variation in GHG emissions as a result of differences in the intensification method. The baseline scenario refers to the conditions that apply to the baseline as defined in step 1 and follow the MIRAGE model. For the low scenario we assumed only a little progress in the agricultural sector in Eastern Romania, which is comparable to the recent past, but slightly better than the MIRAGE projections. In the medium scenario we assumed that the level of the best county in the region can be achieved by the whole region. In the high scenario we assumed progress to the level of neighbouring countries, such as Poland. For the calculation of the surplus land, the high+ scenario is identical to the high scenario. However, for the GHG emission calculation, we assumed a more sustainable intensification pathway to achieve this potential than in the high scenario. For the above-baseline yield measure this was based on Gerssen-Gondelach et al. [Citation32]. The high scenario is an optimistic scenario in increasing production potential, but assumes conventional intensification pathways in order to achieve this potential. Conventional intensification relies on increased application of fertilisers, pesticides and mechanisation without increasing efficiency [Citation32]. Previous studies (e.g. [Citation45,Citation46]) showed unsustainable intensification can increase GHG emissions per unit of product. Intensification causing GHG emissions to increase to a level above the ILUC factors would make low-ILUC-risk biofuel superfluous. There are multiple methods for sustainable intensification such as precision farming [Citation47,Citation48], reduced tillage [Citation32], new crop varieties with higher yield, improved drought or pest resistance [Citation49], or better management [Citation45]. An overview of the scenarios is presented in Table S1 in the Supplementary material.
In the GHG emission calculations we included the emissions that are required to achieve each measure (e.g. increase fertiliser use to raise productivity), or the savings that occur due to lower demand (e.g. when reducing losses). In addition, we included GHG emissions of land-use conversion from former land use to rapeseed. For cropland-to-cropland conversion we assumed no land-use change GHG emissions. Following the EU guideline, the land-use change GHG emissions were divided over a 20-year period to account for the fact these occur only once [Citation44].
Above-baseline yield improvement
The current crop yields in Eastern Romania are low compared to the average European yields (see ). This is a result of the interplay among various elements of which poor mechanisation of agriculture [Citation37], sub-optimal use of fertilisers [Citation50,Citation51] and low pesticide use [Citation52,Citation53] are three main factors. For the baseline scenario, the MIRAGE model projects only a small yield increase (see ). For each crop, this yield increase was applied to the current yield (average 2008–2012) in Eastern Romania [Citation38] to calculate the baseline yield increase. The low scenario extrapolated the linear yield trend in Macroregion 2 in the period 1990–2010 to 2020 [Citation38]. The medium scenario assumed that the current best yield for each crop of all 12 counties of Macroregion 2 can be achieved in the whole region by 2020. The yield in the high scenario was calculated as the same yield level (as share of the maximum attainable yield, based on the agro-ecological suitability [Citation54]) as is currently achieved in Poland (e.g. for rapeseed this is 52%, up from the current 37%). Increasing yields above the baseline ensures the 2020 baseline crop production requires less land. The difference between the projected agricultural land area and area after the yield increase is surplus land that is assumed to be available for the production of rapeseed for biodiesel.
Figure 3. Rapeseed and maize yield development (5-year moving average) in Eastern Romania and the EU27 (1990–2010) [Citation38,Citation41] (color online).
![Figure 3. Rapeseed and maize yield development (5-year moving average) in Eastern Romania and the EU27 (1990–2010) [Citation38,Citation41] (color online).](/cms/asset/604a5eaa-42ad-4ac6-968d-5138205cc2fc/tbfu_a_1464873_f0003_oc.jpg)
Livestock intensity in Eastern Romania is also low compared to the rest of the European Union, with only Greece, Bulgaria and the Baltic States having a lower density [Citation41,Citation53]. The index for livestock density was 1.0 livestock units per hectare (average 2008–2012). Livestock units (LU, as defined by Eurostat [Citation55]) make it possible to compare the livestock density between countries with different compositions of the livestock herd. Here we included sheep (0.1 LU) and cattle (1.0 LU) as these are the two most land-demanding types of livestock in Romania. The density was based on livestock numbers (8.2 million sheep and 0.84 million cattle) from the national statistics office [Citation38] and the sum of meadows and pastures in the region [Citation38].
The intensification of livestock production follows the same logic as crop intensification. By increasing the productivity per hectare, less space is required for the production of the same quantity and the surplus area can be used for low-ILUC-risk biofuel production. For the increase in productivity in livestock production the same intensification pathways were used as for the crop yield increase in the low (extrapolating trend), medium (best county) and high (Poland) scenarios. Examples of measures to increase the production intensity are fertilising pastures, shortening of grazing periods and changing livestock diet towards less fibrous compositions [Citation56].
GHG emissions of above-baseline yield improvement
Crop yield production intensification can lead to increased GHG emissions, -through higher agro-chemical application, diesel use in machinery or leaching resulting in nitrous oxide (N2O) emissions. Still, by reaching a higher productivity, GHG emissions per unit product may decrease, but the net effect depends largely on how intensification is implemented. To calculate the GHG emissions of total agricultural production we used the BioGrace tool [Citation57]. It is developed to calculate GHG emissions of different biofuel production routes and include the cultivation phase of eight different crops. BioGrace was selected as the tool follows the calculation rules for emission values (e.g. global warming potential, GHG emission coefficients) and system boundaries of the EU RED [Citation12]. BioGrace is applied here to calculate the emissions of the cultivation of maize, wheat, rapeseed, soy and sunflower. Because the ILUC mitigation measures only relate to the cultivation phase and not the conversion to biofuel, only the cultivation part of BioGrace was used. Nine sources of emissions (diesel, N fertiliser, manure, CaO fertiliser, K2O fertiliser, P2O5 fertiliser, seed and pesticide use, and the field N2O emissions) and three additional variables (yield, crop moisture content, seed use and co-products as share of production) are available for this phase in BioGrace. For each crop, a default value is available for all 12 variables [Citation58]. Each combination of these default values is part of the standard production route that corresponds to the default emission values for that specific biofuel production route in the EU RED. This value is based on a typical production case set in a European country.
Table S3 in the Supplementary material presents the BioGrace input values for the low, medium, high and high+ scenarios. Five of the eight crops addressed in this study are also included in the BioGrace tool, i.e. maize, wheat, rapeseed, sunflower and soy. In 2020, these five crops cover 72% of the arable land or over 90% of the crop land in Eastern Romania that is covered in this study (see ). For the crops that are not included we used the following proxies: for the cereals barley and oats, we used the GHG emissions of wheat, and for potatoes we used the area weighted average of the emissions per hectare of the five included crops. As virtually all GHG emissions in the default set-up of BioGrace come from the NPK fertilisers, the diesel use and the field N2O emissions (99% of CO2-eq emissions for rapeseed, over 90% for the others), only the values in these categories were adapted in the calculations for each scenario (see S4 in the Supplementary material). The other variables were not changed from their default values. The input values in the baseline were derived from current production in Romania [Citation43,Citation59]. The input values in the low, medium and high scenarios reflect the assumptions in the intensification pathways of these three scenarios as defined in the previous section. For the emissions in the high+ scenario we used the sustainable intensification pathway as described by Gerssen-Gondelach et al. [Citation32]. For the fertiliser application we used the highest nutrient use efficiency (NUE) for each crop and each fertiliser type. In the sustainable intensification pathway of Gerssen-Gondelach et al., diesel use was 10% lower than in the case of conventional intensification [Citation32]; this assumption was also used here.
For each scenario, BioGrace was used to calculate the emissions per cultivated hectare. Multiplying this by the production area (after the yield increase) gave the total emissions of crop production in Eastern Romania in the baseline and in each scenario. The GHG emissions of ILUC mitigation were then calculated as the difference between the emissions in the baseline and the emissions in each specific scenario in 2020.
Intensification of extensive livestock production can impact GHG emissions through changes in feed composition and energy use [Citation60–62]. In addition, the conversion of grassland to cropland leads to land-use change GHG emissions. To calculate the GHG impacts of the livestock intensification that was included in the scenarios we used the method developed by Gerssen-Gondelach et al. [Citation32], who based it on multiple reviews [Citation56]. As this method was already applied to the Eastern European context, only the Romanian-specific data differed from the previous study. The GHG emission calculations were limited to cattle as there is insufficient data available to include the effects of sheep production intensification. The GHG emissions for cattle include their most important emission sources: enteric fermentation, feed production, manure management and energy consumption, for both milk and beef production. The data on beef and milk productivity intensification in each scenario are presented in . Specific data on the emission sources of cattle production are presented in Table S4 in the Supplementary material. This shows the CH4 emissions from enteric fermentation are responsible for the majority of GHG emissions; these rapidly decline with increasing intensification. The methane emissions of manure management, however, increase significantly with increased intensification. Sustainable intensification in the high+ scenario was implemented using a 10% lower GHG emission impact compared to the high scenario, following the data of Gerssen-Gondelach et al. [Citation32]. Multiplying beef and milk production by the respective GHG emissions per unit product gave the total emissions for each scenario. The GHG emissions of ILUC mitigation were then calculated as the difference between the total GHG emissions in each scenario and the baseline GHG emissions.
Table 2. Input data for the calculation of the surplus land of the four measures in the baseline and the three scenarios. Surplus land in the high+ scenario is the same as in the high scenario. Assumptions for each scenario are explained in the main text and summarised in Table S1 of the Supplementary material.
The land-use change GHG emissions of converting meadows and pastures to crop land were calculated using the Intergovernmental Panel on Climate Change (IPCC) Tier 1 approach [Citation68–70] and the EU guideline on the calculation of land carbon stocks [Citation44]. The GHG emissions of the conversion of grassland to cropland consist of a decrease in soil organic carbon in the topsoil (top 30 cm) and a loss in the above- and below-ground biomass. For the soil organic carbon content in the region, we selected the default value (38 t C ha−1) for high-activity clay soils in temperate-dry conditions from the EU guideline [Citation44,Citation71]. This was adapted by multiplying by factors for land use (1), land management (1) and inputs (1) that reflect nominally managed medium-input grasslands. The carbon content of the cropland was calculated by multiplying the same reference soil organic carbon content of the region with factors for land use (0.8), land management (1) and inputs (1.04) that are in line with full-tillage, high input (without manure) agriculture in a temperate-dry climate [Citation44]. For the loss in vegetation – in the form of above- and below-ground biomass – we took the default value for grassland from the EU guideline: 3.3 t C ha−1 [Citation44]. In the high+ scenario we adjusted the factor for land management to reflect a management system without tillage (1.1) that sequesters a higher level of carbon in the soil.
Improved chain integration
Expanding biofuel production also means an increased production of its co-products, which can have a positive indirect effect on land demand [Citation72]. Crushing rapeseed to obtain rapeseed oil yields 59% rapeseed meal [Citation73], which can be used as animal feed and thereby replaces other feed production. This reduces the demand for arable land for feed production and technically creates more space to produce biofuels. As the MIRAGE model already includes a reduction in crop production as a result of the use of rapeseed meal, there was a risk of double counting. We avoided this by increasing the crop production in 2020 (of ) by the same amount that it was reduced in the MIRAGE model due to the use of the rapeseed meal as animal feed [Citation29]. This amount was calculated by multiplying the rapeseed meal production and the replacement rate assumed by Laborde [Citation5], following the description of Brinkman et al. [Citation29].
In the baseline no chain integration was assumed to take place. In the low scenario we assumed the rapeseed meal to replace the marginal source of protein in feed, which is imported soy [Citation74]. This alleviates the pressure on agricultural land in Brazil and Argentina, the two main soy-producing countries, but does not contribute to the domestic surplus land and low-ILUC-risk biofuel potential. In the medium scenario we assumed the current replacement rate in the Romanian feed mix, based on FAOSTAT data. In the high scenario we assumed rapeseed meal to replace the marginal source of energy in the feed; in this case, it was domestically produced barley [Citation66]. The data for crop replacement by rapeseed meal are presented in .
As the land-use savings in the baseline were assumed to be zero, we calculated the surplus land in 2020 for each scenario as the replaced crop production divided by the baseline yield (from ) of that crop.
GHG emissions of this measure came from the production of rapeseed meal, and GHG savings were achieved through lower production of the displaced crops. Producing rapeseed meal from rapeseed requires energy for transport, drying and processing. This equates to 0.1 kg CO2-eq kg−1 rapeseed meal [Citation75]. The GHG emissions of the crop production that is displaced by the rapeseed meal can be counted as negative GHG emissions of this measure; the GHG emissions of processing of regular feed are neglected as they represent only a small share of the carbon footprint of regular feed production [Citation75]. To calculate this, the crop production reduction in Eastern Romania for each scenario was multiplied by the crop-specific GHG emissions (i.e. the baseline from the yield increase measure). The total emissions of this measure were calculated as the sum of the emissions to produce rapeseed meal and the negative emissions from the reduced crop production.
Reduced agricultural losses
Current pre-consumer losses in the agricultural chain for the eight selected crops range in Romania from 0.9% of the total domestic supply for wheat (EU average: 2.5%) to 8.9% for barley (EU average: 2.1%). These are country average data (2008–2012) from FAOSTAT as there are no region-specific data available [Citation41]. Crop losses unnecessarily increase the land requirement to meet the demand; eliminating these losses would therefore make more land available for other uses [Citation76]. The baseline assumption here was that the losses would not change. In the low scenario we assumed that the pre-consumer losses keep declining at the same pace as in the period 2000–2012. In the medium scenario the average losses in the Central and Eastern European member states of the EU were assumed to be achievable in Romania. The high scenario considered the losses in Poland to be achieved in Eastern Romania in 2020. The assumed losses for each scenario are presented in .
Following Gerssen-Gondelach et al. [Citation32], we only included the GHG emission reduction from reduced crop production. Further savings from reduced transport and storage are expected to be negligible. The GHG emission effects associated with the reduced crop production as a result of the lower losses were calculated following the crop-specific emission factors as calculated for the yield increase measure.
Abandoned land
The agricultural land area utilised in Romania decreased after the fall of the communist regime as a result of low profitability, ambiguity of land ownership, lack of governmental support and poor mechanisation [Citation77]. These lands have not been taken back into production, but doing so is an effective way to limit the risk of ILUC and high land-use change GHG emissions. This is under the condition that these abandoned lands do not have high carbon stocks or other (conservation) value [Citation18]. The amount of land classified as abandoned in Eastern Romania is presented in Table S2 in the Supplementary material. The data were derived from the national agricultural census of 2010. In the baseline we assumed no use of abandoned lands. The low and medium scenarios only included plots of abandoned land larger than 50 and 20 ha, respectively, as small plots are more difficult to take into production. The high scenario assumes all plots of abandoned land to be available for crop production (1100 km2). To account for possible lower productivity of abandoned land, we assumed a yield of 50%, 75% and 99% of the baseline productivity in the low, medium and high scenarios, respectively. This range corresponds to the uncertainty range for yield on marginal lands as also used by Laborde [Citation5].
Bringing abandoned land back into production leads to GHG emission from the carbon stock lost due to the conversion of abandoned land to cropland. The carbon stock changes were calculated as in the case of grassland conversion. For abandoned land, the soil carbon content data were the same as those used for grassland [Citation44]; the factors for land use (1), management (1.1) and inputs (1) were adopted to reflect abandonment. For cropland, the same factors were used as previously described for grassland to cropland conversion, including the higher management factor in the high+ scenario. For biomass present on abandoned land, for vegetation we assumed shrub growth on the land (7.4 t C ha−1). A part of the abandoned land can be in transition to forest, which would be associated with higher GHG emissions [Citation78,Citation79]. However, our analysis of the land use based on satellite images (see [Citation42]) showed a continuous two-way conversion of lands in Eastern Romania, going from agriculture to forest and vice versa. This indicates that carbon stock growth in biomass on abandoned land is limited. Furthermore, as the abandoned lands were assessed on the ground by the statistics office during the land census of 2010 [Citation80], it was assumed the conversion to forest land had not yet been started.
Step 3: Integration and comparison
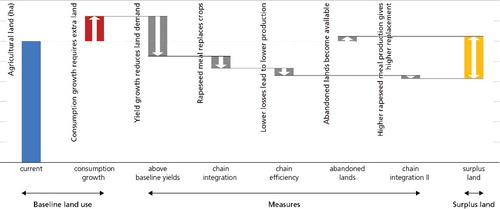
In the third step, the total surplus land and the production potential of low-ILUC-risk biofuel were calculated. shows how the results of the four measures were integrated to calculate the total surplus land. Starting from the current agricultural land use, in seven consecutive steps the changes to land requirements as a result of increased crop demand and the application of the ILUC mitigation measures were included. The available abandoned lands were considered additional supply. As the measures also impact each other (e.g. more surplus land means higher availability of meal) a few iterative steps were made to also include these effects. As a result of these calculations, we obtained the total amount of surplus land in Eastern Romania after the implementation of each of the measures. This land was assumed to be available for low-ILUC-risk rapeseed for biofuel production. The amount of biodiesel produced was calculated assuming the average Romanian rapeseed crushing efficiency (2008–2012) of 39% [Citation73] and a 98% biodiesel conversion yield [Citation81].
Figure 4. Schematic overview of the calculation steps to determine the surplus land. The current agricultural land (left bar) and additional land to meet growing demand (second bar) give the baseline land use in 2030. The indirect land-use change (ILUC) mitigation measures (middle bars) reduce this demand or increase supply of land. The surplus land (right bar) can be used for the production of biodiesel (color online).
ILUC mitigation GHG emissions
The total GHG effect of ILUC mitigation was calculated similarly to that for land use by integrating the various measures. The GHG emission change in the low, medium and high scenarios was fully attributed to the low-ILUC-risk biofuel production in Macroregion 2. We compared the results for each measure and the integrated result (in g CO2-eq MJ−1) to the 55 g CO2-eq MJ−1, the ILUC factor for rapeseed biodiesel as reported by [Citation5].
Data
presents the data for the calculations of the surplus land of the four measures in Eastern Romania, in the baseline and low, medium and high scenarios. The data in S4 in the Supplementary materials are the input values to BioGrace for the calculation of the GHG emissions of the above-baseline crop yield increase. The data for GHG emissions of above-baseline livestock yield increase are presented in S5 in the Supplementary material.
We performed a sensitivity analysis on the most uncertain parameters of this study. For this we varied the value of the parameter to establish the effect on the low-ILUC-risk potential and ILUC mitigation GHG emissions.
Results
The surplus land that can become available from implementing the four ILUC mitigation measures in Eastern Romania, the resulting low-ILUC-risk biodiesel potential and the associated GHG emissions are presented in for low, medium and high scenarios. For the high scenario two variants are shown for the GHG emissions. These are the regular high scenario and a high+ scenario for which we assume the same low-ILUC-risk biodiesel potentials, but where we assume intensification takes place sustainably, reducing the associated GHG emissions. The potential surplus land of all four measures is between 2000 km2 (low) and 18,000 km2 (high). This corresponds to 6–43% of the current agricultural area in the region. In addition to the domestic surplus land, there is also additional surplus land abroad. This comes from the replacement of imported soy by rapeseed meal in the low and medium scenarios of the chain integration measure. This is a maximum of 400 km2 and is not included in the calculations of low-ILUC-risk rapeseed biodiesel potential, as it is outside the region. Using all domestic surplus land for low-ILUC-risk rapeseed biodiesel production can yield a total potential production of 3–67 PJ. This is up to 30% of the 224 PJ projected total diesel consumption in Romanian transport in 2020 [Citation37,Citation53]. The low-ILUC-risk biodiesel potential is 15–340% of the NREAP biofuel target for the whole country, or 45–1000% when disaggregating the NREAP production to Macroregion 2 (disaggregation based on the region's share of Romanian arable land).
Figure 5. (a) Surplus land in the low, medium and high scenarios as a result of the measures. (b) Potential low-indirect land-use change (ILUC)-risk rapeseed biofuel production. (c) ILUC mitigation GHG emissions for the four scenarios. Note that the surplus land and low-ILUC-risk biodiesel potential in the high+ are the same as in the high scenario (color online).
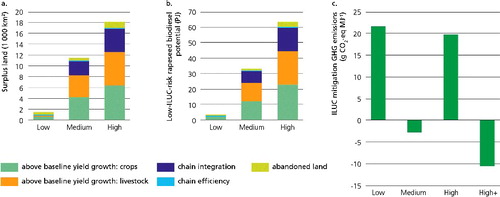
The GHG emissions to make the surplus land available are on average 28, −6 and 12 g CO2-eq MJ−1 in the low, medium and high scenarios, respectively. In the high+ scenario that focussed on sustainable intensification, the GHG emissions are significantly reduced, to −12 g CO2-eq MJ−1. This is mainly the effect of lower GHG emissions of above-baseline yield improvement because of lower fertiliser and diesel use. The ILUC factor for rapeseed biodiesel as calculated by Laborde is 55 g CO2-eq MJ−1 [Citation5]. This means making surplus land available for low-ILUC-risk rapeseed biodiesel can be done without additional GHG emissions compared to ILUC.
To put this in perspective, the complete life-cycle GHG emission for biodiesel produced from Eastern Romanian rapeseed, excluding the land-use change emission, amounts to 30 g CO2-eq MJ−1 in the most favourable case. The maximum emission to be able to meet a 60% reduction from the fossil reference (83.8 g CO2-eq MJ−1) set by the European Commission is 34 g CO2-eq MJ−1 [Citation12]. The small margin of 4 g CO2-eq MJ−1 between the two means that when the ILUC-risk mitigation GHG emissions are included in the life-cycle calculations, only those measures can be implemented that are associated with near-zero or negative GHG emissions. This would mean the low-ILUC-risk biodiesel potential decreases to 2.2 PJ in the low scenario to 15 PJ (high), 20 PJ (medium) or 59 PJ in the high+ scenario. Thus, only the medium and high+ scenarios can meet the national biofuel target of 20 PJ and fulfil the emission reduction criteria, as the high scenario has GHG emissions too large to be viable. This is also apparent from , which shows the combination of the low-ILUC-risk potential and the associated GHG emissions. The negative GHG emissions for some measures indicate those measures that make land available through lower crop production (e.g. lower losses means lower required production) or where the production increases faster than the per-unit GHG emissions.
Figure 6. Potential and GHG emissions of the indirect land-use change (ILUC) mitigation measures in all scenarios. ILUC GHG emissions of oilseeds are 55 g CO2-eq MJ−1 [Citation5]. The margin between total direct and indirect life-cycle emissions of biodiesel production and the threshold value to achieve the mandated reduction compared to fossil fuels is 4 g CO2-eq MJ−1. The vertical lines indicate the National Renewable Energy Action Plan (NREAP) [Citation37] biofuel projected production in Romania (right), and disaggregated to Macroregion 2 (left) (color online).
![Figure 6. Potential and GHG emissions of the indirect land-use change (ILUC) mitigation measures in all scenarios. ILUC GHG emissions of oilseeds are 55 g CO2-eq MJ−1 [Citation5]. The margin between total direct and indirect life-cycle emissions of biodiesel production and the threshold value to achieve the mandated reduction compared to fossil fuels is 4 g CO2-eq MJ−1. The vertical lines indicate the National Renewable Energy Action Plan (NREAP) [Citation37] biofuel projected production in Romania (right), and disaggregated to Macroregion 2 (left) (color online).](/cms/asset/999ec3bb-5927-405b-80e8-57288b09b406/tbfu_a_1464873_f0006_oc.jpg)
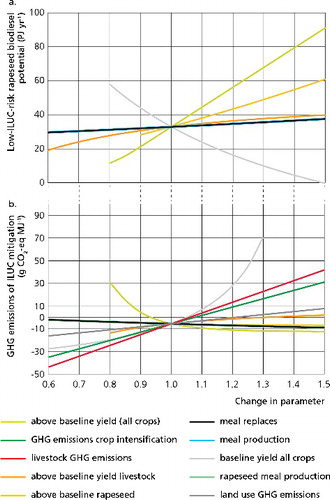
Above-baseline yield development for crops and livestock is the most important measure in terms of surplus land and low-ILUC-risk rapeseed biodiesel potential in each scenario. Between 55% and 72% of the total surplus land comes from yield increases in the low to high scenarios. The yield increases in maize, wheat and livestock contribute most to the availability of surplus land. As the gap between actual and potential yields is large and only limited yield increases are projected in the baseline, the potential for above-baseline yield increase in crop and livestock production can lead to a large potential. The baseline yield development and above-baseline yield development are also the parameters most affecting the final outcome. A small change in yield can have a large impact on the low-ILUC-risk rapeseed biodiesel potential and the GHG emissions, as illustrated in . It should be noted that a 20% change in the baseline yield can reduce the gap to zero and reduce the amount of surplus land from this measure to zero. A lower above-baseline yield for rapeseed amplifies this effect, as lower rapeseed yield means lower biodiesel feedstock production on the available surplus land. Lower yield increases would also mean the GHG emissions of crop intensification are spread over a smaller amount of low-ILUC risk biodiesel potential, thereby increasing the GHG emission per unit of low-ILUC-risk biodiesel.
Figure 7. (a) Sensitivity of the low-indirect land-use change (ILUC)-risk biodiesel potential, and (b) sensitivity of the GHG emissions of the ILUC mitigation measures to a change in various parameters in the medium scenario (color online).
Although the GHG emissions of crop yield improvement are high (75% average increase in the high scenario) these are compensated by higher yields, leading to lower emissions per unit crop produced. The same is true for intensification of livestock production [Citation32]. The GHG emissions of livestock intensification are higher as a result of the emissions of converting grassland to cropland. The conversion of meadows and pastures in Eastern Romania to cropland is associated with GHG emissions of 34–63 g CO2-eq MJ−1. These emissions are, however, partly compensated by the lower GHG emissions in livestock production, leading to lower net emissions of this measure. The LUC emissions of grassland to cropland conversion are allocated here to the low-ILUC-risk GHG emission factor, to account for the GHG emissions of reducing the ILUC risk. However, a problem of double counting occurs if these are included in the direct life-cycle emission of biodiesel production.
Discussion and conclusion
Indirect land-use change can have a severe impact on the GHG emission balance of biofuel production. In this case study, we calculated the potential to produce low-ILUC-risk biodiesel from Eastern Romanian rapeseed, and analysed the GHG emissions associated with the underlying measures to minimise the risk of ILUC (i.e. above-baseline yield increase, use of rapeseed meal to replace animal feed, reduced losses in the agricultural production chain, and the use of abandoned land). The results emphasise that ILUC mitigation is possible while still fulfilling a GHG emission reduction target of 60% compared to fossil fuels. However, this is only achieved when the entire agricultural sector is sustainably intensified, going beyond a focus on biofuel production alone. Key discussion points and conclusions are identified as follows.
Yield improvements of crops and livestock are crucial to reduce the ILUC risk
Yield growth is the most important measure in all scenarios and is responsible for up to three quarters of the surplus land. However, the extrapolation of current trends in crop and livestock yield, as assumed in the low scenario, is insufficient to reach the regionally disaggregated NREAP target without a risk of causing ILUC. Thus, to be able to mitigate the risk of ILUC, crop and livestock yields have to grow faster than in the recent past. A comparison of the development in actual Eastern Romanian crop yields in the period 2010–2016 with the projected yields in the scenarios reveals yield increases are higher than in the past: in 2016 most crops are already above the yield levels projected in the scenarios [Citation38]. Moreover, historic data on crop yield levels in Europe show that it is possible to achieve many continuous years of high yield growth. This high yield growth was even achieved when the yield gap was smaller than it is now [Citation41,Citation67,Citation82]. An additional benefit of high yield growth is that higher yields for rapeseed also mean more biodiesel feedstock production on the surplus land.
Low-ILUC-risk biodiesel production is feasible with low GHG emissions of ILUC mitigation measures under specific conditions
ILUC mitigation requires intensification and modernisation of the agricultural sector and putting under-utilised land into production. It should be avoided that GHG emissions from these ILUC mitigation measures increase total GHG emissions compared to ILUC itself. Furthermore, emissions should be low enough that the total direct and indirect life-cycle emissions of biodiesel production stay below the threshold value to achieve the mandated reduction compared to fossil fuels (i.e. 60% reduction in EU RED). We show this is possible in this case study. The mitigation measures with low GHG emissions can provide more than the regionally disaggregated biofuel target for Eastern Romania. To avoid high emissions, strict limitations apply. These limitations relate to the level of yield growth, need for sustainable intensification and consideration of the carbon stocks of the surplus land. Reducing crop losses and replacing animal feed with rapeseed meal can be qualified as no-regret options. These measures have a positive ILUC mitigation potential and, in all scenarios, reduce GHG emissions compared to the baseline.
Sustainable intensification of the whole agricultural sector is required
The high and high+ scenarios result in the same amount of surplus land, but the lower emissions in the high+ scenario mean sustainable intensification can contribute towards meeting the 60% GHG emission reduction target for biofuel. In contrast, in the high scenario, the emissions from fertiliser use and the rest of the cultivation phase increase to a level such that the GHG emissions of the ILUC mitigation measures are only just below those of ILUC itself, and far above the threshold value for GHG emissions reduction compared to fossil fuel. The optimal scenario is one where the agricultural intensification leads to faster yield growth than GHG emission growth, as that situation reduces emissions compared with the baseline.
To ensure low GHG emissions of the ILUC mitigation measures, the type and carbon stocks of the surplus land need to be considered
The conversion of abandoned land and grassland to cropland can have high associated GHG emissions. When abandoned land is covered by shrubs or vegetation with larger carbon stocks, the GHG emissions of conversion to cropland can offset the gains from mitigating ILUC. The abandoned land included in the surplus land calculations was recently abandoned, which means carbon stocks in vegetation will be limited [Citation78]. As a result of the relatively low share of this measure within the calculated surplus land, the impact on low-ILUC-risk potential is limited. The conversion of grassland to cropland also has high associated GHG emissions and is much more important than abandoned land in terms of ILUC mitigation potential. However, the intensification of livestock production that makes these surplus lands available is expected to reduce GHG emissions and thereby offset the land-use change effects and related emissions.
ILUC mitigation requires a holistic approach to the agricultural sector
ILUC is an indirect effect of the expansion of biofuel production, which ripples through the agricultural sector and affects land use far outside the location of the biofuel production. Mitigating the ILUC risk therefore also works in this interplay of agriculture, land use and bioenergy: the combination of the ILUC mitigation measures aims at improving the whole agricultural sector and reducing its land use. This is not limited to biofuel feedstock production. As the GHG emissions of the ILUC mitigation measures also occur in the rest of the agricultural sector, it is important to consider this sector as a whole. This means evaluating and monitoring the progress of ILUC mitigation should focus on the broader agricultural sector to avoid underestimation of ILUC mitigation effects. Furthermore, as this study's results are based on a post-model analysis of the MIRAGE model results, the market-mediated effects of the ILUC mitigation measures are not included. Understanding the full implications of ILUC mitigation, including its own indirect impacts, is an important topic for future research. This helps ensure ILUC mitigation strategies are effective and contribute to lowering GHG emissions.
Supplementary_Data.docx
Download MS Word (55.2 KB)Acknowledgements
The authors are grateful for the help of Iulia Pişcă with gathering Romanian-specific information and with GIS. Sarah Gerssen-Gondelach was generous enough to share her data on agricultural intensification. This study was partially conducted under the umbrella of the ILUC prevention project, which was funded by the Netherlands Enterprise Agency, the Dutch Ministry of Infrastructure and the Environment, the Dutch Sustainable Biomass Commission, the Rotterdam Climate Initiative/Port of Rotterdam and the Netherlands Oils and Fats Industry Association MVO. Additional funding came from the Be-Basic R&D Program, which was granted a FES subsidy from the Dutch Ministry of Economic Affairs, Agriculture and Innovation (ELI). We are thankful to Margot Stoete for her help with the illustrations.
Disclosure statement
No potential conflict of interest was reported by the authors.
Additional information
Funding
Related Research Data
References
- International Energy Agency. Key world energy statistics. Paris (France): OECD/IEA; 2015.
- Chum H, Faaij A, Moreira J, et al. Bioenergy. In: Edenhofer O, Pichs-Madruga R, Sokona Y, et al., editors. IPCC special report on renewable energy sources and climate change mitigation. Cambridge, United Kingdom and New York, NY, USA: Cambridge University Press; 2011. p. 209–332.
- Searchinger T, Heimlich R, Houghton RA, et al. Use of U.S. Croplands for biofuels increases greenhouse gases through emissions from land-use change. Science. 2008;319:1238–1240.
- Kim H, Kim S, Dale BE. Biofuels, Land use change, and greenhouse gas emissions: some unexplored variables. Environ Sci Technol. 2009;43:961–967.
- Laborde D. Assessing the land use change consequences of European biofuel policies. Washington DC (USA): International Food Policy Institute (IFPRI); 2011.
- Berndes G, Hansson J. Bioenergy expansion in the EU: Cost-effective climate change mitigation, employment creation and reduced dependency on imported fuels. Energy Policy. 2007;35:5965–5979.
- Witcover J, Yeh S, Sperling D. Policy options to address global land use change from biofuels. Energy Policy. 2013;56:63–74.
- Delzeit R, Klepper G, Söder M. Indirect land use change (iLUC) revisited: an evaluation of current policy proposals. Kiel (Germany): Kiel Institute for the World Economy (IfW); 2017. No.: 2075.
- European Commission. Proposal for a directive of the European parliament and of the council: amending directive 2009/28/EC. 2012.
- California Environmental Protection Agency. Air resources board proposed regulation to implement the low carbon fuel standard volume II. 2009.
- Elbersen B, Fritsche U, Petersen J-E, et al. Assessing the effect of stricter sustainability criteria on EU biomass crop potential. Biofuels, Bioprod Biorefin. 2013;7:173–192.
- The European Parliament and The Council of The European Union. Directive 2009/28/EC on the promotion of the use of energy from renewable sources and amending and subsequently repealing Directives 2001/77/EC and 2003/30/EC. Official J European Union. 2009, 52, L 140, 16–62.
- O'Hare M, Plevin RJ. Lessons from the ILUC Phenomenon. In: Khanna M, Zilberman D, editors. Handbook of bioenergy economics and policy: volume II. New York (USA): Springer New York; 2017. p. 321–344.
- Efroymson RA, Kline KL, Angelsen A, et al. A causal analysis framework for land-use change and the potential role of bioenergy policy. Land Use Policy. 2016;59:516–527.
- Ahlgren S, Di Lucia L. Indirect land use changes of biofuel production – a review of modelling efforts and policy developments in the European Union. Biotechnol Biofuels. 2014;7:35.
- Taheripour F, Tyner WE. Induced land use emissions due to first and second generation biofuels and uncertainty in land use emission factors. Econ Res Int. 2013;2013:1–12.
- Hertel T, Tyner W, Birur D. The global impacts of biofuel mandates. Energy J. 2010;31:75–100.
- Wicke B, Verweij P, van Meijl H, et al. Indirect land use change: review of existing models and strategies for mitigation. Biofuels. 2012;3:87–100.
- Plevin RJ, Beckman J, Golub AA, et al. Carbon accounting and economic model uncertainty of emissions from biofuels-induced land use change. Environ Sci Technol. 2015;49(5):2656–2664.
- Verstegen JA, van der Hilst F, Woltjer G, et al. What can and can't we say about indirect land-use change in Brazil using an integrated economic - land-use change model ? GCB Bioenergy. 2016;8:561–578.
- Delzeit R, Klepper G, Söder M. An evaluation of approaches for quantifying emissions from indirect land use change. Kiel (Germany): Kiel Institute for the World Economy (IfW); 2016. No.: 2035.
- Dunkelberg E. A case-study approach to quantifying indirect land-use change due to expanding biofuels feedstock cultivation [dissertation]. Berlin (Germany): Technische Universität Berlin; 2014.
- The European Parliament and The Council of The European Union. Directive (EU) 2015/1513 amending Directive 98/70/EC relating to the quality of petrol and diesel fuels and amending Directive 2009/28/EC on the promotion of the use of energy from renewable sources. Official J European Union. 2015,58,L 239:1–62.
- Peters D, Spöttle M, Hähl T, et al. Methodologies for the identification and certification of Low ILUC risk biofuels. Utrecht (Netherlands): Ecofys; 2016.
- Wicke B, ,Brinkman M, Gerssen-Gondelach S, et al. ILUC Prevention strategies for sustainable biofuels: synthesis report from the ILUC prevention project. Utrecht (Netherlands): Copernicus Institute of Sustainable Development; 2015.
- RSB. RSB Low iLUC Risk biomass criteria and compliance indicators. Geneva (Switzerland): Roundtable on Sustainable Biomaterials; 2015.
- El Takriti S, Malins C, Searle S. Understanding options for ILUC mitigation. The ICCT Working Paper. Washington DC (USA): International Council on Clean Transportation; 2016. ( Working paper 2016-23).
- Brinkman MLJ, Wicke B, Gerssen-Gondelach SJ, et al. Methodology for assessing and quantifying ILUC prevention options. Utrecht (the Netherlands): Copernicus Institute of Sustinable Development; 2015.
- Brinkman MLJ, Wicke B, Faaij APC. Low-ILUC-risk ethanol from Hungarian maize. Biomass Bioenergy. 2017;99:57–68.
- Gerssen-Gondelach SJ, Wicke B, Borzęcka-Walker M, et al. Bioethanol potential from miscanthus with low ILUC risk in the province of Lublin, Poland. GCB Bioenergy. 2016;8:909–924.
- Van der Laan C, Wicke B, Verweij PA, et al. Mitigation of unwanted direct and indirect land-use change - an integrated approach illustrated for palm oil, pulpwood, rubber and rice production in North and East Kalimantan, Indonesia. GCB Bioenergy. 2017;9:429–444.
- Gerssen-Gondelach SJ, Wicke B, Faaij APC. GHG emissions and other environmental impacts of indirect land use change mitigation. GCB Bioenergy. 2017;9:725–742.
- Hoefnagels R, Smeets E, Faaij A. Greenhouse gas footprints of different biofuel production systems. Renew Sustain Energy Rev. 2010;14:1661–1694.
- Valin H, Peters D, van den Berg M, et al. The land use change impact of biofuels consumed in the EU Quantification of area and greenhouse gas impacts. Utrecht (The Netherlands): Ecoys; 2015.
- EurObsev'ER. Biofuels barometer. 2014.
- Kluts I, Wicke B, Leemans R, et al. Sustainability constraints in determining European bioenergy potential: A review of existing studies and steps forward. Renew Sustain Energy Rev. 2017;69:719–734.
- Romania. National renewable energy action plan (NREAP). Bucharest (Romania): Government of Romania; 2010.
- INSSE Institut National de Satistica - National Institute of Statistics. INSSE - Statistical DB [Internet]. 2017 [cited 2017 Dec 7]. Available from: https://statistici.insse.ro/shop/?lang=en.
- van Dam J, Faaij APC, Lewandowski I, et al. Options of biofuel trade from Central and Eastern to Western European countries. Biomass Bioenergy. 2009;33:728–744.
- Cargill. Cargill and TTS investment will double the storage capacity of grain terminal Canopus Star JV at Constanta [Internet]. 2013 [cited 2015 Jan 28]. Available from: http://www.cargill.ro/en/press-center/NA3075937.jsp.
- Food and Agriculture Organisation. FAOSTAT [Internet]. 2016 [cited 2016 Dec 7]. Available from: http://faostat.fao.org.
- Brinkman MLJ, Pisca I, Wicke B, et al. ILUC prevention strategies for sustainable biofuels: Case study on the biodiesel production potential from rapeseed with low ILUC risk in Eastern Romania. Utrecht (Netherlands): Copernicus Institute of Sustainable Development; 2015.
- National Institute of Research and Development in Soil Science Agrochemistry and the Environment, ICPA. On NUTS 3 classified areas in Romania where the typical greenhouse gas emissions from cultivation of agricultural raw materials can be expected to be lower than or equal to the emissions reported under the heading ’Disaggregated default values for cultivation’ in part D of Annex V to Directive 2009/28/EC. Bucharest; 2010.
- European Commission. Commission Decision of 10 June 2010 on guidelines for the calculation of land carbon stocks for the purpose of Annex V to Directive 2009/28/EC. Official J European Union. 2010;53,L 151:19–41, .
- Tilman D, Balzer C, Hill J, et al. Global food demand and the sustainable intensification of agriculture. Proce Natl Acad Sci. 2011;108:20260–20264.
- Van Noordwijk M, Khasanah N, Dewi S. Can intensification reduce emission intensity of biofuel through optimized fertilizer use? Theory and the case of oil palm in Indonesia. GCB Bioenergy. 2017;9:940–952.
- Auernhammer H. Precision farming - The environmental challenge. Comput Electron Agric. 2001;30:31–43.
- Smith P, Martino D, Cai Z, et al. Greenhouse gas mitigation in agriculture. Philos Trans Royal Soc B: Biol Sci. 2008;363:789–813.
- Garnett T. Where are the best opportunities for reducing greenhouse gas emissions in the food system (including the food chain)? A comment. Food Policy. 2012;37:463–466.
- Halmajan HV, Nastase D, Vasile G, et al. Fertilisation practices in oilseed rape in Romania. Bull Univ Agric Sci Vet Med Cluj Napoca. 2007;63:69–72.
- Gina V, Halmajan HV, Ciuboata G. The influence of application timing of nitrogen fertilisers on yield components in oilseed rape. Bull Univ Agric Sci Vet Med Cluj Napoca. 2007;63: 321.
- World Bank. Indicators agriculture & rural development [Internet]. 2015 [cited 2015 Jan 31]. Available from: http://data.worldbank.org/indicator.
- Eurostat. Eurostat [Internet]. 2015 [cited 2015 Jan 31]. Available from: http://epp.eurostat.ec.europa.eu/.
- IIASA, FAO. Global Agro-ecological zones (GAEZ v3.0) [Internet]. 2012 [cited 2014 Oct 1]. Available from: http://www.gaez.iiasa.ac.at/.
- Eurostat. Glossary:Livestock unit (LSU) [Internet]. 2013 [cited 2016 Jun 24]. Available from: http://ec.europa.eu/eurostat/statistics-explained/index.php/Glossary:Livestock_unit_(LSU).
- Gerssen-Gondelach SJ, Lauwerijssen RBG, Havlík P, et al. Intensification pathways for beef and dairy cattle production systems: Impacts on GHG emissions, land occupation and land use change. Agric, Ecosyst Environ. 2017;240:135–147.
- Biograce. Biograce GHG calcualtion tool version 4c [Internet]. 2011 [cited 2014 Dec 12]. Available from: http://biograce.net.
- Neeft J. BioGrace calculation rules Version 4c. 2012.
- Rosas JF. Fertilizer use by crop at the country level (1990–2010). Card Working Papers. Ames (IA, USA): 2012. Report No.: 555.
- Burney JA, Davis SJ, Lobell DB. Greenhouse gas mitigation by agricultural intensification. Proc Natl Acad Sci. 2010;107:12052–12057.
- Cardoso AS, Berndt A, Leytem A, et al. Impact of the intensification of beef production in Brazil on greenhouse gas emissions and land use. Agric Syst. 2016;143:86–96.
- Cohn AS, Mosnier A, Havlik P, et al. Cattle ranching intensification in Brazil can reduce global greenhouse gas emissions by sparing land from deforestation. Proc Natl Acad Sci. 2014;111:7236–7241.
- Lywood W, Pinkney J. An outlook on EU biofuel production and its implications for the animal feed industry. In: Makkar H, editor. Biofuel co-products as livestock feed - opportunities and challenges. Rome (Italy): Food and Agriculture Organisation; 2012. p. 13–34.
- COMTRADE. International trade statistics database [Internet]. 2016 [cited 2016 Dec 7]. Available from: https://comtrade.un.org/.
- Fischer G, Nachtergaele FO, Prieler S, et al. Global agro-ecological zones (GAEZ): model documentation. Laxenburg (Austria) and Rome (Italy): IIASA/FAO; 2012.
- Noblet J, Fortune H, Dupire C, et al. Digestible, metabolizable and net energy values of 13 feedstuffs for growing pigs: effect of energy system. Anim Feed Sci Technol. 1993;42:131–149.
- de Wit M, Londo M, Faaij A. Productivity developments in European agriculture: relations to and opportunities for biomass production. Renew Sustain Energy Rev. 2011;15:2397–2412.
- Verchot L, Krug T, Lasco R, et al. Chapter 6: grassland. In: Eggleston H, Buendia L, Miwa K, et al., editors. IPCC guidelines for national greenhouse gas inventories. Volume 4: agriculture, forestry and other land use. Hayama (Japan): Intergovernmental Panel on Climate Change (IPCC) and Institute for Global Environmental Strategies (IGES); 2006. p. 6.1–6.49.
- Lasco R, Ogle S, Raison J, et al. Chapter 5: cropland. In: Eggleston HS, Buendia L, Miwa K, et al., editors. IPCC guidelines for national greenhouse gas inventories. Volume 4: agriculture, forestry and other land use. Hayama (Japan): The Intergovernmental Panel on Climate Change (IPCC) and Institute for Environmental Strategies (IGES); 2006. p. 5.1–5.66.
- Aalde H, Gonzalez P, Gytarsky M, et al. Chapter 2: generic methodologies applicable to multiple land-use categories. In: Eggleston HS, Buendia L, Miwa K, et al., editors. IPCC guidelines for national greenhouse gas inventoriesolume 4: agriculture, forestry and other land use. Hayama (Japan): The Intergovernmental Panel on Climate Change (IPCC) and Institute for Environmental Strategies (IGES); 2006. p. 2.1–2.59.
- Joint Research Centre. Soil projects >support to renewable energy directive [Internet]. 2010 [cited 2017 Nov 15]. Available from: http://eusoils.jrc.ec.europa.eu/projects/RenewableEnergy/.
- Weightman RM, Cottrill BR, Wiltshire JJJ, et al. Opportunities for avoidance of land-use change through substitution of soya bean meal and cereals in European livestock diets with bioethanol coproducts. GCB Bioenergy. 2011;3:158–170.
- FEDIOL. Annual statistics [Internet]. 2014 [cited 2014 May 16]. Available from: http://www.fediol.org/web/annual statistics/1011306087/list1187970189/f1.html.
- Lywood W, Pinkney J, Cockerill S. Impact of protein concentrate coproducts on net land requirement for European biofuel production. GCB Bioenergy. 2009;1:346–359.
- Mogensen L, Kristensen T, Nguyen TLT, et al. Method for calculating carbon footprint of cattle feeds - Including contribution from soil carbon changes and use of cattle manure. J Cleaner Prod. 2014;73:40–51.
- Kim S, Dale BE. Global potential bioethanol production from wasted crops and crop residues. Biomass Bioenergy. 2004;26:361–375.
- Vidican G. Assessing land reallocation decisions during transition in Romania. Land Use Policy. 2009;26:1080–1089.
- Schierhorn F, Müller D, Beringer T, et al. Post-Soviet cropland abandonment and carbon sequestration in European Russia, Ukraine, and Belarus. Global Biogeochem Cycles. 2013;27:1175–1185.
- Allen B, Kretschmer B, Baldock D, et al. Space for energy crops – assessing the potential contribution to Europe's energy future. London (UK): Institute for European Environmental Policy; 2014.
- INSSE. Recensământul general agricol 2010 (General agricultural census). Bucharest (Romania):Institutul National de Statistică; 2011.
- Pehnelt G, Vietze C. Quo vadis european biofuel policy: the case of rapeseed biodiesel. Jena Economic Reserach Papers. Jena (Germany): Friedrich Schiller University and the Max Planck Institute of Economics; 2013. Report No.: 2013–015.
- Gerssen-Gondelach S, Wicke B, Faaij A. Assessment of driving factors for yield and productivity developments in crop and cattle production as key to increasing sustainable biomass potentials. Food Energy Secur. 2015;4:36–75.
- Iagăr E, Gheorghe F, Dima I, et al. Efectivele de Animale si Productia Animală In Anul 2015. Bucahrest (Romania):Institutul National de Statistică; 2016.