
Abstract
The demand for online monitoring and control of biogas process is increasing, since better monitoring and control system can improve process plants stability and economy. A number of parameters in both the liquid and the gas phase have been suggested as process indicators (pH, alkalinity, VFA and H2, redox potential, biogas production rate, biogas composition, FOS/TAC ratio, COD and/or VS reduction). The present study proposes the use of complex sensors as a possible solution to engineer a consistent control system. Tests were performed to analyze the biogas coming from a biogas plant in which conditions of pre-overloading and overloading were artificially inducted. The different inducted functioning conditions were recognised using a FOS/TAC tester, or the ratio volatile organic acids/alkaline buffer capacity. The FOS/TAC ratio has long been recognized extending as far as the imminent inversion of the digester biology to be detected at an early stage. Data coming from the e-nose were sorted and classified according to FOS/TAC ratio as a reference method. Not all the sensors of the e-nose were reactive to manure digestates, but four of them, sensitive to aromatic compounds, ammonia alkanes and methane, resulted crucial in the samples identification. Results confirmed that the e-nose can discriminate different digestion conditions, demonstrating the possibility to reduce the number of sensors in this innovative tool for biogas control systems. However, this instrument cannot be considered a complete alternative to traditional analysis systems, as, for example, the FOS/TAC titration, but a supporting tool for a quick analysis of the system.
Introduction
In the last decade, the demand of renewable and green energies, sustainable techniques, the remarkable crisis in livestock production due to the income loss for the low meat price paid to the farmer and the rising of national meat production costs, has lead, especially in Northern Italy, to a wide diffusion of biogas plants (Holm-Nielsen et al. Citation2009). Moreover, the incentives granted by the government determined the wide diffusion of plants, especially in swine and cattle farms.
The anaerobic digestion occurring in biogas plants is a biotechnological process utilising waste to produce valuable biogas under anaerobic conditions. These plants, processing manure or slurry that can be added with biomasses for methane production present the necessity to be monitored, in order to achieve an optimal biogas production avoiding undesired unbalances in the substrate, as the so-called “overloading” induced by an overfeeding of the system.
In anaerobic digestion, substantially, there is the substrate conversion to mono- and oligomers (amino acids, long-chain fatty acids and saccharides), then the fermentation of the substrate mainly leads to volatile fatty acids (VFA), in particular acetic acid, followed by gases (H2, CO2), finally transformed to methane and CO2. In the meanwhile, the concentration of simple ions and pH varies. The factors affecting the status of anaerobic digestion can be mainly represented by drastic changes in plant feeding and environmental fluctuations, i.e. temperature (Ward et al. Citation2008). For this reason, a continuous monitoring of the plant and of digestion itself is necessary to avoid the instability of the system.
Nowadays, a wide number of indicators are used to monitor the correct anaerobic digestion, as VFAs evaluation (Boe et al. Citation2007, Citation2010), pH, redox potential, biogas production rate, biogas composition, FOS/TAC ratio, COD and/or VS reduction are also used. FOS is an acronym that stands for Flüchtige Organische Säuren, i.e. volatile organic acids, and is measured in mg HAceq/l, while TAC stands for Totales Anorganisches Carbonat, i.e. total inorganic carbonate (alkaline buffer capacity), and is measured in mg CaCO3/l. The FOS/TAC ratio has long been recognized as a guide value for assessing fermentation processes. It enables process problems extending as far as the imminent inversion of the digester biology to be detected at an early stage. Among these indicators, the FOS/TAC ratio intended as the ratio between VFA content and buffer capacity of the substrate is widely considered as the most crucial and direct indicators of the system status (Holm-Nielsen et al. Citation2008). The increase in VFA concentration is interpreted as the result of methanogenesis inhibition or the accumulation of acids that determines the organic overloading, and it implies a risk of process upset (Hansson et al. Citation2003; Zhang et al. Citation2009).
VFAs detection can be performed through fluorescence spectroscopy (Pearce et al. Citation2003; Madsen et al. Citation2011), near-infrared (NIR) spectroscopy (Nicolas et al. Citation2001), titration and gas chromatography (Cimander et al. Citation2002).
Unfortunately, because of the high complexity of biogas plants and fermentation status, the interrelations of the many involved parameters remain unclear most of the time. A wide adopted technique is to set a threshold values for some individual indicators like pH, VFA and FOS/TAC ratio. These parameters are considered as the most relevant state variables for process monitoring, but the detection of critical values can be evaluated when an undesired fermentation is already occurring.
For this reason, the electronic nose was utilized for the first time in a study performed by Nordberg et al. (Citation2000) to monitor the anaerobic digestion process. Adam et al. (Citation2013) applied this instrument in a similar trial to auto-alert and control the system.
The electronic nose is a biologically inspired system composed of an array of non-specific gas sensors (Pearce et al. Citation2003). When sensor responses are put together, they form a pattern, which is typical of the gas mixture presented to the array, in this way, the responses of the sensors produce patterns characteristic of each chemical mixture exposed to the sensor array. By presenting many different chemicals to the sensor array, a database of patterns is built up and used to train the pattern recognition system: this finally allows recognizing a gas mixture. More extensive information, about e-nose technology, can be found in Pearce et al. (Citation2003).
For the above-mentioned reasons, the aim of this work was to
determine the correct technique to use an e-nose as a discriminator in anaerobic digestion status and able to provide an early warning of anaerobic digestion process faults, especially in the case of organic overload, and
investigate, in particular, the ability of the single sensors of the electronic nose in estimating the fermentation status in lab-scale biogas plant, and to design, in future, a simplified low cost tool for biogas production monitoring.
Materials and methods
The lab scale reactors
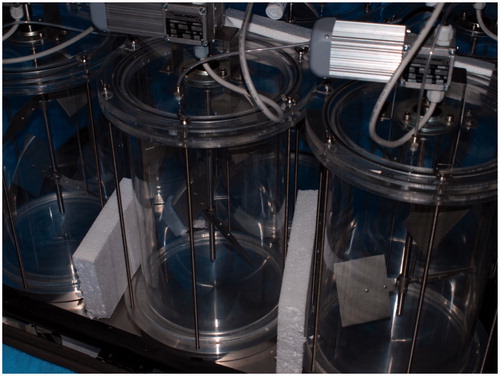
For the trial, three lab-scale reactors of 36 l of volume were used, 30 l of pig slurry were put in each of these tanks. There were three watertight transparent containers (see ) set up to recreate a real-scale digester plant, equipped with a mixer, a heater for the maintenance of the temperature (38 °C), sensors for measuring the temperature and the pH, supply ducts, and discharge of the effluent, gas outflow pipes, and inflow pipes for pH correctors. All ducts were supplied with valves to limit airflow exchanges. Tanks were covered with black clothes to avoid any potential effect of natural and artificial light.
Figure 1. The mini reactors used in the research.
The battery was set up to produce the digestate effluent containing known solutions of volatile fatty acids used as an indicator of the physical–chemical stability and efficiency of the fermentation process, simulating operating phases of optimal and sub-optimal overload. Total solids (TS) and volatile solids (VS) were evaluated in input and output biomasses.
The start-up phase of the process of anaerobic digestion consisted in a stationary phase of 45 d aimed to induce the stability in the fermentation. These conditions of stability were tested through the FOS/TAC ratio measurement and the pH value. At the end of the 45 d, the pig slurry was added with growing amounts of rice meal (see the following section) to overfeed the digestion in process and to induce an overloading situation, for 40 d of experimental study.
Manure sampling in the reactors
For the odorimetric analysis, the daily withdrawal of samples of slurry from the reactors was chosen as the methodology of collection sampling. During the experimental test, all the reactors were fed in the same way.
The daily amount of rice meal for the induction of the overload in the system was increased from 1.6 to 6.6 g/l/d since the sixth day of the test, to cause the establishment of the overloading process in the pilot plant.
Every day, four samples of 100 ml of digestate were taken from each reactor, for a total of 480 samples (four samples of 100 ml for 40 d of study). From every 100 ml sample, 50 ml were taken to be stored at −20 °C, in vials hermetically sealed with a rubber stopper, for the final analysis performed with the electronic nose. Samples were numbered according to the FOS/TAC ratio that was measured to be used as a reference method for correct/incorrect fermentation of the anaerobic digestion, described as follows.
The remaining part of the sample (50 ml) was analyzed by conventional methods to evaluate the pH and FOS/TAC ratio, through titration (TIM 840; HACH LANGE). In , a classification of the digestion type according to FOS/TAC values is reported (Mezes et al. Citation2011).
Table 1. Indications for the evaluation of FOS/TACs ratio (Mezes et al. Citation2011)
The 480 samples, ordered according to their FOS/TAC ratio value, were thawed out by keeping them for 24 h at 4 °C. Then the samples were brought to 38 °C using a thermostated sand bath, and kept at this temperature for 25 min in order to recreate the same conditions inside the reactors and, to allow the volatile fatty acids to volatilize and occupy the headspace of the vial. During sampling, two hypodermic needles were inserted through the rubber cap of the vial into the headspace. The first needle was connected to the sampling unit, while the second was connected to a charcoal filter by means of a polytetrafluoroethylene (PTFE, Teflon) hose.
Biogas production rate and organic-loading rate were monitored directly by the reactors weekly during the trial, as parameters were able to confirm the fermentation status described by FOS/TAC ratios.
Odour analysis: the electronic nose
Pig slurry (the biomass used in this trial) samples odour was analysed by means of a PEN 2 electronic nose (WMA Airsense, Schwerin, Germany), which consists of a sampling unit, a sensor array made up of 10 metal oxide semiconductor (MOS) chemical sensors, and a software for data storage and multivariate statistical processing (pattern recognition system).
The description of the nose sensors is reported in . Odour analysis was performed in a two-step way: measurement and standby. Electro-valves were controlled by a computer program and guided the air through different circuits depending on the stage of the analysis. Irrespective of the phase, airflow in the measurement chamber was kept constant. As described in , during the measurement phase, the sampling unit "inhaled" the volatile gases present in the headspace of the vial and sent them at a constant rate (6.67 ml s−1) to the measurement chamber causing changes in sensor’s conductance: this phase lasted 80 s, which was enough time for the sensor signals to reach a stable value.
Table 2. Densors of the PEN 2 electronic nose (WMA Airsense, Schwerin, Germany)
Table 3. Summary of the operating conditions of the e-nose during headspace analysis of manure odour).
When a measurement was completed, a standby phase of 160 s was activated. Its purpose was to clean the circuit and the measurement chamber, in particular, in order to return the sensor signals to their baselines. During this phase, clean air entered the circuit, crossing the measurement chamber first and pushing the remaining volatiles out of the circuit itself.
The 10 MOS chemical sensors comprising the sensor array operated by transduction of the chemical compounds in the manure aroma into electric signals (Yuwono & Lammers Citation2004; Pistis et al. Citation2013). At the end of the measurement, these signals were recorded and stored, to be analyzed either by the software of the pattern recognition system or by statistical analysis software. One pattern comprises the signals from all 10 sensors taken during the measurement of a sample.
The ratio (G/G0) between the conductance of each sensor, G (Ω−1), at each second of measurement, and the reference, G0 (Ω−1), which is the conductance that the sensor shows that when clean charcoal-filtered air enters, the measurement chamber expresses odour variation perceived by each sensor which is recorded by the software.
Statistical analysis
(a)
Results of pH and FOS/TA were submitted to variance analysis to evaluate significant differences (at least p < 0.05; Proc GLM, SAS Statistical package, 9.2, 2014, SAS Inc., Cary, NC) during the days of trial, corresponding to the expected different fermentation degrees for the induced overfeeding of the system. | |||||
| (b) | Data of conductance recorded by the e-nose software in the pattern (the signals from all the sensors taken during the measurement) were submitted to variance analysis to evaluate significant differences (at least p < 0.05) by each sensor in fermentation status recognition (Proc GLM, SAS Statistical package, 9.2, 2014, SAS Inc., Cary, NC). This model was chosen for the lack of a linear response between the dependent variables and the independent variables during the 40 d of the study. For these purposes, the following model was used in both analyses:
| ||||
| (c) | Data, obtained in the experimental study, were submitted to principal component analysis (PCA) that is a linear, unsupervised pattern-recognition technique very useful for analyzing, classifying and reducing the dimensionality of numerical datasets in multivariate problems (Todeschini Citation1998). For this purpose, the SAS Statistical package was used by applying the SAS Proc PRINCOMP Procedure, Statistical package, 9.2, 2014 (SAS Inc., Cary, NC). | ||||
Results
FOS/TAC ratio, pH, loading rate, biogas production rate, total and volatile solids
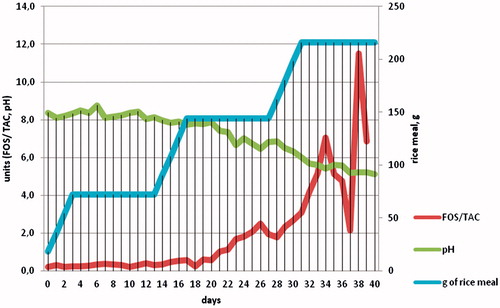
shows the trend of FOS/TAC ratio and pH of the slurry samples during the 40 d of trial that coincides with the beginning of rice meal addition after the start-up phase of 45 d, the blue line indicate the amount, in grams, of rice meal to induce the overloading in the reactors. No significant differences were detected in FOS/TAC ratios and pH values of samples collected from the three reactors. describes the mean values of those parameters.
Figure 2. FOS/TAC ratio and pH in the 40-d trial (after 45 d of start up phase), the red line indicates the addition of rice meal to overfeed the system.
TS and Vs mean values of inputs in the tanks were, respectively, 125.8 g kg−1 and 896.3 g kg−1 TS; TS and Vs mean values of output (digestates) were, respectively, 69.3 g kg−1 and 705.3 g kg−1 TS.
From , it is possible to see that until the 14th day of the trial, with a correct feeding of the lab scale biogas plant, the FOS/TAC ratio remained acceptable (0.35), but with the higher addition of rice meal, at day 16, the FOS/TAC ratio was higher than 0.5.
The trend of pH showed decreasing values from 8.37 to 5.22 in a reactor, during the stable phase, usually the pH should settle to values ranging between 7 and 8. It is clear that the overloading induced by rice meal addiction in the final stage of the test is deducible from very low values of pH, as the expression of the accumulation of volatile fatty acids and acidification. The pH, however, despite being able to indicate an imbalance of energy efficiency of the reactor, appears to be a late indicator, especially in the case of liquid slurry or manure, since the increase of volatile fatty acids can be masked by the high buffering capacity of substrate.
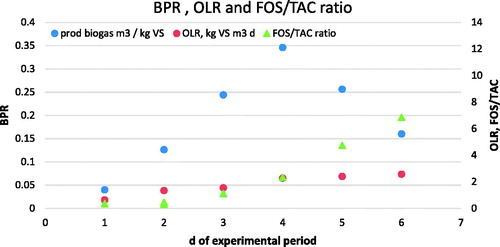
From , it can be observed that biogas production rate increased until the fourth week of the trial, but after a remarkable overfeeding given by rice meal addition, the gas production decreased by around 30%, together with the increase of FOS/TAC values.
Figure 3. BPR, OLR (loading rate) and FOS/TAC ratio during the 40-d trial.
E-nose analysis
Data obtained by the olfactometric analysis were processed by GLM procedure analyzing changes in sensor’s conductance in the days of the trial to evaluate which sensor was determinant in odour detection. No significant differences were found in the three reactors responses.
This procedure confirmed that the sensors most involved in the discrimination of fermentation process status were numbers 1, 3, 5 and 10 (respectively, with lsmeans of 0.87, 0.89, 0.86, 1.96; p < 0.01), while the other sensors did not show any ability on samples discrimination () during the day of the experimental study.
Table 4. Lsmeans of e-nose sensors response to manure samples.
The score plot () provided by PCA analysis reports the difference between samples collected during correct fermentations, pre-overloading and overloading processes in the mini reactors. Since no significant difference, from odorimetric point of view, between the four samples daily collected from each lab-scale reactor and among the three reactors were detected, 40 samples were used in the multifactorial analysis. Samples analyzed by the e-nose were sorted in an ascending order according to FOS/TAC ratio that means, for example, that a low number is representative of a low FOS/TAC value.
Figure 4. Score plot provided by PCA related to manure samples olfactometric analysis.
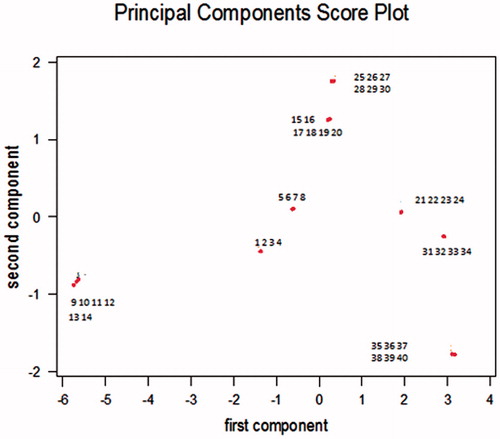
Samples collected during the overloading process account positively for the principal component 1 (x-axis) and negatively for principal component 2 (y-axis).
Slurry samples numbered from 1 to 20 correspond to a FOS/ Slurry samples numbered from 1 to 20 correspond to a FOS/TAC ratio ≤ 0.25; from 21 to 24 to a FOS/TAC ratio ranging from 0.26 to 0.38; from 25 to 30 to a FOS/TAC ratio ranging from 0.39 to 0.40; from 31 to 34 to a FOS/TAC ranging from 0.41 to 0.55; and from 35 to 40 a FOS/TAC higher than 0.55.
This classification represents a synthesis of studies conducted by Mezes et al. (Citation2011) and Lossie and Pütz (Citation2001), who declare that the FOS/TAC ratio of anaerobic digestion processes should be in the range of 0.3–0.4 (samples 15–30 accounting positively for the first and the second components), FOS/TAC ratios above 0.4 (accounting negatively for the second component) indicate instability process conditions, leading to a decrease in biogas production ().
Discussion
This study was performed to test the ability of a commercial e-nose to evaluate fermentation status in lab scale-biogas plants. The efficiency and the correct functioning of a reactor for anaerobic digestion can be performed through the detection of parameters that in most cases cannot function as “early warning” tools in undesired processes, as overloading. The acidification of the system can depend on different factors like substrate composition, trace element availability, reactor type, temperature, etc. Methane production, as expected, is normally the only continuously measured parameter at agricultural biogas plants, but this parameter cannot reflect a process imbalance, if the biogas plant treats substrates with changing composition. Also hydrogen and redox potential could represent useful control parameter, but complex dynamics and variability make the interpretation of the results uncertain (Brauer & Weiland Citation2009). Nowadays, only VFA can be used as an efficient tool indicating a process imbalance (Weiland Citation2010). Other authors suggest a ratio of propionic/acetic acid >1 as an indicator for digester failure, if the propionic acid concentration is higher than 1000 mg/l (Weiland Citation2008), while Ahring et al. (Citation1995) suggested that a combination of both butyrate and isobutyrate concentrations could be a reliable parameter for process failure detection. Nielsen et al. (Citation2007) found that propionate could be the optimal indicator to control biogas plant status and efficiency.
Although a fast control of the process stability is possible by determining the ratio of VFA to total inorganic carbonate by a simple titration test, or calculating the FOS/TAC ratio (Rieger & Weiland 2006), and if the ratio is <0.3, the process is stable, and an analysis for determining the individual VFAs is not necessary (Lossie & Pütz Citation2008), an e-nose could improve a prompt detection in digestion plant failure: our results are in agreement with studies conducted by Adam et al (Citation2010, Citation2013) and Stockl et al. (2013).
In the first monitoring campaign conducted by Adam et al. (Citation2010), different substrates (corn oil and a mixture of sucrose and corn oil) were used for 60 d, the trial showed that it was not possible to conduct a comparison between different digesters, but that each anaerobic digester and that the fermentation occurring in it are unique and not repeatable in a broad sense.
This confirms that the characterisation of an odorous compound could allow the identification of the substrate and the biomass used for the generation of biogas.
A proper management of the anaerobic digestion is extremely important because it is the first step for the economic success of the enterprise and it is of great interest to identify alternative control systems to monitor the digestion status in a faster way: in this trial, the pH variation occurred 5 d later than the detection of an overloading situation by the e-nose.
The development of new technologies for monitoring in real-time the anaerobic digestion status could lead to the full potential of biogas plants, and to early identify imbalances in the process (Ward et al. Citation2008; Adam et al. Citation2013; Stockl et al. Citation2013).
Conclusions
Nowadays, anaerobic digestion control is only able using high-tech analysis, such as VFA determination by GC-MS or HPLC and the FOS/TAC ratio. Results of these analyses are expensive and available later after sampling.
This test showed, in agreement with other recent studies, the real possibility of using the electronic nose to achieve an effective continuous monitoring of the anaerobic digestion process carried out in laboratory scale in “real time”.
The real novelty of this study is the demonstration of the possibility to reduce the number of sensors in the architecture of an electronic nose, since only sensors 1, 3, 5 and 10 showed an effective reactivity in fermentation status recognition, while the others did not show variation in the signal response to fermentation changes.
This indication could lead to a specific e-nose for monitoring the anaerobic digestion efficiency with a limited number of sensors: the specific aim is to get a simplified low- cost e-nose specifically devoted to "early monitor” anaerobic digestion in biogas plants.
This study represents a preliminary research that needs to be tested in real conditions to be applied in bio gas plants.
References
- Adam G, Roland N, Lemaigre S, Romain A, Delfosse P, Nicolas J. 2010. Potential of the electronic nose as a tool for the detection of disturbances in anaerobic digestion processes. In: IWWG(Ed.) Venice 2010 Third International Symposium on Energy from Biomass and Waste (2010, November).
- Adam G, Lemaigre S, Romain A, Nicolas J, Delfosse P. 2013. Evaluation of an electronic nose for the early detection of organic overload of anaerobic digesters. Bioprocess Biosyst Eng Eng. 36:23–33.
- Ahring BK, Sandberg M, Angelidaki I. 1995. Volatile fattyacids as indicators of process imbalance in anaerobic digesters. Appl Microbiol Biotechnol. 34:559–565.
- Boe K, Batstone DJ, Angelidaki I. 2007. An innovative online VFA monitoring system for the anerobic process, based on headspace gas chromatography. Biotechnol Bioeng. 96:712–721.
- Boe K, Batstone DJ, Steyer JP, Angelidaki I. 2010. State indicators for monitoring the anaerobic digestion process. Water Res. 44:5973–5980.
- Brauer A, Weiland P. 2009. Kontinuierliche Wasserstoffmessung zur Beurteilung der Prozessstabilität von Fermentationsversuchen. VDI_Berichte. 2057:2237–2247.
- Cimander C, Bachinger T, Mandenius C-F. 2002. Assessment of the performance of a fed-batch cultivation from the preculture quality using an electronic nose. Biotechnol Prog. 18:380–386.
- Hansson M, Nordberg A, Mathisen B. 2003. On-line NIR monitoring during anaerobic treatment of municipal solid waste. Water Sci Technol. 48:9–13.
- Holm-Nielsen JB, Andrèe H, Lindorfer H, Esbensen KH. 2007. Transflexive embedded near infrared monitoring for key process intermediates in anaerobic digestion/biogas production. J Near Infrared Spectrosc. 15:123–135.
- Holm-Nielsen JB, Lomborg CJ, Oleskowicz-Popiel P, Esbensen KH. 2008. On-line near infrared monitoring of glycerol-boosted anaerobic digestion processes: evaluation of process analytical technologies. Biotechnol Bioeng. 99:302–313.
- Holm-Nielsen JB, Al Seadi T, Oleskowicz-Popiel P. 2009. The future of anaerobic digestion and biogas utilization. Bioresour Technol. 100:5478–5484.
- Lossie U, Pütz P. 2001. Targeted control of biogas plants with the help of FOS/TAC. In Practice Report, Laboratory Analysis, Titration FOS/TAC; Hach Lange Ltd. Salford, UK
- Madsen M, Holm-Nielsen JB, Esbensen KH. 2011. Monitoring of anaerobic digestion processes: a review perspective. Renew Sustain Energy Rev. 15:3141–3155.
- Mezes L, Györgyi Biró, Erika Sulyok, Mihály Petis, János Borbély, János Tamás. 2011. Novel approach on the basis of FOS/TAC method. Analele Universitatii din Oradea, Fascicula Protectia Mediului. XVII:713–718.
- Nicolas J, Romain A-C, Andre P. 2001. Chemometrics methods for the identification and the monitoring of an odour in the environment with an electronic nose. In: Sensors and chemometrics. India: Research Signpost. pp. 75–90.
- Nielsen HB, Uellendahl H, Ahring BK. 2007. Regulation and optimization of the biogas process: propionate as a key factor. Biomass Bioenerg. 31:820–830.
- Nordberg A, Hansson M, Sundh I, Nordkvist E, Carlsson H, Mathisen B. 2000. Monitoring of a biogas process using electronic gas sensors and near-infrared spectroscopy (NIR). Water Sci Technol. 41:1–8.
- Pearce TC, Schiffman SS, Nagle HT, Gardner JW. 2003. Handbook of machine olfaction: electronic nose technology. New York: Wiley-VCH ISBN:978-3-527-60563-7.
- Pistis A, Asquer C, Scano EA. 2013. Anaerobic digestion of potato industry by-products on a pilot-scale plant under thermophilic conditions. Environ Eng Manag J. 11:93–96. Available from: http://omicron.ch.tuiasi.ro/EEMJ/.
- Stockl A, Löffler D, Oechsner H, Jungbluth T, Fischer K, Kranert M. 2013. Near-infrared-reflection spectroscopy as measuring method to determine the state of the process for automatic control of anaerobic digestion. Int J Agric Biol Eng. 6:63–72.
- Todeschini R. 1998. Introduzione alla Chemiometria. Ed. Italy: EDISES, Milano Chemometrics and QSAR Research Group.
- Ward AJ, Hobbs PJ, Holliman PJ, Jones DL. 2008. Optimisation of the anaerobic digestion of agricultural resources. Bioresour Technol. 99:7928–7940.
- Weiland P. 2008. Wichtige Messdaten für den Prozessablauf und Stand der Technik in der Praxis. Gülzower Fachgespräche. 27:17–31.
- Weiland P. 2010. Biogas production: current state and perspectives. Appl Microbiol Biotechnol. 85:849–860.
- Yuwono AS, Lammers PS. 2004 . Odor polluting in the environment and the detection instrumentation. In: Agricultural Engineering International : the CIGR Journal of Scientific Research and Development. 6, 1-33. (Invited Overview Paper).
- Zhang ML, Sheng GP, Mu Y, Li WH, Yu HQ, Harada H, Li YY. 2009. Rapid and accurate determination of VFAs and ethanol in the effluent of an anaerobic H(2)-producing bioreactor using near-infrared spectroscopy. Water Res. 43:1823–1830.