
 ?Mathematical formulae have been encoded as MathML and are displayed in this HTML version using MathJax in order to improve their display. Uncheck the box to turn MathJax off. This feature requires Javascript. Click on a formula to zoom.
Abstract
The availability of high-density single nucleotide polymorphism (SNPs) panels for humans and, recently, for several livestock species has given a great impulse to genome-wide association studies towards the identification of genes associated with complex traits and diseases. The frequentist and the Bayesian approach are commonly used to investigate marker associations with traits of interest. Briefly, the former is the most widely used method, being intuitive and easily to apply, whereas the latter requires deeper statistical knowledge, but has the advantage to include prior information to obtain a posterior probability of association. Both methods, however, require parameters or distributions to be set a priori by the researcher. In this work, we suggest a new empirical method for genome-wide studies (GWAS), which verifies marker-trait associations using the bootstrap resampling and Chebyshev’s inequality. This method, called Maximum Difference Analysis (MDA), was tested on a real dataset of 2093 Italian Holstein bulls with the objective of finding associations between SNPs and milk, fat and protein yield and fat and protein percentage. Results of the MDA method were compared with those obtained to a genome-wide association analysis performed using the R package GenABEL. In addition, we assessed the bovine annotated genes related to the traits under study. The MDA method was able to locate known important loci for milk productive traits, such as the DGAT1, PRLR, GHR and SCD. Moreover, some new putative candidate genes were detected. The python script of MDA procedure is available at www.animalbreeding.uniss.it.
Keywords:
Introduction
The cost-effective availability of high-density single nucleotide polymorphism (SNP) panels has boosted studies for the identification of genomic regions associated to complex traits and diseases in several livestock species (Hayes & Goddard Citation2010). SNP-markers are usually not directly responsible for the observed phenotypic variation. However, they are often co-inherited together (i.e. in Linkage Disequilibrium; LD) with an unknown causal variant and, in consequence, the study of such markers in a particular region of the genome can highlight the presence of polymorphisms influencing traits or diseases. In cattle breeds, the detection of such genetic differences is particularly interesting due to the strong artificial selection they have been subjected over the last 60 years (Qanbari et al. Citation2010). Many genome-wide association studies (GWAS) identified associations between markers and productive or functional traits in dairy cattle breeds (Pryce et al. Citation2010; Hayes et al. Citation2010). Frequentist and Bayesian approach are two statistical models commonly used in GWAS. Several issues, however, undermine the effectiveness of these studies. Both frequentist and Bayesian statistical models require assumptions reflecting the putative genetic architecture of the trait. However, different assumptions may lead to different results. In addition, standard linear models generally used in quantitative genetics account only for additive effects, not considering interactions between genes. In this case, a trade-off between either enhances the risk of obtaining large false positive associations or over-parameterised model structures could occur (Platt et al. Citation2010). The known stratification in cattle populations, due to genetic drift or to artificial selection (Ma et al. Citation2012), adds more complexity to the system and increases the risk of finding spurious associations, or not finding true ones. Actually, the genetic variance explained by markers is usually low, despite the implementation of polygenic effects that fit the genetic (co)variance between individuals using pedigree relationships (van Binsbergen et al. Citation2012). Finally, the sampling effect is a major issue in GWAS applied on livestock species. Consequently, except for associations to genes that explain large proportions of variance, such as the DGAT1 for milk production traits (Grisart et al. Citation2002), significant SNPs found in a particular sample of animals are often not validated in other independent samples.
A key point in association studies is the criteria used to declare a marker significantly associated to a specific trait. Since the beginning of the use of genome scans to study QTLs in livestock, many researchers have pointed out the problem of assessing a suitable threshold for statistical tests. The two main issues are represented by the approximation of the test statistics under the null hypothesis and by the multiple hypothesis testing, i.e. several non-independent tests performed over the same dataset (Churchill & Doerge Citation1994).
In frequentist methods, the issue of multiple testing is generally addressed applying a correction to the p value by using the Bonferroni criteria or the permutation test. The correction of Bonferroni is extremely conservative (i.e. it considers all SNPs independent, whereas most of them are really in LD), and usually discards almost all detected associations (Baldin Citation2006). On the other hand, the permutation test (Churchill & Doerge Citation1994) is less stringent, but it is unable to obtain a correct null hypothesis that takes into account the population sub-structure. As a result, considering the large number of markers currently tested in GWAS (tens of thousands), large number of false positives is expected.
On the other hand, the Bayesian approach requires several explicit assumptions about the prior probability of association (π), the parameter/trait distribution and the magnitude of the effects at the associated SNP. These assumptions are also needed to calculate the Bayes factor (BF). BF is similar to the likelihood-ratio and it is the ratio between the probabilities of the data under the alternative hypothesis (H1) and the null hypothesis (H0) (Stephens & Balding Citation2009). Small differences in π could lead to very different results about the posterior probability of association (Stephens & Balding Citation2009). Moreover, the BF evaluation requires complex computational procedures implementing the Markov chain Monte Carlo analysis that is time expensive.
In this paper, a new empirical method to perform genome-wide association test is proposed. The method, called Maximum Difference Analysis (MDA), is based on the comparison and the analysis of maximum differences between the genotypic frequencies of the best and the worst individuals ranked respect to a specific phenotype or trait. The use of only the best and worst groups is a technique widely used. In marketing research, maximum difference is a well-known model of best-worst choice formalised by Marley and Louviere (Citation2005) that gave results most discriminating in comparison with others methods of choice (Cohen Citation2003). A common test of association, where a population is split in two groups, is the case-control association testing. In this latter analysis, the frequency of single genotype or allele of the two groups are compared and therefore, by using a statistical test such as Pearson’s χ2 or Cochran-Armitage test, the association between a single SNP and a disease or phenotype is studied. Our proposed method could be considered as a kind of case-control analysis for quantitative traits where case-control groups were replaced by best-worst samples and the test of association is performed on all SNPs.
Beside frequentist and Bayesian methods, MDA can be considered as a third approach. Its features are: (i) it does not rely on any prior distributions of marker effects; (ii) it is not characterised by a complex mathematical structure, and (iii) the significance of marker association is retrieved from a posterior probability distribution obtained with a bootstrap resampling procedure. In this study, the MDA method was used to detect associations between SNP-genotypes and five productive traits of Italian Holstein bulls.
Milk production traits were considered in this study. Lactation is a complex process that involves many cell types and cell activities and, therefore, several genes. These traits have been largely investigated in GWAS and previous results were used to check the outcomes of the present study.
Materials and methods
The data
Data consisted of SNP genotypes belonging to 2093 Italian Holstein bulls, born between 1979 and 2007 genotyped with the Illumina Infinium BovineSNP50 BeadChip v.1. All SNPs were aligned to the Bos_taurus_UMD_3.1/bosTau6 reference assembly. Only SNPs located in the 29 autosomes, with missing data lower than 2.5%, were retained for the analysis. Monomorphic SNPs were not considered in the MDA approach. At the end of editing 45,348 markers were retained. Genotypes were coded as the number of copies of one SNP allele it carries, i.e. 0 and 2 for alternative homozygous alleles, 1 for heterozygous alleles. Phenotypes were deregressed proofs (Garrick et al. Citation2009) for milk yield (MY), protein yield (PY), fat yield (FY), fat percentage (FP) and protein percentage (PP) provided by the Italian Holstein Association (ANAFI).
Significant detected SNPs were used to define chromosomic regions (0.25Mb upstream and 0.25Mb downstream the significant marker) for performing gene search. Specific functional analysis and biological roles of the annotated genes were investigated by an accurate literature search and databases consultation such as GeneCards (www.genecards.org) and National Centre for Biotechnology Information (www.ncbi.nml.nih.gov).
The MDA method
The MDA is an empirical method able to detect common genotypic configurations shared by two different groups of animals selected respect to a particular trait T. Let nA be the total number of animals involved in the study and S a subset containing nS individuals randomly sampled from nA (nA*0.50 ≤ nS ≤ nA*0.65: 0.50 for large nA, 0.65 for small nA). Animals in S are sorted respect to T: animals with the highest values of T were labelled as best (B) and animals with the lowest values of T were flagged as worst (W). The assumption is that that bulls in subsets B and W, each of size nBW (nA*0.05 ≤ nBW ≤ nA*0.10), should have different allele combinations at loci affecting T. Indeed, B and W are two disjoint sets where animals in B have the best performances respect to the trait T. It is permissible to think that this property will also share from a genetic point of view. In particular, for loci that affect T, the animals in B will share a common genotypic configuration (i.e. AA) while a different genotypic configuration will be show by animals in W (i.e. AB or BB). If the previously hypothesis is confirmed for the subsets B and W of a large number of random sets S, then the considered loci detect genomic positions with a positive effect on the trait T. Moreover, for each marker, it is possible detect the desirable alleles for the considered trait. Loci with a negative effect on the trait are obtained when animals in W share a common genotypic configuration but different from that expressed by animals in B. To evaluate which are the common genotypic configurations in B, for each SNP, the genotype with the highest frequency (fB) in B is identified and compared with the corresponding genotypic frequency (fW) in W. The difference fB−fW is named maximum difference (MD). An example of MD calculation is reported in Table . For SNP1, the most frequent genotype in top ranked animals B is 2 (fB = 58). Its frequency in bottom ranked animals W is fW = 26. The maximum difference for SNP1 is therefore fB–fW = 32.
Table 1. Evaluation of maximum difference (MD) between the best group B and the worst group W.
The larger is the MD, the greater is the likely that the considered SNP influence the trait. Consequently, markers with low or negative MD values are uninformative and then discarded. In order to obtain the MD independent from the sample S and to reduce the problem of a possible underlying population structure, a resampling procedure is implemented. Ten thousand different random subsamples S are generated, from everyone, a couple of B and W groups are extracted and the corresponding MD is calculated. The final value of maximum difference MD for each SNP is obtained as the mean of the 10,000 replicates (MMD).
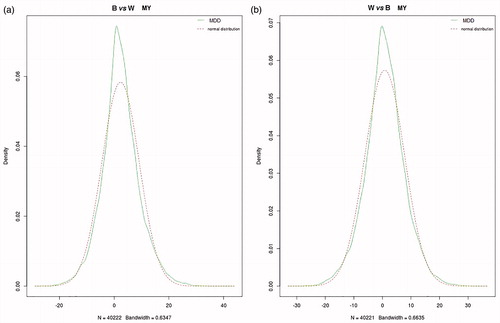
To assess if a MMD value is significant, an empirical threshold was set by using the Chebyshev’s inequality. If μMMD and σMMD2 are the mean and the variance of all MMDs evaluated across the entire genome, respectively, then
where k is an a priori fixed value. Since, the MMD probability distribution is roughly symmetric (Figure ), the previous inequality can be rewritten as:
Figure 1. Genome wide distribution of mean of maximum difference (MMD) for milk yield in Best vs Worst (a) and Worst vs Best (b). Dash line shoes the normal distribution with same mean and standard deviation of MMD. Genome wide distribution of means of maximum difference (MMD) for other four traits (FY, PY, FP and PP) showed a similar pattern.
If the threshold for association is fixed to 0.95, a marker is declared significantly associated with T if its MMD value verifies the relation:
(1)
(1)
In order to identify markers with positive and negative effect on the traits, the analysis was performed both B vs W, where MD = fB–fW and W vs B where MD = fW–fB.
The size of datasets S, B and W (nS and nB,W) were fixed in proportion to the number on animals in A (nA). In this study, values were nA = 2093, nS = 2093*0.55 = 1151 and nB,W =1151*0.09 = 103.
The MDA method was developed using a Python code (www.python.org) freely available at www.animalbreeding.uniss.it
The GenABEL method
In order to compare the MDA method with a ‘traditional’ approach, a GWAS was developed, with the same dataset, using the GenABEL R package (Aulchenko et al. Citation2007). Trait records were pre-corrected for polygenic effects that were included to account for genetic sub-structures. Then, the random residual of each individual from the polygenic model was used as a pre-corrected phenotype. A significance threshold, corrected for residual population inflation (i.e. lambda) of p ≤ 1 × 10−06 was used to declare a SNP significant.
Results
The MDA method detected a total of 479 significant SNPs. Table shows, for each trait, the distribution of associated markers across the 29 autosomes. More detailed information about such markers (i.e. name, position on the genome and distance from the nearest gene) are reported in (Supplementary Material S1).
Table 2. Distribution of SNPs associated with the considered five traits on the 29 autosomes (BTA).
Milk yield
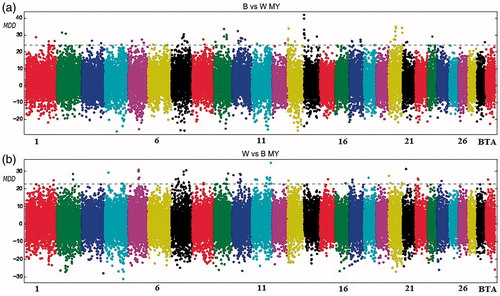
The whole genome analysis for MY (Figure ) shows a homogeneous pattern across chromosomes. One hundred twenty four SNPs were found to be over the threshold for this trait. In particular, a strong association was detected on BTA14 where DGAT1 locus maps (Figure ). Chromosomes 7 and 10 showed the higher number of significant SNPs (either with about the 13% of the total detected SNPs, see Table ). For MY, the MDA analysis identified several members of the solute carrier gene family, such as the solute carrier family 33, member 1 (SLC33A1) on BTA1, solute carrier family 13, member 1 (SLC13A1) on BTA4, solute carrier family 5, member 8 (SLC5A8) and solute carrier family 4, member 2 (SLC4A2) on BTA5, solute carrier family 22, member 7 (SLC22A7) on BTA23 and finally, in the telomeric region of the BTA11, a gene named golgin A1 (GOLGA1) (Supplementary Material S1).
Figure 2. Manhattan plot for milk yield with the mean of maximum differences (MMD) for all SNPs for Best vs Worst (a) and Worst vs Best (b). The horizontal line corresponds to Chebyshev’s inequality value when a threshold of 0.95 is fixed.
Fat yield
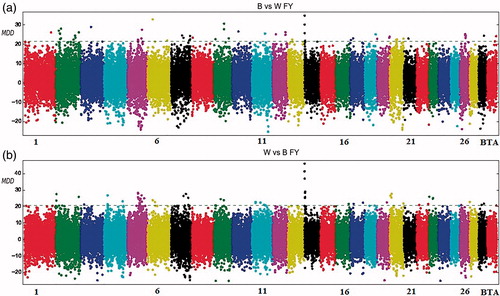
The chromosomes with the highest number of significant markers for FY (Table ) were BTA2 and BTA5, with 13 and 19 SNPs, respectively. In BTA5, three SNPs underline the apolipoprotein L, 3 (APOL3) gene at 75Mb while, on BTA7, the fatty acid binding protein 6, ileal (FABP6) locus was detected. These two genes are involved in the lipid metabolism. SNPs linked to the aforementioned genes, represent 12% and 17% of the total markers declared associated with the trait, respectively. A strong signal was detected on BTA14, in the region of DGAT1 when Worst-Best difference was considered (Figure ). This association was characterised by a low number of SNPs with high MMD value.
Figure 3. Manhattan plot for fat yield with the mean of maximum differences (MMD) for all SNPs for Best vs Worst (a) and Worst vs Best (b). The horizontal line corresponds to Chebyshev’s inequality value when a threshold of 0.95 is fixed.
Protein yield
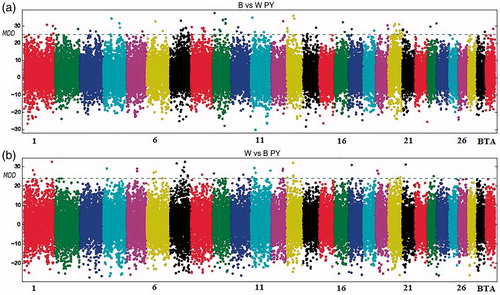
The MDA analysis on PY showed a similar pattern of the MDD values on all chromosomes (Figure ). Seventeen out of 29 chromosomes, for this trait, showed less than 4 significant associated SNPs (Table ), while in chromosomes 7, 9 and 20 an higher number of significant markers were detected. On BTA20, the ARS-BFGL-NGS18998 marker was found within the growth hormone receptor (GHR) gene.
Figure 4. Manhattan plot for protein yield with the mean of maximum differences (MMD) for all SNPs for Best vs Worst (a) and Worst vs Best (b). The horizontal line corresponds to Chebyshev’s inequality value when a threshold of 0.95 is fixed.
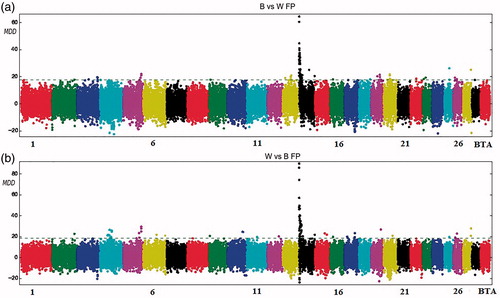
Fat percentage
Fifteen chromosomes had one or no SNP associated with FP. However, around 54% of the significant SNPs were located on BTA14 where DGAT1, cytochrome P450, family 11, subfamily B, polypeptide 1 (CYP11B1) and Thyroglobulin (TG) mapped (Table ). Figure show a strong signal of association on the centromeric region of the chromosome. Moreover, four SNPs were associated with FP on BTA26. In this autosome, the stearoyl-CoA desaturase (delta-9-desaturase) (SCD) gene was located at 21,1 Mb (Supplementary Material S1). Furthermore, on BTA4, the Hapmap50070-BTA-70041 marker highlighted the CD36 locus the thrombospondin receptor (CD36).
Figure 5. Manhattan plot for fat percentage with the mean of maximum differences (MMD) for all SNPs for Best vs Worst (a) and Worst vs Best (b). The horizontal line corresponds to Chebyshev’s inequality value when a threshold of 0.95 is fixed.
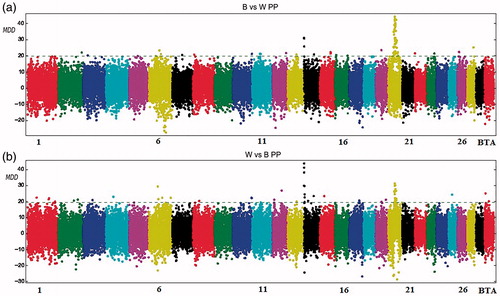
Protein percentage
The distribution of significant SNPs for the PP trait identified a strong association on BTA 14 (Figure ) and on BTA 20 (Figure ). Nearly 46% of the associated significant markers belonged to chromosomes 20 (Table ). On BTA2, the signal transducer and activator of transcription 1 locus (STAT1) were highlighted by the ARS-BFGL-NGS-38368 marker. On BTA6, the SNP named ARS-BFGL-NGS12812 was near the leucine aminopeptidase 3 (LAP3) locus, whereas on BTA14, the ARS-BFGL-NGS-4939 marker was located inside the DGAT1 gene. Moreover, on BTA20, in an interval of 1 Mb, six significant SNPs strongly associated with PP were detected. In this region, the prolactin hormone receptor (PRLR) locus, BRX1, biogenesis of ribosomes, homologue (S. cerevisiae) (BRIX1) and threonyl-tRNA synthetase (TARS) is mapped (Supplementary Material S1).
Figure 6. Manhattan plot for protein percentage with the mean of maximum differences (MMD) for all SNPs for Best vs Worst (a) and Worst vs Best (b). The horizontal line corresponds to Chebyshev’s inequality value when a threshold of 0.95 is fixed.
MDA method vs GenABEL
The GWAS developed with a ‘traditional’ approach using the GenABEL R package, yielded a total of 35 significant markers on four traits (PP, FP, MY and FY), whereas no marker was found associated with PY. The associated SNPs were distributed on four chromosomes: one SNP on BTA3 at 15.5 Mb, three SNPs on BTA5 between 94.5 and 94.6 Mb, 29 SNPs on BTA14 between 1.4 and 4.4 Mb and two SNPs on BTA20, one at 32 Mb and another at 33.5 Mb. Among the 35 significant SNPs, 15 were associated with a single trait, 6 with two traits, 8 with three traits and 6 with four traits. The five SNPs associated with four traits (FY, MY, FP, PP) were all located on BTA14 (Hapmap30383-BTC-005848; ARS-BFGL-NGS-57820; ARS-BFGL-NGS-3949; ARS-BFGL-NGS-103779; Hapmap25384-BTC-001997), in the region of DGAT1.
Moreover, GenABEL identified two SNPs associated with PP on BTA20, one at 32 Mb and another at 33.5 Mb, where receptor of growth hormone (GHR) gene was located. All the significant markers identified by using GenABEL were also found by MDA except a significant SNP on BTA3 (ARS-BFGL-NGS-64215) at 15.5 Mb (Supplementary Material S2).
Discussion
In the present work, a new empirical method named Maximum Difference Analysis was developed and used to detect associations between SNP markers and five productive traits on 2093 Italian Holstein Frisian bulls. The MDA approach was able to detect a total of 479 significant SNPs across the entire genome. A similar number of associated SNPs was obtained in analogue studies developed by using common GWAS approaches (Pryce et al. Citation2010; Jiang et al. Citation2010; Mai et al. Citation2010). The distribution of SNPs across the 29 autosomes and their positions was generally in agreement with results reported in literature (Jiang et al. Citation2010; Meredith et al. Citation2012). The number of significant markers detected for each trait seems to reflect the known genetic architecture of traits: a higher number of significant SNPs were found for yield compared to composition traits. It is well known that the genetic control of milk composition traits could be ascribed to a relatively small number of genes with a large or moderate effect (Grisart et al. Citation2002; Hayes et al. Citation2010), whereas a stronger polygenic background is hypothesised for yield traits (Hayes et al. Citation2010).
The study revealed a large number of SNPs associated with genes apparently not involved in a specific biological pathway affecting milk production. Lactation is a physiological process regulated by the interaction between the endocrine system and various target organs. During lactogenesis, tremendous functional and metabolic changes concerning the mammary gland are implemented. To support the production of large amounts of milk, the activities of transport of various nutrients and metabolites strongly increase in the epithelial cells of the mammary gland. This rapid increase in functional activities is primarily due to an increased activity of cells rather than a variation in the number of working cells (Finucane et al. Citation2008). Milk composition is heavily affected by mammary genes. However, variables as the nutritional status of lactating animals or the duration of breastfeeding offspring are important (Lemay et al. Citation2009).
In highly productive cattle breeds, as the breed analysed in this study, the mammary gland takes more than 80% of the metabolites produced by the digestive system for milk yield. In addition to glucose, long-chain fatty acids, acetate amino acids, high amounts of sodium, calcium and phosphate are required (Baik et al. Citation2009). In mammals, the transport of nutrients inside and outside the cells is mainly carried out by a class of molecules called solute carriers (Anderson & Thawaiters Citation2010). Associated to milk traits, the genome-wide analysis developed in this research was able to identify several members belonging to the large gene family of solute carriers (SLC). On BTA1, the SLC33A1 gene codes for a carrier of Acetyl-CoA, an important precursor of lipids, on BTA4 the SLC13A1 gene encodes for a carrier of ions (Na+/SO4-) (He et al. Citation2009). On BTA5, the SLC5A8 gene codes for a carrier of iodine in a passive manner and monocarboxilates and fatty acids through the sodium pump and SLC4A2 protein is involved in the glucose transport. Finally, on BTA23, the SLC22A7 is implicated on organic cations transport (He et al. Citation2009) (Supplementary Material S1). Solute carriers have already been reported by several studies concerning lactating mammary gland in cattle (Bionaz & Loor Citation2008).
The whole genome scan confirmed, as expected, the important role of major QTLs for milk traits on BTA14 (Grisart et al. Citation2002; Bennewitz et al. Citation2003), BTA20 (Blott et al. Citation2003) and BTA26 (Mele et al. Citation2007). Many association studies identified QTLs affecting FY and FP in the centromeric region of BTA14 (Pryce et al. Citation2010; Jiang et al. Citation2010; Meredith et al. Citation2012). The DGAT1 locus is an enzyme that catalyses the synthesis of diacylglycerols involved in several biological processes (Mai et al. Citation2010). The association between polymorphisms in the DGAT1 gene and milk fat content in dairy cattle has been evidenced in several breeds (Grisart et al. Citation2002). A non-conservative lysine to alanine substitution has a major influence on milk production traits and in particularly on fat and milk content (Gautier et al. Citation2007). Allele K (lysine) has a positive effect on the fat content in the milk while the allele A (alanine) on milk yield. Recently, Minozzi et al (Citation2013) during a GWAS using GenABEL R package on Italian Holstein cattle found the same associations highlighted by MDA among markers near DGAT1 and milk traits.
However, to explain the great genetic variability presented by milk production traits Bennewitz et al. (Citation2003) hypothesised the existence of a ‘masked’ QTL, in linkage with DGAT1, with a possible epistatic effect. This second QTL should be located nearby the cytochrome P450, family 11, subfamily B, polypeptide 1 (CYP11B1) gene (Mai et al. Citation2010). In cattle, this enzyme is involved in the lipogenesis and lipolysis mediated by corticosteroids. The MDA method identified both DGAT1 and CYP11B1 as major QTL affecting milk traits, since they are associated to four out of five traits analysed (MY, FY, FP and PP). On the same chromosome, MDA also identified the TG gene. The thyroglobulin is a glycoprotein precursor of hormones that influence lipid metabolism. Polymorphism in the 5'- UTR region of the TG locus has been suggested to affect intramuscular fat content and marbling traits in beef cattle (Hayes et al. Citation2010).
Recently, in a GWAS on the Japanese Black cattle breed, Ishii et al. (Citation2013) identified a significant number of SNPs affecting milk fatty acid composition in a region between 49 and 52 Mb of the BTA19. The fatty acid synthase (FASN) locus, contained in this region, was proposed as putative candidate gene affecting milk fatty acid composition. In the present research, the marker ARS-BFGL-NGS-39328 was found associated to FP, thus confirming the presence of a QTL for fat traits on BTA19 as suggest by Ishii et al. (Citation2013) (Supplementary Material S1).
On BTA20, a polymorphism on GHR locus is already reported by several authors as an important QTL affecting milk, fat and protein yield in dairy cattle (Blott et al. Citation2003).
Finally, on BTA26, a QTL for fat percentage was found on a wide region between 21.3 and 22.8 Mb. The Stearoyl- Co-A desaturase (SCD) gene is involved in the cellular biosynthesis of fatty acids and polymorphisms at this locus have already been proposed as useful for the improvement of milk production traits in gene assisted selection programmes (Macciotta et al. Citation2008).
Regarding PP, some significant SNPs were highlighted on chromosomes 2, 6, 14 and 20. The signal transducer and activator of tanscription 1 (STAT1) gene on BTA2 are involved in the development of mammary gland. Cobanoglu et al. (Citation2006) associated mutations in this locus with an increase in milk production and in fat and protein contents in Holstein cattle. On BTA6, the LAP3 gene was found associated with PP. Recently this locus was related to milk production by Zheng et al. (Citation2011). A significant marker, the BTA-92644-no-rs was located on BTA20 at 38.9 Mb, close to the prolactin receptor (PRLR) gene was found. In mammary gland, epithelial cells prolactin receptors are required for the normal development of the gland and for the milk protein gene expression (Kelly et al. Citation2002). Polymorphisms at this locus have already been reported as associated with protein yield in cattle (Viitala et al. Citation2006). Our results about the PRLR gene show that the B sample share the homozygote genotype in agreement with literature where the homozygote genotype is associated with increased milk performance (Supplementary Material S1).
Finally, the MDA method confirmed a significant marker (Hapmap500070-BTA-70041) on BTA4 affecting two milk content traits (FP and PP) previously reported in literature using expression studies. This SNP is linked to the CD36 molecule (thrombospondin receptor) (CD36) locus already reported by several authors (Bionaz & Loor Citation2008; Lemay et al. Citation2009) in an analysis of genes expressed in cattle during lactation and involution of mammary gland.
As in other GWAS (Smaragdov Citation2006; Pryce et al. Citation2010; Mai et al. Citation2010), in this research, 89 SNPs with significant effects on more than one trait were detected. In particular, 65 markers were associated with two traits while 21 with three traits and three with four traits (Supplementary Material S1). The genetic correlation can be the result of pleiotropic effects of single QTL affecting more than one trait or of linkage disequilibrium between two or more QTLs each affecting one trait only (Bolormaa et al. Citation2010). Therefore, the pleiotropic action of QTLs should be considered when an animal is selected for a particular breeding goal. More detailed investigations, such the use of much denser marker maps or full genome re-sequencing, would be necessary to identify causal mutations underlying economically important traits in dairy cattle.
The ‘traditional’ GWAS developed using the GenAbel R package, confirmed results obtained using the MDA method. A reduced subset of significantly markers was shared between two methods since GenAbel gave an emphasis almost exclusively to the DGAT1 gene. This was in accordance to a number of previous works since in different Holstein population this gene causes up to 50% of the phenotypic variance for milk yield, protein yield, fat yield, protein percentage and fat percentage (Smaragdov Citation2006).
Conclusions
MDA is a novel empirical method to perform genome-wide association studies. The attractiveness of the method lies on its simplicity and lack of assumptions. This technique was applied to five production traits on a population of Italian Holstein bulls, born between 1979 and 2007. Some selected SNPs were identified in regions of well-known genes that affect milk production traits. Moreover, the MDA detected several markers in common with other genome wide association studies and it was able to find markers located in regions highlighted in researches regarding the functional genomics field.
Generally, in GWAS studies, low numbers of markers are found significantly associated with traits under study. In dairy cattle, for example, a common outcome is the detection of significant markers mainly located on the BTA14, in the region of the DGAT1 locus. The MDA method was able to indicate a larger number of significant markers in comparison with one of the most popular approaches used in GWAS study, the GenAbel R package (Strucken et al. Citation2012; Minozzi et al. Citation2013). The reliability of the MDA, based on the resampling procedure and on the use of the Chebyshev’s inequality, together with the biological soundness of the detected genes, suggests that the obtained results should not be interpreted in terms of an increase of false positives, but as an evidence of the larger power of this method compared to more conservative approaches.
suppl.rar
Download (89.8 KB)Acknowledgements
Research funded by the Ministry of Agricultural, Food and Forestry Policies (MiPAAF, Italy) [Grant INNOVAGEN] and by the Fondazione CARIPLO [Grant PROZOO]. Authors wish also to acknowledge National Association of Italian Friesian Breeders (ANAFI, Italy) for providing phenotypic data and ?GenHome? project from the Italian Ministry of Science (MIUR).
Disclosure statement
The authors report no conflicts of interest. The authors alone are responsible for the content and writing of this article.
References
- Anderson CM, Thawaiters DT. 2010. Hijacking solute carriers for proton coupled drug transport. Physiology (Bethesda). 25:364–377.
- Aulchenko YS, Ripke S, Isaacs A, van Duijn CM. 2007. GenABEL: an R library for genome-wide association analysis. Bioinformatics. 23:1294–1296.
- Baik M, Etchebarne BE, Bong J, VandeHaar MJ. 2009. Gene expression profiling of liver and mammary tissues of lactating dairy cows. Asian-Australasian J Anim Sci. 22:871–884.
- Baldin DJ. 2006. A tutorial on statistical methods for population association studies. Nat Rev Genet. 7:781–791.
- Bennewitz J, Reinsch N, Grohs C, Levéziel H, Malafosse A, Thomsen H, Xu N, Looft C, Kühn C, Brockmann GA, et al. 2003. Combined analysis of data from two granddaughter designs: a simple multivariate analysis of a genome-wide association study in dairy cattle strategy for QTL confirmation and increasing experimental power in dairy cattle. Genet Sel Evol. 35:319–338.
- Bionaz M, Loor JJ. 2008. ACSL1, AGPAT6, FABP3, LPIN1, and SLC27A6 are the most abundant isoforms in bovine mammary tissue and their expression is affected by stage of lactation. J Nutr. 138:1019–1024.
- Blott S, Kim JJ, Moisio S, Schmidt-Kuntzel A, Cornet A, Berzi P, Cambisano N, Ford C, Grisart B, Johnson D, et al. 2003. Molecular dissection of a quantitative trait locus: a phenylalanine-to-tyrosine substitution in the transmembrane domain of the Bovine growth hormone receptor is associated with a major effect on milk yield and composition. Genetics. 163:253–266.
- Bolormaa S, Pryce JE, Hayes BJ, Goddard ME. 2010. Multivariate analysis of a genome-wide association study in dairy cattle. J Dairy Sci. 93:3818–3833.
- Churchill GA, Doerge RW. 1994. Empirical threshold values for quantitative trait mapping. Genetics. 138:963–971.
- Cobanoglu O, Zaitoun I, Chang YM, Shook GE, Khatib H. 2006. Effects of the signal transducer and activator of transcription 1 (STAT1) gene on milk production traits in Holstein dairy cattle. J Dairy Sci. 89:4433–4437.
- Cohen S. 2003. Maximum difference scaling: improved measures of importance and preference for segmentation. Sawtooth Software Conference Proceedings, Sequim, WA: Sawtooth Software, Inc., 530:61–74.
- Finucane KA, McFadden TB, Bond JP, Kennelly JJ, Zhao FQ. 2008. Onset of lactation in the bovine mammary gland: gene expression profiling indicates a strong inhibition of gene expression in cell proliferation. Funct Integr Genomics. 8:251–264.
- Garrick DJ, Taylor FJ, Fernando LR. 2009. Deregressing estimated breeding values and weighting information for genomic regression analyses. Genet Sel Evol. 41:55.
- Gautier M, Capitan A, Fritz S, Eggen A, Boichard D, Druet T. 2007. Characterization of the DGAT1 K232A and variable number of tandem repeat polymorphisms in French dairy cattle. J Dairy Sci. 90:2980–2988.
- Grisart B, Coppieters W, Farnir F, Karim L, Ford C, Berzi P, Cambisano N, Mni M, Reid S, Simon P, et al. 2002. Positional candidate cloning of a QTL in dairy cattle: identification of a missense mutation in the bovine DGAT1 gene with major effect on milk yield and composition. Genome Res. 12:222–231.
- Hayes BJ, Goddard M. 2010. Genome-wide association and genomic selection in animal breeding. Genome. 53:876–883.
- Hayes BJ, Pryce J, Chamberlain AJ, Bowman PJ, Goddard ME. 2010. Genetic architecture of complex traits and accuracy of genomic prediction: coat colour, milk-fat percentage, and type in Holstein cattle as contrasting model traits. PLoS Genetics. 6:e1001139.
- He L, Basiliou K, Nebert DW. 2009. Analysis and update of the human solute carrier (SLC) gene superfamily. Hum Genomics. 3:195–206.
- Ishii A, Yamaji K, Uemoto Y, Sasago N, Kobayashi E, Kobayashi N, Matsuhashi T, Maruyama S, Matsumoto H, Sasaki H, et al. 2013. Genome-wide association study for fatty acid composition in Japanese Black cattle. J Anim Sci. 84:675–682.
- Jiang L, Liu J, Sun D, Ma P, Ding X, Yu Y, Zhang Q. 2010. Genome wide association studies for milk production traits in Chinese Holstein population. PLoS One. 5:e13661
- Kelly PA, Bachelot A, Kedzia C, Hennighausen L, Ormandy CJ. 2002. The role of prolactin and growth hormone in mammary gland development. Mol Cell. Endocrinol. 197:127–131.
- Lemay DG, Lyn D, Martin WF, Neville MC, Casey TM, Rincon G, Kriventseva EV, Barris WC, Hinrichs AS, Molenaar AJ, et al. 2009. The bovine lactation genome: insights into the evolution of mammalian milk. Genome Biol. 10:R43–R18. doi: 10.1186/gb-2009-10-4-r43
- Ma L, Wiggans GR, Wang S, Sonstegard TS, Yang J, Crooker BA, Cole JB, Van Tassell CP, Lawlor TJ, Da Y. 2012. Effect of sample stratification on dairy GWAS results. BMC Genomics. 13:536.
- Macciotta NPP, Mele M, Conte G, Serra A, Cassandro M, Dal Zotto R, Borlino AC, Pagnacco G, Secchiari P. 2008. Association between a polymorphism at the stearoyl CoA desaturase locus and milk production traits in Italian Holsteins. J Dairy Sci. 91:3184–3189.
- Mai MD, Sahana G, Christiansen FB, Guldbrandtsen B. 2010. A genome-wide association study for milk production traits in Danish Jersey cattle using a 50K single nucleotide polymorphism chip. J Anim Sci. 88:3522–3528.
- Marley AAJ, Louviere JJ. 2005. Some probabilistic models of best, worst, and best–worst choices. J Math Psychology. 49:464–480.
- Mele M, Conte G, Castiglioni B, Chessa S, Macciotta NPP, Serra A, Buccioni A, Pagnacco Secchiari P. 2007. Stearoyl-coenzyme A desaturase gene polymorphism and milk fatty acid composition in Italian Holsteins. J Dairy Sci. 90:4458–4465.
- Meredith BK, Kearney FJ, Finlay EK, Bradley DG, Fahey AG, Berry DP, Lynn DJ. 2012. Genome-wide associations for milk production and somatic cell score in Holstein-Friesian cattle in Ireland. BMC Genetics. 13:21.
- Minozzi G, Nicolazzi EL, Stella A, Biffani S, Negrini R, Lazzari B, Ajmone-Marsan P, Williams JL. 2013. Genome wide analysis of fertility and production traits in italian holstein cattle. PLoS One. 8:e80219.
- Platt A, Vilhjálmsson BJ, Nordborg M. 2010. Conditions under which genome-wide association studies will be positively misleading. Genetics. 186:1045–1052.
- Pryce JE, Bolormaa S, Chamberlain AJ, Bowman PJ, Savin K, Goddard ME, Hayes BJ. 2010. A validated genome-wide association study in 2 dairy cattle breeds for milk production and fertility traits using variable length haplotypes. J Dairy Sci. 93:3331–3345.
- Qanbari S, Pimentel ECG, Tetens J, Thaller G, Lichtner P, Sharifi AR, Simianer H. 2010. A genome‐wide scan for signatures of recent selection in Holstein cattle. Anim Genet. 41:377–389.
- Smaragdov MG. 2006. Genetic mapping of loci responsible for milk production traits in dairy cattle. Russian J Genet. 42:1–15.
- Stephens M, Balding DJ. 2009. Bayesian statistical methods for genetic association studies. Nat Rev Genet. 10:681–690.
- Strucken EM, Bortfeldt RH, De Koning DJ, Brockmann GA. 2012. Genome-wide associations for investigating time-dependent genetic effects for milk production traits in dairy cattle. Anim Genet. 43:375–382.
- van Binsbergen R, Veerkamp RF, Calus MPL. 2012. Makeup of the genetic correlation between milk production traits using genome-wide single nucleotide polymorphism information. J Dairy Sci. 95:2132–2143.
- Viitala S, Szyda J, Blott S, Schulman N, Lidauer M, Maki-Tanila A, Georges M, Vilkki J. 2006. The role of the bovine growth hormone receptor and prolactin receptor genes in milk, fat and protein production in Finnish ayrshire dairy cattle. Genetics. 173:2151–2164.
- Zheng X, Ju Z, Wang J, Li Q, Huang J, Zhang A, Zhong J, Wang C. 2011. Single nucleotide polymorphisms, haplotypes and combined genotypes of LAP3 gene in bovine and their association with milk production traits. Mol Biol Rep. 38:4053–4061.