
Abstract
There are limited studies on the effects of transportation stress and stocking density under tropical conditions and their interactions with aging and muscle types on carcass and meat quality characteristics of goat. The present study investigated the effects of transportation and stocking density on carcass characteristics and meat quality traits of Longissimus dorsi, and Semimembranosus muscles in Boer goats. Thirty 1-year-old Boer goats, divided into two groups, were transported by road for 3.5 h, with density of 0.4 m2 and 0.2 m2 per animal, respectively; a third group which was not transported served as control. Meat pH, drip loss, cooking loss, tenderness and colour were measured from samples of the muscles. The transported goats had significantly lower carcass shrinkage, glycogen content, drip loss, tenderness, lightness, yellowness, hue-angle and chroma values compared to the non-transported group. In contrast, they showed significantly higher cooking loss and redness than the non-transported goats. Goats transported in high stocking density showed significantly (p < .05) higher live weight loss and lower dressing-out percentage than those in low stocking density. This study indicated that higher stocking density at pre-slaughter transportation increased shrinkage loss and deteriorated meat quality of goats. Therefore, using an appropriate density during transportation should be considered.
Introduction
Loading and handling of animal during pre-slaughter transportation are inevitable (Kannan et al. Citation2000). Handling and transportation stress are of the most important ante-mortem factors (Kannan et al. Citation2003). Transportation is an important pre-slaughter stressor, which adversely affects carcass quality by increasing shrinking loss and thus profitability of the meat production enterprise (Hartung Citation2003; Villarroel et al. Citation2003; Garcia et al. Citation2008). Pre-slaughter transportation as a stressor may also affect meat quality traits in goats by depleting the glycogen content of the meat (Kadim et al. Citation2006) and yielding darker and tougher meat (Muchenje et al. Citation2008). Colour is one of the most important aspects of meat appearance, which consumers use as an indicator of quality and freshness (Resurreccion, Citation2004). Meat colour is influenced by pH and aging duration (Tshabalala et al. Citation2003). On the other hand, there are economic motivations for loading animals densely during pre-slaughter transportation (Schwartzkopf-Genswein et al. Citation2012). Stocking density during transportation is an important factor which may influence the level of transportation stress, and may affect animal welfare. Grandin and Gallo, (Citation2007) demonstrated that high stocking density in cattle during transportation reduced carcass quality and increased carcass bruising, serious injuries or deaths. It has been proven that live and carcass weight losses during pre-slaughter transportation especially in small ruminants should be of economical concern (Romans et al. Citation1994).
In response to pre-slaughter stress, the hypothalamic-pituitary-adrenal axis acts to maintain homeostasis activities in transported animals, which can increase the catecholamines and cortisol hormone levels. This can result in energy depletion, protein catabolism and dehydration, which subsequently affect meat quality traits (Hwang et al. Citation2003; Foury et al. Citation2005; Ferguson & Warner, Citation2008). In tropical regions, such as Malaysia, the hot and humid climate may further increase transport stress and aggravate its effects on meat quality. Management of goats during pre-slaughter transportation not only affects animal welfare but also the profitability (Kannan et al. Citation2000; Kadim et al. Citation2006). Thus, reducing stress during handling and loading animals may decrease the physiological changes and consequently prevent productivity reduction (Grandin, Citation2002). An animal’s response to transportation may depend on its genetics, previous experience and the handler (Grandin, Citation1997). Economics, on the one hand, and the increased interest in farm animal welfare on the other, have created a need for more investigation into this subject (Hartung, Citation2003; Minka et al. Citation2009). It has also been known that sex, age and breed have physiological and/or genetic influence on meat quality (Sebsibe, Citation2008). Few studies have investigated the effect of transportation and stocking density on goat carcass and meat quality characteristics in tropical environment. The objective of this study was to evaluate the effects of transportation and stocking density during transportation on live weight loss, carcass characteristics and meat quality in Boer goats.
Materials and methods
A total of thirty 1-year-old Boer does, with an average live weight of 19.30 ± 2.56 kg, were used. All goats were from a single farm in Malaysia and subjected to similar routine management conditions. This study was conducted following the guidelines set by the animal ethics committee of Universiti Putra Malaysia.
The animals were randomly assigned into three pre-slaughter groups of 10 animals each, one day before transportation. Two groups were loaded in an open truck and transported by road for 3.5 h, with density of 0.4 m2 (TL) and 0.2 m2 (TH) per animal. For loading on trailer, each animal was swiftly and carefully caught without any excitement due to catching. The wooden trailer floor was covered with straw. The floor space was divided into two parts by a wooden partition. The TL and TH groups were placed in front and rear areas of the truck, respectively. The third group was not transported and served as a control (NT). The animals did not have access to any food or water during transportation. The average ambient temperature and relative humidity in the trailers during transportation, and for the control group were 31–32 °C and 85–88%, respectively. Individual does were weighed just before loading onto the trailer (BW1) and at the end of the journey (BW2) to assess live weight loss. The transported animals were unloaded gently, and immediately after weighing, the goats were slaughtered according to the Muslim (halal) method. The NT group was slaughtered in the same place and by the same method. After evisceration, the hot carcass was weighed (HCW) within 15 min of slaughter. Immediately after taking the first sampling, the carcasss were stored in the chiller (4 °C) and were weighed again after one day to record cold carcass weight (CCW). The HCW was used to estimate the dressing percentage using the formula (100 × HCW/BW2). The difference between hot and cold carcass weights (HCW − CCW) was used to calculate carcass shrinkage.
Meat samples were taken from the Longissimus dorsi (LD) muscle (between the 10th and13th vertebrae) and the Semimembranous (SM) muscle after 45 min (Day 0), 24 h (Day 1) and 7 days (Day 7) post-mortem. Two groups of meat samples were prepared (i) 6–8 g sampled at Day 0, Day 1 and Day 7 post-mortem, which were crushed, frozen in liquid nitrogen and stored individually at −80 °C; and (ii) 40–50 g sampled at Day 1 and Day 7, which had been sealed in vacuum plastic bags, labelled and stored at −80 °C.
Ultimate pH of muscle was evaluated by homogenising 1 g of the crushed frozen samples in 10 ml ddH2O on ice. The homogenised samples were left at room temperature until reached 15–18 °C, then the pH of each sample was measured using a pH metre (Mettler Toledo Ltd., Rose FE20, England). Three replicates were carried out for each sample.
Of the crushed and frozen muscles of Day 0, 100 mg was used to evaluate the muscle glycogen content. Determination of glycogen content was accomplished in five steps: sample preparation, standard curve preparations, hydrolysis, development and calculation, using glycogen assay kit (BioVision, Milpitas, CA). Quantification of the glycogen content was evaluated using a microplate reader (TECAN GENios A-5002, Austria) at optical density (OD) of 570 nm.
The larger samples from Day 1 and Day 7 were used to determine drip loss and cooking loss. Each individual sample was vacuum packed in plastic bags and then was kept for 1 and 7 (Day 1 and Day 7) days at 4 °C after weighing individually. Then, the samples were transferred to −80 °C freezer. At the time of evaluation, the plastic bags containing the frozen samples were thawed at 4 °C for 24 h, ensuring no overlapping. The samples were removed from plastic bags, dried with absorbent paper, and weighed. Drip loss or water-holding capacity was calculated as the difference between weights of a sample before packing in plastic bag and after thawing, and reported as percentage of initial weight (Barton-Gade et al. Citation1994; Bertram et al. Citation2001).
The samples used for evaluating of drip loss were used for evaluating cooking loss. The samples were cooked in a water bath at 80 °C until the inner temperature of the samples reached 78 °C. The inner temperature was measured using a thermometer probe (Hanna Instruments HI-7662) inserted in a meat sample in a bag. The cooked samples were dried with absorbent paper and reweighed. Cooking loss was calculated as difference between weights of sample before and after cooking, and reported as percent cooking loss of initial weight.
Colour measurements (L*, a* and b* values) were taken using a ColorFlex colorimeter (HunterLab, Reston, VA), after melting the frozen samples at 4 °C for 24 h. The samples were then placed with the freshly cut meat surface facing upwards on trays and exposed to air for 2 h. Each sample’s thickness was at least 1.5 cm. Chroma (C*); which describes vividness, was defined as C* = (a*2+ b*2)1/2; and hue-angle (h*), which describes the fundamental colour of a substance, was determined by h* = tan−1 (a*/b*). Meat tenderness values were evaluated using a TA. HD Plus Texture Analyser (Stable Micro System, Surrey, UK), fitted with Volodkevitch bite jaws, on three meat cores (1 × 1 × 3 cm) from each of the cooked muscle samples.
The effect of transportation stress and stocking density on live weight loss, dressing percentage and carcass shrinking loss were analysed using the generalised linear model procedure of SAS software (SAS 9.2, Cary, NC) (SAS Institute, Citation2011). The meat quality traits were analysed using the repeated measures procedure. Since it has been suggested that carcass characteristics and meat quality of goats can be affected by weight at slaughter (Marichal et al. Citation2003), live body weight was considered as a covariate in model, if its effect was significant for any of the traits. Least square means were estimated for all measured variables, and significant differences between the means were investigated by using the Duncan procedure.
Results and discussion
Comparison between the TL and TH groups showed that stocking density had significant (p < .01) influence on live weight loss (Table ). The high-density stocking increased the live weight loss by 68%. Broom (Citation2000) reported that high stocking density in transport vehicle caused greater physiological stress compared with low stocking density. Transportation stress has been associated with loss in live weight of goats (Kannan et al. Citation2002; Ambore et al. Citation2009), with increase in respiration and heart rates, dehydration and energy depletion during transportation (Das et al. Citation2001). Zulkifli et al. (Citation2010) reported that increase in stocking density from 0.4 m2 to 0.2 m2 per goat elevated the serum cortisol level in transported goats. High stocking density with little or no space may also cause social order during transportation and occurrence of fighting, which leads to increased stress, tension and anxiety (Kannan et al. Citation2002).
Table 1. Effects of transportation treatment on carcass traits (LSmeans ± SE).
Lu (Citation1989) reported that ambient temperatures above the critical temperature (35–40 °C) resulted in heat stress. In this study, the ambient temperature during the transportation and for NT group during 3.5 h before slaughtering (31–32 °C) was below the critical temperature and therefore, the temperature effect on the meat quality and carcass characteristics was probably equal for all experimental groups.
Dressing-out percentage was significantly (p < .01) different between TL and TH groups, but no significant difference was observed between TL and NT groups (Table ). This was probably due to the higher stress rate and energy consumption in the TH goats. The stress effect may have been enhanced by the combined effects of high-density stocking and transportation for the TH animals. Current findings indicate that stocking density plays an important role in influencing carcass dressing-out percentage of transported goats. Chai et al. (Citation2010) emphasised greater stress conditions impose high-energy demand in transported animals. Animals lose body weight when subjected to greater energy demands (Warriss Citation1993). Transportation stress might cause tissue dehydration as well (Degen & Kam Citation1992; Kadim et al. Citation2010). Kannan et al. (Citation2002) demonstrated that transportation and feed deprivation increased stress responses and consequently elevates live weight losses. Therefore, TH goats probably lost greater live weight than TL goats, due to more intense stress in higher stocking density during transportation.
Transported animals had significantly (p < .01) lower carcass shrinkage than NT animals, while no significant difference (p > .05) was found for the two stocking densities. Higher shrinkage in NT goats caused in this group showed significantly lower cold carcass weight than transported groups (Table ). The reason for this could be due to a change in hormonal profile of animals under transportation stress. The literature supports the role of adrenocortical response to transportation stress (Matthews & Parrott Citation1991; Kannan et al. Citation2000; Kannan et al. Citation2002; Zulkifli et al. Citation2010). Other literatures suggest stress causes high amounts of water loss via urination and breathing, and consequently higher tissue dehydration (Parker et al. Citation2003; Minka et al. Citation2009). Therefore, carcasss from animals under stress show significantly lower evaporation during cooling period.
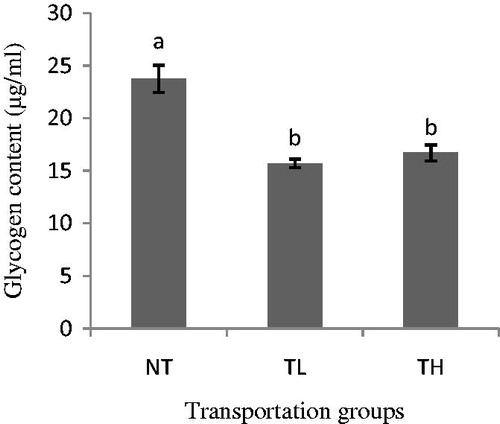
Effect of transportation on glycogen content was significant (p < .01); meat from the NT goats had higher glycogen content on Day 0 compared to that from the transported goats. However, no difference was observed between TH and TL goats (Figure ).
Figure 1. Effect of transportation and stocking density on glycogen content of goat meat on Day 1 (Mean ± SE).
The analysis of variance for pH showed an interaction effect between transportation and aging period. Least square means and standard errors of pH at Day 0–Day 7 are displayed in Table .
Table 2. Effects of muscle type, transportation group and days post-mortem (Day 0, Day 1, Day 7) on pH (LSmeans ± SE).
Meat samples from the transported group had significantly (p < .01) lower pH values than samples from the NT group at 45 min post-mortem, but there was no significant difference between the TL and TH groups. On Day 1 and Day 7, all the three groups had significantly (p < .01) different pH values. The TH meat had the highest pH and the NT meat the lowest value (Table ). This is probably because muscles of transported goats require more energy and liberate more lactate ante-mortem, causing greater muscle pH decline at Day 0. Analysis for glycogen content in this study confirmed this conclusion. Owing to muscle cell metabolic activation after slaughter, and lack of oxygen in tissues, muscle cells shift from oxidative phosphorylation to glycolysis for ATP generation (Shen et al. Citation2006). Pösö and Puolanne (Citation2005) also suggested that in the case of lack of oxygen in muscle cells, lactate is formed from pyruvate and transported out of the muscle fibres. On the other hand, since transportation stress decreased energy level of muscle cells, which is necessary for enzymatic activity post-mortem, glycogenase activity and the released lactate in NT goats was higher than in TL and TH goats on Day 1 and Day 7. According to Hwang et al. (Citation2003), stressors can accelerate glycogen catabolism and consequently cause decline in pH post-mortem. Kadim et al. (Citation2006) also reported that pre-slaughtering transported goats had significantly higher pH values than non-transported goats on Day 0. Apple et al. (Citation1995) claimed that the animals’ efforts to keep their balance in the moving vehicle increases energy consumption and leads to depletion of glycogen and, consequently, a decrease in pH of muscle. In addition, the release of adrenalin due to stress can increase glycogen breakdown in muscles (Gregory & Grandin, Citation1998). The significant difference in pH between TL and TH muscles could be due to stress from high stocking density that may have increased lactate concentrations and caused lower pH (Tadich et al. Citation2009; Miranda-de la Lama et al. Citation2011). There was no interaction between the muscle type and transportation for pH value.
Effects of muscle and transportation group on drip loss, cooking loss and meat tenderness (shear force) are presented in Table . The drip loss from transportation samples had significantly (p < .05) higher values than samples from TH group. The reason of this result is probably due to losing high amount of water under stress conditions. The amount of the residual water of muscle that could be passively released from samples was less than that of low-stressed animals. Since the TH group tolerated higher intensity of stress (e.g. transportation and high stocking density), it was expected to lose more water. This result closely agrees with the result of carcass shrinkage in this work. Such results are also consistent with the observations of Kadim et al. (Citation2006). The effect of muscle and, interaction of muscle and transportation were not significant on drip loss.
Table 3. Effects of muscle type and transportation group on drip loss, cooking loss and shear force values on Day 1 and Day 7 (LSmeans ± SE).
Statistical analysis showed that both muscles and transportation effects significantly influenced cooking loss, though their interaction was not significant. Both transported groups (TL and TH) had significantly higher cooking loss than NT goats, while no significant differences were observed between TL and TH (Table ). SM muscle had significantly (p < .05) higher cooking loss than LT muscle. Water-binding capacity is modified by pH and dropped from a high at higher pH to a low at lower pH (below 5.6). Decline in muscle pH may alter myofibrils structure and increase degradation of muscle protein (Hwang et al., Citation2003); subsequently, solubility of proteins decreases and drip loss increases. Decline in muscle pH may alter myofibrils’ structure and increase the degradation of muscle protein (Hwang et al. Citation2003), subsequently, solubility of proteins decreases and drip loss increases.
The effect of stress on cooking loss, in the present study, is similar with the results of Kadim et al. (Citation2006), and contradict those of Apple et al. (Citation1995), who found that muscles from stressed lambs had lower cooking loss percentages than those of control animals or contradict those of Kannan et al. (Citation2003) who reported that transportation stress had no effect on the water-holding capacity of goat meat. Variation in cooking loss between different studies may be due to different duration times, ambient temperate and type of stress. The cooking loss results revealed that SM muscles had higher cooking loss compared to LD muscles. This phenomenon is perhaps due to more contraction and tension on standing muscles, such as SM, compared to other muscles during transportation.
The present study showed that meat from the NT group was more tender than that from transported group with no significant difference between TL and TH goats (p < .05). Ultimate pH of muscle has a major influence on meat quality characteristics, including colour, water-holding capacity and tenderness (Watanabe et al. Citation1996; Villarroel et al. Citation2003; Kadim et al. Citation2006; Ekiz et al. Citation2012). For the most part, changes in meat tenderness are directly due to activity of the calpains. The calpains are primarily responsible for the post-mortem proteolysis of muscle myofibrillar proteins and consequently it is responsible for the increased meat tenderness during post-mortem storage (Goll et al. Citation1992; Koohmaraie, Citation1992; Koohmaraie et al. Citation2002). μ-Calpain has the greatest activity at pH 6.5 and its activity is decreased at lower pH, while pH doesn’t have a significant effect on calpastatin inhibitory percent (Maddock et al. Citation2005). Transportation as a stressor causes a decline in meat pH by accelerating lactate liberation and subsequently increases meat toughness. Table shows pH on Day 0 in NT goats is higher and in transported goats is lower than 6.5. Perhaps, this is the most important reason for differences in meat tenderness in transported and non-transported groups.
In agreement with these results, it had been reported that short-duration transportation at pre-slaughter increased meat toughness (Leheska et al. Citation2002; Shen et al. Citation2006). Similarly, Kannan et al. (Citation2003) reported that transported goats had less tender muscles compared with non-transported ones. Ferguson and Warner (Citation2008) demonstrated meat from an animal with less stress is more tender than from those with high stress. As displayed in Table , SM muscles had less tenderness than LD muscles. Since SM muscle was under more tension during transportation, its contraction was much greater, probably resulting in more glycolytic activity and a greater decline in pH, which caused to reduce its tenderness. Additionally, Lorenzen et al. (Citation2000) revealed that calpains’ activity is different among various muscles and hence, it may cause a range of tenderness of different muscles.
In the present study, L* and b* values were significantly (p < .001) higher and a* was significantly lower in meat from NT goats than those transported (Table ). Similar results were reported by Miranda-de la Lama et al. (Citation2009) and Kadim et al. (Citation2006). It has been stated that stress may cause dark-cutting meat (Klont et al. Citation2000; Bond et al. Citation2004; Miranda-de la Lama et al. Citation2011), which may be due to activity of catecholamines and adrenocortical steroid releasing (Greenwood & Shutt, Citation1992). Apple et al. (Citation1995) reported a negative correlation between redness and pH value. The L*, a*, and b* values of LD muscle were higher compared with SM muscles for all transported and non-transported groups (Table ). Meat colour is affected by concentration of muscle pigment, chemical structure of the pigment, structure of meat and pH (Lindahl et al. Citation2001). Other factors such as type of muscle, post-mortem aging and breed of animal may also affect meat colour (Kadim et al. Citation2004).
Table 4. Effects of muscle type and transportation group on colour traits (L*, a*, b*, hue angle and chroma) on Day 1 and Day 7 (LSmeans ± SE).
The hue-angle value of the NT goats was significantly lower than that of the transported goats, even though no difference was observed between TL and TH on Day 1; however, stocking density effect was significant on Day 7 (Table ). The chroma values of SM muscle were not significantly different among NS, TL and TH goats, but NT goats had significantly higher chroma than transported groups (p < .05). All meat colour traits were significantly influenced by body weight at slaughter. Transportation stress makes consumption of skeletal muscle glycogen and causes the formation of dark-cutting meat in animals (Warriss et al. Citation1990). Lawrie (Citation1958) concluded that activity of mitochondrial oxidase which is responsible for oxygen uptake by mitochondria is higher at pH values greater than 6.0. Transportation stress causes a reduction in pH on Day 0 and consequently may fail to inactive mitochondrial respiration, therefore prevents the changing deoxymyoglobin to myoglobin and, causing the muscle to remain dark. The colour of a meat surface depends not only on the quantity of myoglobin, but also on the relative proportions of the three main states of myoglobin on the surface (Kadim et al. Citation2006).
Conclusions
This study indicated that pre-slaughter transportation can cause significant effects on carcass shrinkage loss and all meat quality traits of transported goats. In the present study, higher stocking density during transportation caused an increase in carcass shrinkage loss and in deterioration of meat quality, such as meat colour traits and drip loss. Since profitability of animals is related to carcass and meat quality, choosing a proper stocking density during transportation should be considered.
Acknowledgements
The authors thank Prof. Dr Zulkifli Idrus for allowing collection of samples from the goats he had purchased.
Disclosure statement
The authors report no conflicts of interest. The authors alone are responsible for the content and writing of this article.
References
- Ambore B, Ravikanth K, Maini S, Rekhe DS. 2009. Haematological profile and growth performance of goats under transportation stress. Vet World. 2:195–198.
- Apple JK, Dikeman ME, Minton JE, McMurphy RM, Fedde MR, Leith DE, Unruh JA. 1995. Effects of restraint and isolation stress and epidural blockade on endocrine and blood metabolite status, muscle glycogen metabolism and incidence of dark-cutting longissimus muscle of sheep. J Anim Sci. 73:2295–2307.
- Barton-Gade P, Demeyer D, Honikel K, Joseph R, Puolanne E, Severini M, Smulders F, Tornberg E. 1994. Final version (I) of reference methods for water holding capacity in meat and meat products: procedures recommended by an OECD working group and pre presented at the 39th ICoMST in 1993. Proc. 40th ICoMST, Den Haag, Netherlands, Aug. 28–Sept 2 session V.05.
- Bertram HC, Andersen HJ, Karlsson AH. 2001. Comparative study of low-field NMR relaxation measurements and two traditional methods in the determination of water holding capacity of pork. Meat Sci. 57:125–132.
- Bond JJ, Can LA, Warner RD. 2004. The effect of exercise stress, adrenaline injection and electrical stimulation on changes in quality attributes and proteins in Semimembranosus muscle of lamb. Meat Sci. 68:469–477.
- Broom D. 2000. Welfare assessment and welfare problem areas during handling and transport. Livestock handling and transport. 2nd ed. Wallingford: CABI; p. 43–61.
- Chai J, Xiong Q, Zhang C, Miao W, Li F, Zheng R, Peng J, Jiang S. 2010. Effect of pre-slaughter transport plant on blood constituents and meat quality in halothane genotype of NN Large White × Landrace pigs. Livest Sci. 127:211–217.
- Das KS, Srivastava BB, Das N. 2001. Standing orientation and behaviour of goats during short-haul road transportation. Small Rumin Res. 41:91–94.
- Degen AA, Kam M. 1992. Body mass loss and body fluid shifts during dehydration in Dorper sheep. J Agr Sci. 119:419–422.
- Ekiz B, Ergul Ekiz E, Kocak O, Yalcintan H, Yilmaz A. 2012. Effect of pre-slaughter management regarding transportation and time in lairage on certain stress parameters, carcass and meat quality characteristics in Kivircik lambs. Meat Sci. 90:967–976.
- Ferguson DM, Warner RD. 2008. Have we underestimated the impact of pre-slaughter stress on meat quality in ruminants? Meat Sci. 80:12–19.
- Foury A, Devillers N, Sanchez MP, Griffon H, Le Roy P, Mormède P. 2005. Stress hormones, carcass composition and meat quality in Large White × Duroc pigs. Meat Sci. 69:703–707.
- Garcia LG, Nicholson KL, Hoffman TW, Lawrence TE, Hale DS, Griffin DB, Savell JW, Van Overbeke DL, Morgan JB, Belk KE, et al. 2008. National Beef Quality Audit–2005: survey of targeted cattle and carcass characteristics related to quality, quantity, and value of fed steers and heifers. J Anim Sci. 86:3533–3543.
- Goll DE, Thompson VF, Taylor RG, Christiansen JA. 1992. Role of the calpain system in muscle growth. Biochimie. 74:225–237.
- Grandin T. 1997. Assessment of stress during handling and transport. J Anim Sci. 75:249–257.
- Grandin T. 2002. Behavioural principles of livestock handling (with updates on Vision, Hearing, and Handling Methods in Cattle and Pigs). American Registry of Professional Animal Scientists. p. 1–11.
- Grandin T, Gallo C. 2007. Cattle transport. In: Grandin T, editor. Livestock handling and transport. 3rd ed. Wallingford, UK ; Cambridge, MA: CABI; p. 134–154.
- Greenwood PL, Shutt DA. 1992. Salivary and plasma cortisol as an index of stress in goats. Aust Vet J. 69:161–163.
- Gregory NG, Grandin T. 1998. Animal welfare and Meat Sci. Wallingford, UK: CAB International.
- Hartung J. 2003. Effects of transport on health of farm animals. Vet Res Commun. 27:525–527.
- Hwang IH, Devine CE, Hopkins DL. 2003. The biochemical and physical effects of electrical stimulation on beef and sheep meat tenderness. Meat Sci. 65:677–691.
- Kadim IT, Mahgoub O, Al-Ajmi DS, Al-Maqbaly RS, Al-Saqri NM, Ritchie A. 2004. An evaluation of the growth, carcass and meat quality characteristics of Omani goat breeds. Meat Sci. 66:203–210.
- Kadim IT, Mahgoub O, Al-Kindi A, Al-Marzooqi W, Al-Saqri NM. 2006. Effects of transportation at high ambient temperatures on physiological responses, carcass and meat quality characteristics of three breeds of Omani goats. Meat Sci. 73:626–634.
- Kadim IT, Mahgoub O, Al-Marzooqi W, Khalaf S, Al-Sinawi SSH, Al-Amri I. 2010. Effects of transportation during the hot season, breed and electrical stimulation on histochemical and meat quality characteristics of goat longissimus muscle. Anim Sci J. 81:352–361.
- Kannan G, Chawan CB, Kouakou B, Gelaye S. 2002. Influence of packaging method and storage time on shear value and mechanical strength of intramuscular connective tissue of chevon. J Anim Sci. 80:2383–2389.
- Kannan G, Kouakou B, Terrill TH, Gelaye S. 2003. Endocrine, blood metabolite, and meat quality changes in goats as influenced by short-term, preslaughter stress. J Anim Sci. 81:1499–1507.
- Kannan G, Terrill TH, Kouakou B, Gazal OS, Gelaye S, Amoah EA, Samake S. 2000. Transportation of goats: effects on physiological stress responses and live weight loss. J Anim Sci. 78:1450–1457.
- Klont RE, Barnier VMH, Van Dijk A, Smulders FJM, Hoving-Bolink AH, Hulsegge B. 2000. Effects of rate of pH fall, time of deboning, aging period, and their interaction on veal quality characteristics. J Anim Sci. 78:1845–11851.
- Koohmaraie M. 1992. The role of Ca(2+)-dependent proteases (calpains) in post mortem proteolysis and meat tenderness. Biochimie. 74:239–245.
- Koohmaraie M, Kent MP, Shackelford SD, Veiseth E, Wheeler TL. 2002. Meat tenderness and muscle growth: is there any relationship? Meat Sci. 62:345–352.
- Lawrie RA. 1958. Physiological stress in relation to dark-cutting beef. J Sci Food Agr. 9:721–727.
- Leheska J, Wulf D, Maddock R. 2002. Effects of fasting and transportation on pork quality development and extent of post-mortem metabolism. J Anim Sci. 80:3194–3202.
- Lindahl G, Lundström K, Tornberg E. 2001. Contribution of pigment content, myoglobin forms and internal reflectance to the colour of pork loin and ham from pure breed pigs. Meat Sci. 59:141–151.
- Lorenzen CL, Koohmaraie M, Shackelford SD, Jahoor F, Freetly HC, Wheeler TL, Savell JW, Fiorotto ML. 2000. Protein kinetics in Callipyge lambs. J Anim Sci. 78:78–87.
- Lu CD. 1989. Effects of heat stress on goat production. Small Ruminant Res. 2:151–162.
- Maddock KR, Huff-Lonergan E, Rowe LJ, Lonergan SM. 2005. Effect of pH and ionic strength on mu- and m-calpain inhibition by calpastatin. J Anim Sci. 83:1370–1376.
- Marichal A, Castro N, Capote J, Zamorano M, Argüello A. 2003. Effects of live weight at slaughter (6, 10 and 25 kg) on kid carcass and meat quality. Livest Prod Sci. 83:247–256.
- Matthews S, Parrott R. 1991. Dehydration, but not vasopressin infusion, enhances the adrenocortical responses of sheep to corticotropin-releasing hormone or restraint. Acta Endocrinol-Cop. 125:556–562.
- Minka NS, Ayo JO, Sackey AKB, Adelaiye AB. 2009. Assessment and scoring of stresses imposed on goats during handling, loading, road transportation and unloading, and the effect of pre-treatment with ascorbic acid. Livest Sci. 125:275–282.
- Miranda-de la Lama GC, Monge P, Villarroel M, Olleta JL, García-Belenguer S, María GA. 2011. Effects of road type during transport on lamb welfare and meat quality in dry hot climates. Trop Anim Health Prod. 43:915–922.
- Miranda-de la Lama GC, Villarroel M, Olleta JL, Alierta S, Sanudo C, Maria GA. 2009. Effect of the pre-slaughter logistic chain on meat quality of lambs. Meat Sci. 83:604–609.
- Muchenje V, Dzama K, Chimonyo M, Raats JG, Strydom PE. 2008. Meat quality of Nguni, Bonsmara and Aberdeen Angus steers raised on natural pasture in the Eastern Cape, South Africa. Meat Sci. 79:20–28.
- Parker AJ, Hamlin GP, Coleman CJ, Fitzpatrick LA. 2003. Dehydration in stressed ruminants may be the result of a cortisol-induced diuresis. J Anim Sci. 81:512–519.
- Pösö AR, Puolanne E. 2005. Carbohydrate metabolism in meat animals. Meat Sci. 70:423–434.
- Resurreccion AVA. 2004. Sensory aspects of consumer choices for meat and meat products. Meat Sci. 66:11–20.
- Romans JR, Costello WJ, Carlson CW, Greaser ML, Jones DC. 1994. The meat we eat. 13th ed. Danville, IL: Interstate Publishers.
- SAS Institute. 2011. The SAS system for Windows. Version 9.2. Cary, NC: SAS Institute.
- Schwartzkopf-Genswein KS, Faucitano L, Dadgar S, Shand P, González LA, Crowe TG. 2012. Road transport of cattle, swine and poultry in North America and its impact on animal welfare, carcass and meat quality: a review. Meat Sci. 92:227–243.
- Sebsibe A. 2008. Sheep and goat meat characteristics and quality. In: Yami A, Merkel RC, editors. Sheep and Goat Production Handbook for Ethiopia. Addis Ababa, Ethiopia: Ethiopian Sheep and Goats Productivity Improvement Programme (ESGPIP); p. 323–328.
- Shen QW, Means WJ, Thompson SA, Underwood KR, Zhu MJ, McCormick RJ, Ford SP, Du M. 2006. Pre-slaughter transport, AMP-activated protein kinase, glycolysis, and quality of pork loin. Meat Sci. 74:388–395.
- Tadich N, Gallo C, Brito ML, Broom DM. 2009. Effects of weaning and 48 h transport by road and ferry on some blood indicators of welfare in lambs. Livest Sci. 121:132–136.
- Tshabalala PA, Strydom PE, Webb EC, de Kock HL. 2003. Meat quality of designated South African indigenous goat and sheep breeds. Meat Sci. 65:563–570.
- Villarroel M, María GA, Sañudo C, Olleta JL, Gebresenbet G. 2003. Effect of transport time on sensorial aspects of beef meat quality. Meat Sci. 63:353–357.
- Warriss PD. 1993. Ante-mortem factors which influence carcass shrinkage and meat quality. In Proceedings of the 39th international congress of Meat Science and technology, August 1–6, Calgary, Alberta, Canada. p. 51–65.
- Warriss PD, Kestin SC, Young CS, Bevis EA, Brown SN. 1990. Effect of preslaughter transport on carcass yield and indices of meat quality in sheep. J Sci Food Agr. 51:517–523.
- Watanabe A, Daly CC, Devine CE. 1996. The effects of the ultimate pH of meat on tenderness changes during ageing. Meat Sci. 42:67–78.
- Zulkifli I, Norbaiyah B, Cheah YW, Soleimani AF, Sazili AQ, Rajion MA, Goh AYM. 2010. Physiological responses in goats subjected to road transportation under the hot, humid tropical conditions. Int J Agr Biol. 12:840–844.