
Abstract
The aim of this study was to estimate the genetic parameters for the ability of a sheep to rank among the top three in its age category (ABI3) and for its total score (TS) on the judgement championships held in different agricultural fairs in Brazil. Data files included 3180 records referring to 1896 animals for ABI3 and 4383 records referring to 2170 animals for TS. The relationship matrix was composed by 4069 animals. Variance components were estimated fitting threshold and linear animal models for ABI3 and TS, respectively, by Bayesian analysis using the Gibbs sampler. The posterior means of the heritability and repeatability were, respectively, 0.10 ± 0.07 and 0.57 ± 0.11 for ABI3 and 0.12 ± 0.04 and 0.31 ± 0.02 for TS. The low values for the heritabilities related to these traits reveal a strong influence of the environmental factors, as the differential management offered to the animals before and during the fair. The repeatability values for ABI3 suggest high correlation among the animal classifications in different fairs. However, for TS, the observed performance has moderate confidence to be repeated over time. We conclude that although reduced, there is genetic variability for the animal’s performance in agricultural fairs. Nevertheless, due to the low heritability estimates, the expected response to direct selection for ABI3 and TS will be low.
Introduction
In Brazil, agricultural fairs have great tradition on the livestock industry. These events are a way to evaluate and promote the performance of breeds based on morphological aspects. The winners at the judgement championships are generally used for breeding in the herds with the objective to transmit the same capacity to their offspring. However, due the subjective selection methods applied on animal judgement in agricultural fairs, based only on the phenotype, the genetic and environmental effects that could be associated with the observed variation between the animals are not accounted. Nevertheless, as well known, the genetic response by individual selection depends on the genetic variability of the trait of interest (Falconer & Mackay Citation1996). In cattle, some efforts have been done to understand this issue (Boostrom et al. Citation1986; Da Gama et al. Citation2014; Simielli Filho et al. Citation2014). However, the literature of our knowledge did not report studies of the sheep performance in judgement championships from a quantitative genetic point of view, despite its cultural importance for many breeders. In the judgement system promoted by the Brazilian Association of Santa Ines (ABSI), sheep are scored according to their rank in the disputed championships and each animal receives a final score (ABSI Citation2014). This information could be used as a trait to evaluate the animal’s performance in the championships. Another strategy could be evaluating the ranking within a particular category of age as a threshold trait. Therefore, the knowledge of the genetic parameters of these traits can indicate whether the judgement process on agricultural fairs presents some contribution to the genetic selection of the rams and thus can help developing an efficient selection strategy for the Santa Ines performance in judgement championships. Given the exposed, the aim of this study was to estimate genetic parameter for the ability of Santa Ines sheep rank among the top three in its age category and for its total score on the judgement championships held in different agricultural fairs occurred in Brazil, contributing to the knowledge about the genetic inheritance of this performance.
Material and methods
The data used in this study belong to the Brazilian Association of Santa Ines (ABSI), a breeders association of this sheep breed. Information about sire, dam, birth date and breeder of each animal, beyond ranking and scores in the disputed championship in 50 agricultural fairs were available in the databank. The agricultural fairs occurred between the years 2012 and 2014. The judgement championships were performed according to the age and the sex of the animals. For each sex, 17 categories of age were evaluated (Table ). Within each sex, the winners of the categories 1 and 2, and 3 and 4, respectively, compete in the Minor Future Sheep Championship and Major Future Sheep Championship, and thus the winners of these two championship compete in the Future Sheep Championship. The winners of the categories 5 and 6, 7 and 8, and 9 to 11 compete, respectively, the Junior Lamb Championship, the Minor Lamb Championship and the Major Lamb Championship. The winners of the categories 12 to 14 and 15 to 17 compete, respectively, the Young Sheep Championship and the Adult Sheep Championship. The winners of these championships (from 5 to 17 categories) compete in the Great Championship which awards three animals: the great champion, the reserve great champion and the third best animal of the breed. Scores (Table ) are attributed according to the animal position in each championship following the official regulation of the events (ABSI Citation2014). The following traits were analysed: ability of an animal to rank among the top three on the championships by category of age (ABI3) and its total score obtained during the event (TS). We have assumed that ABI3 has a Bernoulli distribution as phenotypic response. Therefore, we use ‘2’ to represent success, that is, the animal has been ranked at least in 3rd in its age category (1st, 2nd or 3rd) and ‘1’ to represent failure, for those ranked below 3rd place (from 4th to last place in its age category). Preliminary analysis indicated that TS presented a skew and overdispersed distribution, and it was required transformation to normalise data. Thus, the scores were evaluated after a logarithmic transformation where: TS = loge TS. Normality of residuals was tested using probability plots, skewness and kurtosis. After data transformation, the distribution of TS was symmetric and suggests a normal distribution (Figure ). The contemporary group for ABI3 was formed by animals that participated of the same agricultural fair, year of the event, sex and category of age. For TS, the contemporary group included animals of the same agricultural fair, year of the event, sex and type of highest award (Future Sheep Championship, until 8 age months or Great Championship, after 8 age months). For ABI3, contemporary groups with fewer than four observations were excluded to ensure the minimum variability necessary within groups. The final data files included 3180 records referring to 1896 animals for ABI3 and 4383 records referring to 2170 animals for TS. The relationship matrix included 4069 animals. One trait analyses were performed for both traits. The variance components were estimated by Bayesian approach using a threshold animal model for ABI3 and a linear animal model for TS. The general model used for the analyses can been written as follows:
Figure 1. Histograms of the total scores (TS) received by Santa Inês sheep in official agricultural fairs in Brazil, before (left) and after (right) data logarithmic transformation.
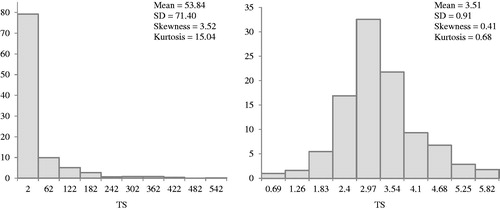
Table 1. Number of observations by sex after preliminary filtering analysis for animals that competed by age categories in Santa Inês sheep’s official judgement championships performed at different agricultural fairs in Brazil.
Table 2. Individual scores attributed to the awards received by Santa Inês sheep in official agricultural fairs in Brazil.
Where, y is the vector of observations; β is the vector of systematic effects; α is the vector of genetic additive effects; pe is the vector of permanent environmental effects; e is the vector of random residual effects; X, Z and W are incidence matrices relating the data to the systematic, genetic additive and permanent environmental effects, respectively. The systematic effects were the contemporary groups and breeder for ABI3 and TS, and also the linear effect of the age of animal for TS. For the threshold model, it was assumed that the observed response in the categorical scale was linked to an underlying continuous variable of normal distribution (Gianola & Foulley Citation1983) represented as:
Where, λ is a r × 1 vector of response in the underlying scale; θ = β, a, pe is a s × 1 vector of location parameters; W represents a known r × s incidence matrix; I is a r × r identity matrix and σ2e is the residual variance. The relationship between the categorical response for the ABI3 and the underlying scale can be expressed as:
Where, yi is the observed value for the individual i; t is a fixed threshold. It was assumed an arbitrary constant for the threshold (t = 1) due the identifiability constraints (Gianola & Foulley Citation1983). According to the Bayesian paradigm, the prior distributions for the parameters of the models were: β ∝ constant; p(α|σ2α) ∼ N (0, Aσ2α); p(pe|σ2pe) ∼ N (0, Iσ2pe) and p(e|σ2e) ∼ N (0, Iσ2e), in which A is the numerator relationship matrix between all animals; σ2α represents the genetic additive variance; I is an identity matrix; σ2pe is the permanent environmental variance and σ2e is the residual variance. Uniform prior distributions were assumed for β, σ2α, σ2ep and σ2e to represent a vague prior knowledge about these parameters. Marginal posterior distributions of the variables of interest were estimated using the Gibbs Sampler algorithm implemented in THRGIBBS1F90 for threshold traits and GIBBS2F90 for linear traits (Misztal et al. Citation2002). Based on Geweke (Citation1992) and Heidelberger and Welch (Citation1983) convergence statistics available at the BOA package (Smith Citation1997), we decided to use chain lengths of 1,500,000 and 500,000, with burn-in period of 150,000 and 50,000 and storage intervals of 15 and 10 samples for ABI3 and TS, respectively.
Results and discussion
The average for ABI3 was 1.37 (Table ), which means that 37% of the animals judged were ranked between 1st and 3rd places on the age categories. However, because of constraints in the original database, this average does not describe totally the real nature of the trait since only the first 15 animals are scored on the championships by category of age and have information in the databank. Therefore, this databank had no information about the other animals participating in the judgement and that was not scored. TS consists of the sum of individual scores obtained over the championships in a specific event. However, increase in the scores may be attributed depending on the event importance, referees number, judged animals number, and total of breeders and Brazilian States at the event (ABSI Citation2014). After logarithmic transformation, the TS average was 3.51 ± 0.91, with minimum and maximum of 0.69 and 6.33, respectively (Table ). The linear effect of the age of the animal on TS was positive (p < .01) implying that older animals tend to have better placing in the championships, probably due to the higher body development and better definition of the breed characters, which may affect the evaluation of the referees who use visual aspects related to weight, height, body length, among others. The analysis of the posterior distribution for the variance components, heritability and repeatability for the traits indicates that these parameters were obtained from a distribution that approximates to the Normal Distribution having generally close values for average, mode and median, except for the genetic additive variance of ABI3 in which the mode was lower (Table ). Symmetric posterior estimates may be evidence that the convergence was achieved in the analyses. Nevertheless, posterior marginal densities of the (co)variance components for some traits may have an Inverted Wishart Distribution, and the estimates for central tendency measures not necessarily have to be similar (Van Tassel et al. Citation1998). Furthermore, the Monte Carlo errors (MCE) for the posterior marginal densities of the parameters were low (Table ). MCE are important factors to evaluate the Gibbs Sampler adequacy. The posterior mean for the heritability of ABI3 was 0.10 ± 0.07. Nevertheless, the mode for this parameter was lower, corresponding to 0.05 (Table ). In this case, the mode can be considered as the most appropriate point estimate, because it reveals the more frequent value on marginal density. Posterior distribution for the heritability of ABI3 was not symmetric and with tendency to be close to zero (Figure ). There is 95% probability that the true value for ABI3 heritability lies between 0.00 and 0.24 (Table ). TS allowed a better phenotypic expression when compared to ABI3, since for each place in the championships it is attributed a specific score. Probably due to this, heritability for TS was slightly higher, with posterior mean of 0.12 ± 0.04 (Table ), a more symmetric distribution (Figure ) and a narrower probability confidence interval, between 0.04 and 0.19 (Table ). Therefore, the heritability for TS was not null (p < .05). Point estimates for the heritability of the traits were low, which means that within total observed difference between the judged animals in the agricultural fairs, only a small ratio may be explained by additive genetic variance. Thus, the response to direct selection for ABI3 and TS will be low. According to our results, environmental conditions were determinant to the Santa Inês success in the judgement championships. The expression of its performance is a complex set of morphological traits and others as temperament, conditional on the subjectivity of the evaluation of the referees and the differential management offered by the animal’s owners. Genetic studies in the literature for sheep performance in agricultural fairs were not found. In Nelore cattle, the heritability for animals ranked between 1st and 3rd (TOP3) in judgement championships was 0.18 estimated in two-trait analysis with yearling weight (Simielli Filho et al. Citation2014). Using Thurstonian procedures, Da Gama et al. (Citation2014) estimated heritability of 0.21 for the rank of Dairy Gir cattle in agricultural shows. Higher estimate of 0.35 was reported for Hereford show-ring placing (Boostrom et al. Citation1986). The average for the repeatability for ABI3 was 0.57 (Table ). This value suggests a moderate to high confidence that the same animal will present similar performance in future competitions, remaining between 1st and 3rd places in championships of the category of age. Successive wins by an animal in different agricultural fairs is an important criteria that contributes to disseminate its genetic material to the herds. Nevertheless, permanent environmental variance was much more important than genetic additive variance to explain the repeatability value (Table ). Da Gama et al. (Citation2014) also reported a high repeatability of 0.63 for Dairy Gir rank in cattle championships. TS repeatability was 0.31 (Table ), lower than the reported for ABI3. Thus, there is only a moderate probability that the same animal gets the highest score in all the events that it will contest. Naturally, the superior championships after the championship of category of age tend to be more disputed once joining the winners of each category.
Figure 2. Posteriori density for the heritability for the ability of an animal to rank among the top three in championships by category of age (ABI3) and the total score (TS) measured in championships of the Santa Inês sheep.
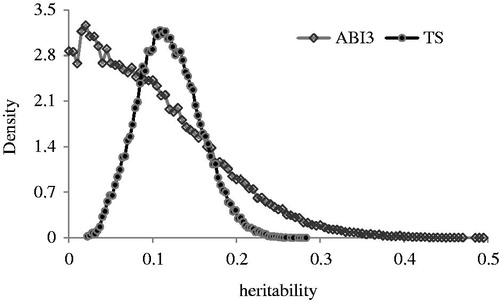
Table 3. Number of observations (n), number of known sires and dams on pedigree, mean ± standard deviation, minimum (Min) and maximum (Max) for the ability of an animal to rank among the top three in age categories (ABI3) and its total score (TS) measured in judgement championships of the Santa Inês breed sheep occurred at different agricultural fairs.
Table 4. Variance components, heritability and repeatability for the ability of an animal to rank among the top three in age categories (ABI3) and its total score (TS) measured in judgement championships of the Santa Inês breed sheep occurred at different agricultural fairs.
Conclusions
The current study was the first attempt to understand the genetic nature of the Santa Inês sheep ranking in agricultural fairs. Our results indicate that environmental factors have a great influence on the animals rank. Therefore, due to the low heritability estimates of the traits evaluated in our study, the expected response to direct selection for ABI3 and TS will be low. Nevertheless, although reduced, there is genetic variability for these traits. Further studies in order to assess the genetic association between the animals performance in agricultural-shows and others important economic traits are necessary.
Disclosure statement
The authors confirm that there is no known conflict of interest associated with this publication and are responsible for the content and writing of this article.
References
- Associação Brasileira De Santa Inês (ABSI). 2014. Regulamento geral de Exposições e competições oficiais da ABSI. Available from: http://www.absantaines.com.br/exposicoes/regulamento
- Boostrom DR, Slanger WD, Moore BL. 1986. Heritability and repeatability of Hereford show-ring placing and associated correlations with individual performance measurements and expected progeny differences. J Anim Sci. 6:1101–1107.
- Da Gama MPM, Araújo Neto FR, De Oliveira HN, Fernandes AR, Vercesi Filho AE, El Faro L, Paz CCP. 2014. Genetic parameters for rank of dairy Gir cattle in agricultural shows using Thurstonian procedures. Paper presented at: WCGALP Permanent International Committee and American Society of Animal Science. Proceedings of the 10th World Congress On Genetics Applied To Livestock Production, Vancouver (Canada).
- Falconer DS, Mackay TFC. 1996. Introduction to quantitative genetics. 4th ed. Essex, UK: Longman.
- Geweke J. 1992. Evaluating the accuracy of sampling-based approaches to the calculation of posterior moments. In: Bernardo JM, Berger JO, Dawid AP, Smit AFM, editors. Bayesian statistics 4, New York: Oxford University Press; p. 169–193.
- Gianola D, Foulley JL. 1983. Sire evaluation for ordered categorical data with a threshold model. Genet Genet Sel Evol. 15:201–224.
- Heidelberger P, Welch P. 1983. Simulation run length control in the presence of an initial transient. Oper Res. 31:1109–1144.
- Misztal I, Tsuruta S, Strabel T, Auvray B, Druet T, Lee DH. 2002. BLUPF90 and related programmes (BGF90). Paper presented at: International Committee for World Congress on Genetics Applied to Livestock Production. Proceedings of the 7th World Congress on Genetics Applied to Livestock Production, Montpellier (France), August 19–23.
- Smith BJ. 1997. Boa: an R package for MCMC output convergence assessment and posterior inference. J Stat Softw. 21:2–37.
- Simielli Filho EA, Mercadante MEZ, Vasconselos Silva JAI, Josahkian LA. 2014. Ranking of Nellore animals in cattle championships: genetic parameters and correlation with production traits. Genet Mol Res. 13:5722–5731.
- Van Tassel CP, Van Vleck LD, Gregory KE. 1998. Bayesian analysis of twinning and ovulation rates using a multiple-trait threshold model and Gibbs sampling. J Anim Sci. 39:2048–2061.