
Abstract
Social interactions among animals are general phenomena in domestic populations. However, at present, very little is known about the contribution of social effect to the selection efficiency of long-term response. In this study, the selection efficiency of a socially affected trait with different social effect was investigated in a closed nucleus population using stochastic simulation. Some key factors that affect selection efficiency of genetic social effect were also compared. The results showed social effect played an important role in a longer term breeding programme even though social effect had a small effect on the trait of interest. The percentage of expected total response contributed by social effect was up to 15.27 at the end generation under a very low level of social effect (0.3% direct phenotypic variance). The full model with direct and social genetic effect, improved the selection efficiency of social effect and resulted in 4.89, 5.21 and 2.70% more total cumulative selection response than the reduced model, without social effect, under the social effect size of 0.3, 1 and 10% direct phenotypic variance, respectively. The social effect size and group member number showed more effect on the selection efficiency of social effect than other factors.
Introduction
In a livestock farm, most animals are penned or caged together into contemporary groups. Competition and cooperation among individuals in the group are widespread (Muir Citation2005; Bijma et al. Citation2007; Bergsma et al. Citation2008; Chen et al. Citation2009), especially for traits related to growth and behaviour. In classical quantitative genetics, the phenotypic value of an animal can be modelled as the sum of its additive genetic effect and a residual component (Falconer & Mackay Citation1996). However, in some cases, such as the selection for survival in laying hens (Muir Citation1996), the genetic gain of the population did not respond as expected, although heritable variation still existed. One of the reasons for these phenomena may be the presence of social effects (Khaw et al. Citation2014). When interactions take place within contemporary groups of n animals, the phenotypic value of each animal can be modelled as the sum of a direct effect itself and the summed social effects due its n-1 group members because each individual affects the phenotypic values of n-1 group mates, and its value is also affected by its n-1 group mates. Both direct and social effects can be partitioned into a sum of heritable and non-heritable component in model. The heritable component of social effect is defined as social genetic effect, which is the genetic impact of an animal on the trait value of another animal (Muir Citation2005; Bijma et al. Citation2007; Ellen et al. Citation2007; Bergsma et al. Citation2008). Therefore, for a socially affected trait, in addition to the classical additive genetic effect, social genetic effect also should be considered in genetic evaluation model.
Some studies show that genetic gain of socially affected traits can be improved further by applying a selection strategy (such as kin or group selection) that considers both direct and social genetic effects (Muir Citation1996, Citation2005; Bijma et al. Citation2007; Bergsma et al. Citation2008). Moreover, when direct and social genetic variances are known, selection based on BLUP strategy can yield a higher response than the traditional group selection. In a swine breeding programme, competition within pen mates might affect growth and carcase performance. The estimations of heritability of social effects usually are very low in practical swine commercial populations (Cassady & Van-Vleck Citation2004; Arango et al. Citation2005; Chen et al. Citation2009). However, instead of heritability of social effects, the ratio between total genetic variance and total phenotypic variance as a measure of social effects, Bergsma et al. (Citation2013) showed that social effect contributed the vast majority of heritable variance in pig’s growth rate and feed intake.
However, all these studies just show the effect of a social effect to selection in a short breeding term and the influencing mechanism of social effect to longer term response is still unknown. The objective of this study was to investigate the potential improvement of social effect in a long-term breeding programme and compare the key factors to affect the selection efficiency of social genetic effect.
Materials and methods
The data simulated
A FORTRAN package developed by us was used to simulate a closed nucleus population with 10 discrete generations, in which, founder animals were assumed unrelated. Firstly, a base scenario was simulated. A trait with a phenotypic variance of 5.5 was supposed. For convenience, a variance of social effect was partitioned separately and defined as the social phenotypic variance (σPs2), and the original phenotypic variance of this trait were defined as direct phenotypic variance (σPd2). In this study, the σPs2 of was defined as 0.018 (0.3% of σPd2) based on the paper described by Ellen et al. (Citation2007). The direct and social heritability were defined as hd2 = σAd2/ σPd2 and hs2 = σAs2 / σPs2, where σAd2 and σAs2 are direct and social genetic variance, respectively. They both were assumed to be 0.5 in the base case. Genetic and non-genetic correlation between direct and social effect component were defined as 0.3 and 0, respectively. The number of sire and dam was 10 and 100, respectively. The size of contemporary group was 10. The detailed parameters are listed in Table .
Table 1. The parameters used in dataset simulated.
Table 2. The mean accuracy (r) and genetic gain (Δ G) of genetic direct (Ad), social (As) and total effect (At) based on a specific ratio of social phenotypic variance (Vs) and direct phenotypic variance (Vd).
In base population, 10 sires and 100 dams were simulated. Bivariate normal distribution was used to simulate the genetic direct and social effects of base animals (Khaw et al. Citation2014). In subsequent generations, 10 sires and 100 dams were selected based on total estimated breeding value (EBV), and they mated randomly. The progeny number of each dam was generated based on a normal distribution N (10, 6.25). Direct and social genetic effects of a progeny were calculated as the sum of the mean breading value of the parents and a Mendelian sampling deviation (Khaw et al. Citation2014). The Mendelian deviation sampled from a bivariate normal distribution with mean zero and variance 0.5 σ 2(1\, - \,0.5(Fs + Fd)), where, σ2 is genetic variance; Fs and Fd are the inbreeding coefficients of the sire and dam, respectively. For convenience, all members of a full sib family was assigned to a group if its size was smaller than the group size, and the remainder of this group came from another full sib family. The phenotypes of individuals were constructed according to the following equation:
Where, sexi is fixed sex effect (male: −0.05; female: 0); lj is litter effect, which samples from a normal distribution (N (0, 0.16)); adk is direct additive genetic effect, asm is social genetic effect, which sample from a bivariate normal distribution (), esm is social permanent environmental effect, which samples from a normal distribution (N (0, 0.38)); eijk is random residual effect, which samples from a normal distribution (N (0, 2.21)). For each scenario, 10 generations of selection were simulated. All cases were replicated 50 times.
Parameter comparison
For comparison, two additional scenarios for some parameters were also simulated (Table ). In each non-base scenario, the simulation parameters were same as the base scenario except for the comparison parameter. The detailed scenarios were listed as the following. Social heritability: 0.1 and 0.8; genetic correlation between direct and social effect component: −0.5 and 0.5; ratio of between social and direct phenotypic variance: 1% and 10%. Group size of 15 was simulated alone.
Statistical models
For comparison, two mixed linear models were designed to evaluate the breeding values of animals using DMU software (Madsen & Jensen Citation2006).
Model 1 (full model)
Both heritable and non-heritable direct and social effects were taken into account in this model. Non-genetic social permanent environmental effect was considered as random group effect (Bergsma et al. Citation2008). The estimated breeding value (EBV) was calculated using the following model:
Where, yijkm is the phenotypic observation; μ is the overall mean; sexi is the fixed sex effect; lj is the litter effect (random); gk is the random group effect; adm is the direct additive genetic effect (random) for individual m; asn is the social genetic effect for individual n to m; and eijkm is the random residual. Random effects for model 1 are assumed to be from a normal distribution N(0, V), where,
Model 2 (reduced model)
In this model, the social genetic effect was dropped and non-genetic social effect also was taken as random group effect. The EBV was computed using the model as follows:
Where, yijkm is the phenotypic observations; μ is the overall mean; sexi is the sex effect (fixed); lj is the litter effect (random); gk is random group effect; am is the classical animal additive genetic effect; and eijkm is the random residual. The variances of random effects in model 1 are assumed to be as follows:
Estimation of total breeding value
Because each animal interacts with n−1 others in a pen group, the total heritable effect of an animal to the mean trait value of the population is the sum of the animal’s direct breeding value and n−1 times its social breeding value (Bijma et al. Citation2007), where n is the group size. Thus, the total EBV (TEBV) of an animal was defined as follows,
Where, and
are the direct and social EBV of an animal, respectively.
In all scenarios (Table ), the evaluation model is based on model 1 and selection criterion of animal was TEBV. In the comparison of model 1 and model 2, the selection criterion in model 1 was TEBV, and in model 2 was direct EBV.
Selection accuracy
In this paper, three accuracies were defined. The correlation between TEBV and true direct breeding value (TDBV) judges the selection efficiency of direct additive genetic effect in breeding programme using TEBV. The correlation between TEBV and true social breeding value (TSBV) evaluates the selection efficiency of social genetic effects of individuals. The correlation between TEBV and true total breeding value (TTBV) evaluates the accuracy of total genetic effect.
Selection response
In each subsequent generation, the mean values of true direct, social and total breeding value minus the corresponding term in base generation were calculated as the cumulative selection response of direct, social and total genetic effect.
Results
The effect of size of social effect to selection efficiency
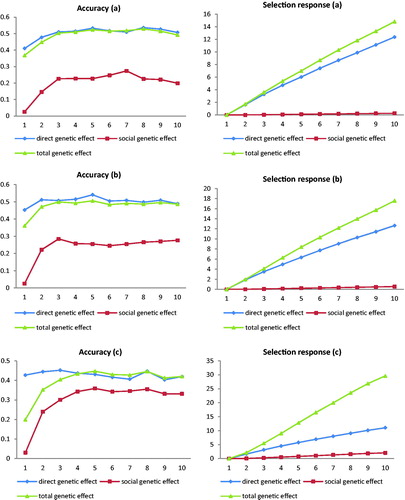
In this paper, the size of social effect was defined as the ratio of social phenotypic variance relative to direct phenotypic variance, i.e. bigger ratio; more social phenotypic variance was allocated. The selection accuracy (left side) and response (right side) under the ratio of 0.3% (a), 1% (b) and 10% (c) are shown in Figure . Comparing Figure , the accuracy of direct genetic effect was decreased with the increase of social effect, and therefore, its cumulative response also reduced with the increase of social effect size. The mean genetic gains of direct genetic effect in the entire selection process under the ratio of 1% and 10% were only 97.90% and 81.82% relative to 0.3%, respectively (Table ). In contrast, the accuracy of social genetic effect increased slightly with the increase of social effect size (Figure ), but the mean gain of social genetic effect under the ratio of 1% and 10% raised dramatically 233.33% and 733.33% relative to 0.3%, respectively (Table ). Based on that, the cumulative response of total genetic effect raised rapidly with the increase of social effect (Figure ), and the percentage of mean genetic gain under 1% and 10% relative to 0.3% were 120.12 and 185.80, respectively (Table ).
Figure 1. Selection accuracy and selection response for genetic direct, social and total effect based on the ratio of 0.3% (a), 1% (b) and 10% (c) between social phenotypic and direct phenotypic variance and statistical model 1.
The effect of social heritability to selection efficiency
The effects of social heritability to selection efficiency are showed in Table . Similar to the common heritability, social heritability was defined as the ratio between heritable social variance and total social phenotypic variance, higher heritability, bigger percentage of social variance were heritable. As expected, the mean accuracy of social genetic effect improved with the increase of social heritability (Table ). The accuracy of total genetic effect was affected mainly by the accuracy of direct genetic effect because social effect was very small relative to direct effect. However, the cumulative response of total genetic effect was affected mainly by social effect because it resulted in an extra-large genetic variance and enlarged the total genetic variation of trait in population (Table ). The proportion of mean gain of total genetic effect under social heritability of 0.5 and 0.8 relative to 0.1 were 115.10 and 116.10%, respectively, and the percentage for social genetic effect were 268.47 and 378.05, respectively.
Table 3. The mean accuracy (r) and genetic gain (Δ G) of genetic direct (Ad), social (As) and total effect (At) based on a social heritability (hs2).
The effect of genetic correlation between direct and social effect to selection efficiency
Table represents the selection efficiencies of direct, social and total genetic effect under different genetic correlations. The selection accuracies of social effect were negative values in the entire selection process when the genetic correlation between direct and social effect were negative (−0.5), which caused the cumulative response of total genetic effect to be less than direct genetic effect (Table ). The selection accuracies of social effect increased obviously with the increase of genetic correlation between direct and social effect, and its value was improved from 0.19 to 0.30 when the genetic correlation changed from 0.3 to 0.5. The mean gains of direct genetic effect under the genetic correlation of 0.3 and 0.5 were almost the same (1.43); however, it was decreased to 1.34 under −0.5.
Table 4. The mean accuracy (r) and genetic gain (Δ G) of genetic direct (Ad), social (As) and total effect (At) based on a specific genetic correlation (rAds) between genetic direct and social effect.
The effect of group member number to selection efficiency
Table lists the mean accuracies and gains for direct, social and total genetic effect under the pen size of 10 and 15 based on different ratios of social variance and direct variance. The cumulative response of total genetic effect improved with the increase of group member number, which was especially in the ratio of 10%. The percentages of gain for total genetic effect in the pen size of 10 relative to 15 were 100.90 and 115.85 under the ratio of 0.3% and 10%, respectively.
Table 5. The mean accuracy (r) and genetic gain (Δ G) of genetic direct (Ad), social (As) and total effect (At) based on a specific group member size (n) under different ratio of social and direct phenotypic variance.
The effect of genetic evaluation model to selection efficiency
The selection efficiencies for direct, social and total genetic effect using the full model (model 1) with direct and social genetic effect and the reduced model (model 2) without social genetic effect under different variance ratio are listed in Table . As expected, the mean accuracies of social genetic effect under model 1 were higher than model 2 at all scenarios of ratio of variance, which caused model 1 to result in more cumulative response than model 2. The percentages of genetic gain for social effect in model 2 relative to model 1 for the ratios of 0.3, 1 and 10% were 96.41, 94.51 and 96.32, respectively.
Table 6. The mean accuracy (r) and genetic gain (Δ G) of genetic direct (Ad), social (As) and total effect (At) based on two evaluation models under different ratio between social and direct phenotypic variance.
Discussion
The impact of social effect to selection
Our results show if there is some non-zero social variance for a specific socially affected trait, even though it may be small relative to direct phenotypic variance, then it can have a big impact on response to selection. In this study, the ratio between social and direct phenotypic variance was 0.3% in the base scenario. However, the percentage for the cumulative response of total genetic effect contributed by social effect was up to 15.27 (Figure ). Although social effect was very small, but its impact to total genetic response was large because the social effect resulted in an large extra genetic variance relative to the direct additive genetic variance. This case is especially evident under high social effect size. For example, under the ratio 10% of social and direct phenotypic variance, the additional genetic variance by social effect was up to 26.97. It was 9.80 times of direct phenotypic variance, which caused the percentage contributed by social effect was up to 62.97 (Figure ).
In this study, the genetic variance of social effect was set to decrease gradually with the increase of generation due to the increase of inbreeding. Interestingly, the simulated results indicated social genetic effect continued to respond to selection in the entire breeding process, which meant the genetic variance of social effect did not be exhausted even after a long-term selection.
The effect of evaluation model to selection
In this paper, two models were used to evaluate the breeding values of individuals in a simulated breeding programme: the full model (model 1) with direct and social genetic effect and the reduced model (model 2) without social genetic effect. The former included both direct and indirect genetic effect in the linear model, and the latter just considered the direct genetic effect using classical BLUP strategy. As expected, model 1 resulted in more cumulative response of total genetic effect than model 2 in all investigated cases because the former predicted both the direct and social breeding values of animals. However, the extra responses resulted by model 1 were not large as expected. For example, the percentages of genetic gain for total genetic effect in model 2 relative to model 1 under the ratios of 0.3 and 10% were up to 95.34 and 97.49 (Table ), respectively. These results showed, to the socially affected trait, the breeding value predicted by model 2 (classical BLUP method) also included both the direct and social breeding value, which implied the conventional breeding programme also involved the selection of social effect if the objective trait was a socially affected trait. This phenomenon may be because the groups in this simulation were composed mainly by full sib members due to the convenience to allocate. When groups consisted largely of full sibs, selection for classical breeding value based on model 2 captured a part of the social genetic variance (Bijma & Wade Citation2008), thus, also resulted in some part of selection response in social effect component. Interestingly, model 1 utilised fully the direct genetic effect under the low level of social effect, and resulted in more gain than model 2 at direct genetic effect (Table ). However, contrarily, when social effect was in high level (1% and 10%), model 1 tapped mainly the potential of social genetic effect, and resulted in more gain for social genetic effect and less gain for direct genetic effect than model 2 (Table ). These results show that model 1 can predict precisely the direct and social genetic effect in evaluation process. The percentage of social EBV in total EBV improved with the increase of social effect size, which caused model 1 to assign more weight to social genetic effect than direct genetic effect. However, with model 2, single EBV was predicted according to the total phenotype using BLUP method, and it tended to predict the additive genetic effect of individual. The weight assigned to direct EBV was bigger than social EBV, which caused model 2 to result in a loss of social genetic effect in the selecting process (Table ).
The effect of genetic correlation between direct and social effect to selection efficiency
In previous studies, the social effect was taken as ‘competitive effects’. However, Bergsma et al. (Citation2008) reported that most of growth traits in swine were positive correlation between direct and social effect. These social effects should be taken as ‘cooperation effects’. Competitive and cooperation are specific pattern of representation for social effect. In our study, the genetic correlation between direct and social effect reflected the pattern of expression of social effect, the positive correlation denoted social effect was cooperative, and the negative was competitive. Table lists the impact of genetic correlation between direct and social effect to selection efficiency in breeding programme. When the social effect was competitive effect (negative), the cumulative response of total genetic effect was less than direct genetic effect because the accuracy of social effect was negative, which resulted in negative cumulative response (Table ). In contrast, when the social effect was cooperation effect, the breeding programme resulted in more cumulative response in total genetic effect than direct genetic effect.
Conclusions
It is concluded that the selection of social genetic effect can result in more selection response in a longer term breeding programme even though social genetic effect has a very small effect on the interesting trait.
Disclosure statement
The authors report no conflicts of interest. The authors alone are responsible for the content and writing of this article.
Funding
The financial supports from National Natural Science Foundation of China [#C170102], Programme for Changjiang Scholars and Innovative Research Team in University [#IRT13083], National Development and Reform Commission [(2014)2573] and Earmarked Fund for China Agriculture Research System [#CARS-36-03A] are greatly appreciated.
Related Research Data
References
- Arango J, Misztal I, Tsuruta S, Culbertson M, Herring W. 2005. Estimation of variance components including competitive effects of large white growing gilts. J Anim Sci. 83:1241–1246.
- Bergsma R, Kanis E, Knol EF, Bijma P. 2008. The contribution of social effects to heritable variation in finishing traits of domestic pigs (Sus scrofa). Genetics. 178:1559–1570.
- Bergsma R, Mathur PK, Kanis E, Verstegen MWA, Knol EF, Van Arendonk JAM. 2013. Genetic correlations between lactation performance and growing-finishing traits in pigs. J Anim Sci. 91:3601–3611.
- Bijma P, Muir WM, van Arendonk JAM. 2007. Multilevel selection 1: quantitative genetics of inheritance and response to selection . Genetics. 175:277–288.
- Bijma P, Wade MJ. 2008. The joint effects of kin, multilevel selection and indirect genetic effects on response to genetic selection. J Evol Biol. 21:1175–1188.
- Cassady JP, Van-Vleck LD. 2004. Estimation of (co) variance components due to genetic competition effects in pigs. J Anim Sci. 82:38.
- Chen CY, Johnson RK, Newman S, Kachman SD, Van Vleck LD. 2009. Effects of social interactions on empirical responses to selection for average daily gain of boars. J Anim Sci. 87:844–849.
- Ellen ED, Muir WM, Teuscher F, Bijma P. 2007. Genetic improvement of traits affected by interactions among individuals: sib selection schemes. Genetics. 176:489–499.
- Falconer DS, Mackay TFC. 1996. Introduction to quantitative genetics. Harlow: Longman.
- Khaw HL, Ponzoni RW, Bijma P. 2014. Indirect genetic effects and inbreeding: consequences of BLUP selection for socially affected traits on rate of inbreeding. Genet Select Evol. 46:39.
- Madsen P, Jensen J. 2006. A user’s guide to DMU A package for analysing multivariate mixed models. Version 6, release 4.6. Danish Institute of Agricultural Sciences, 27.
- Muir WM. 1996. Group selection for adaptation to multiple-hen cages: selection program and direct responses. Poult Sci. 75:447–458.
- Muir WM. 2005. Incorporation of competitive effects in forest tree or animal breedingprograms. Genetics. 170:1247–1259.